Consumer Behavior Analysis: Bathing Soap Procurement Study

Verified

Added on  2023/06/07

|38
|3482
|162
Report
AI Summary
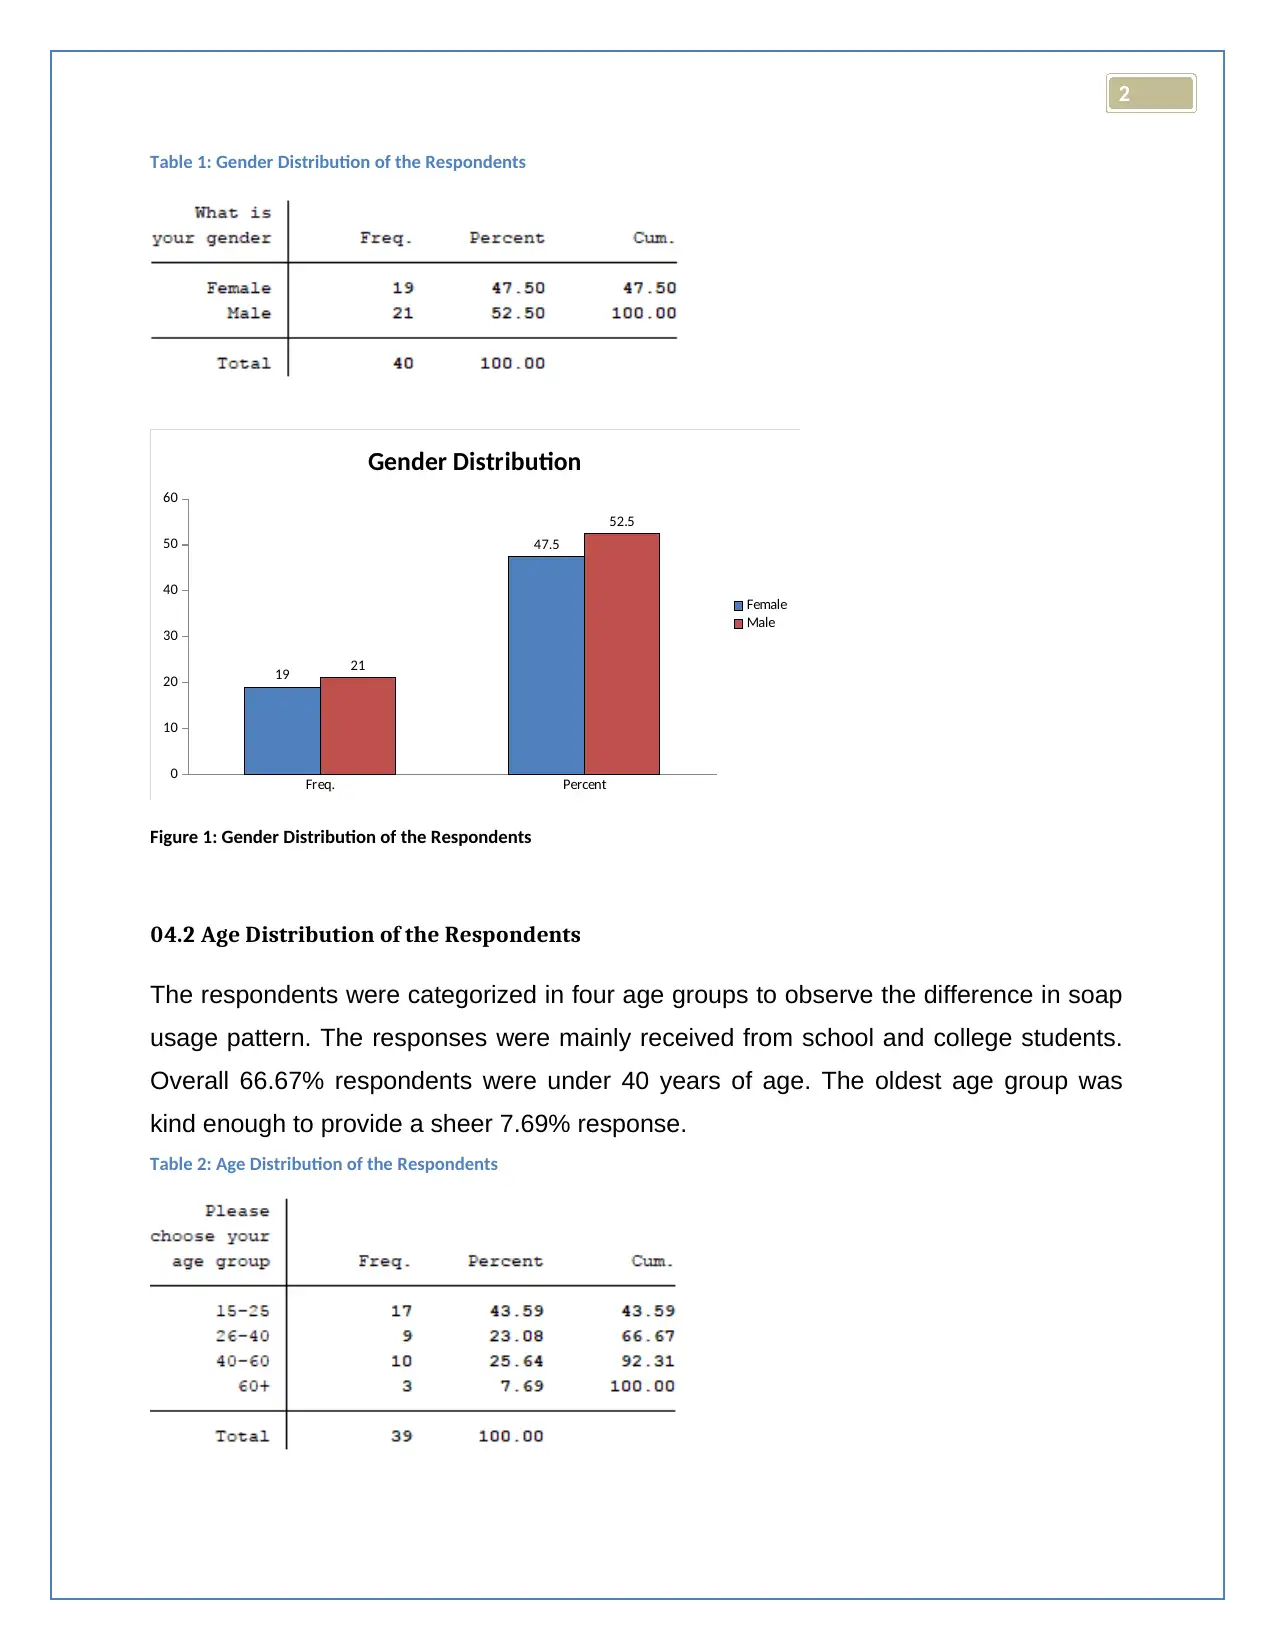
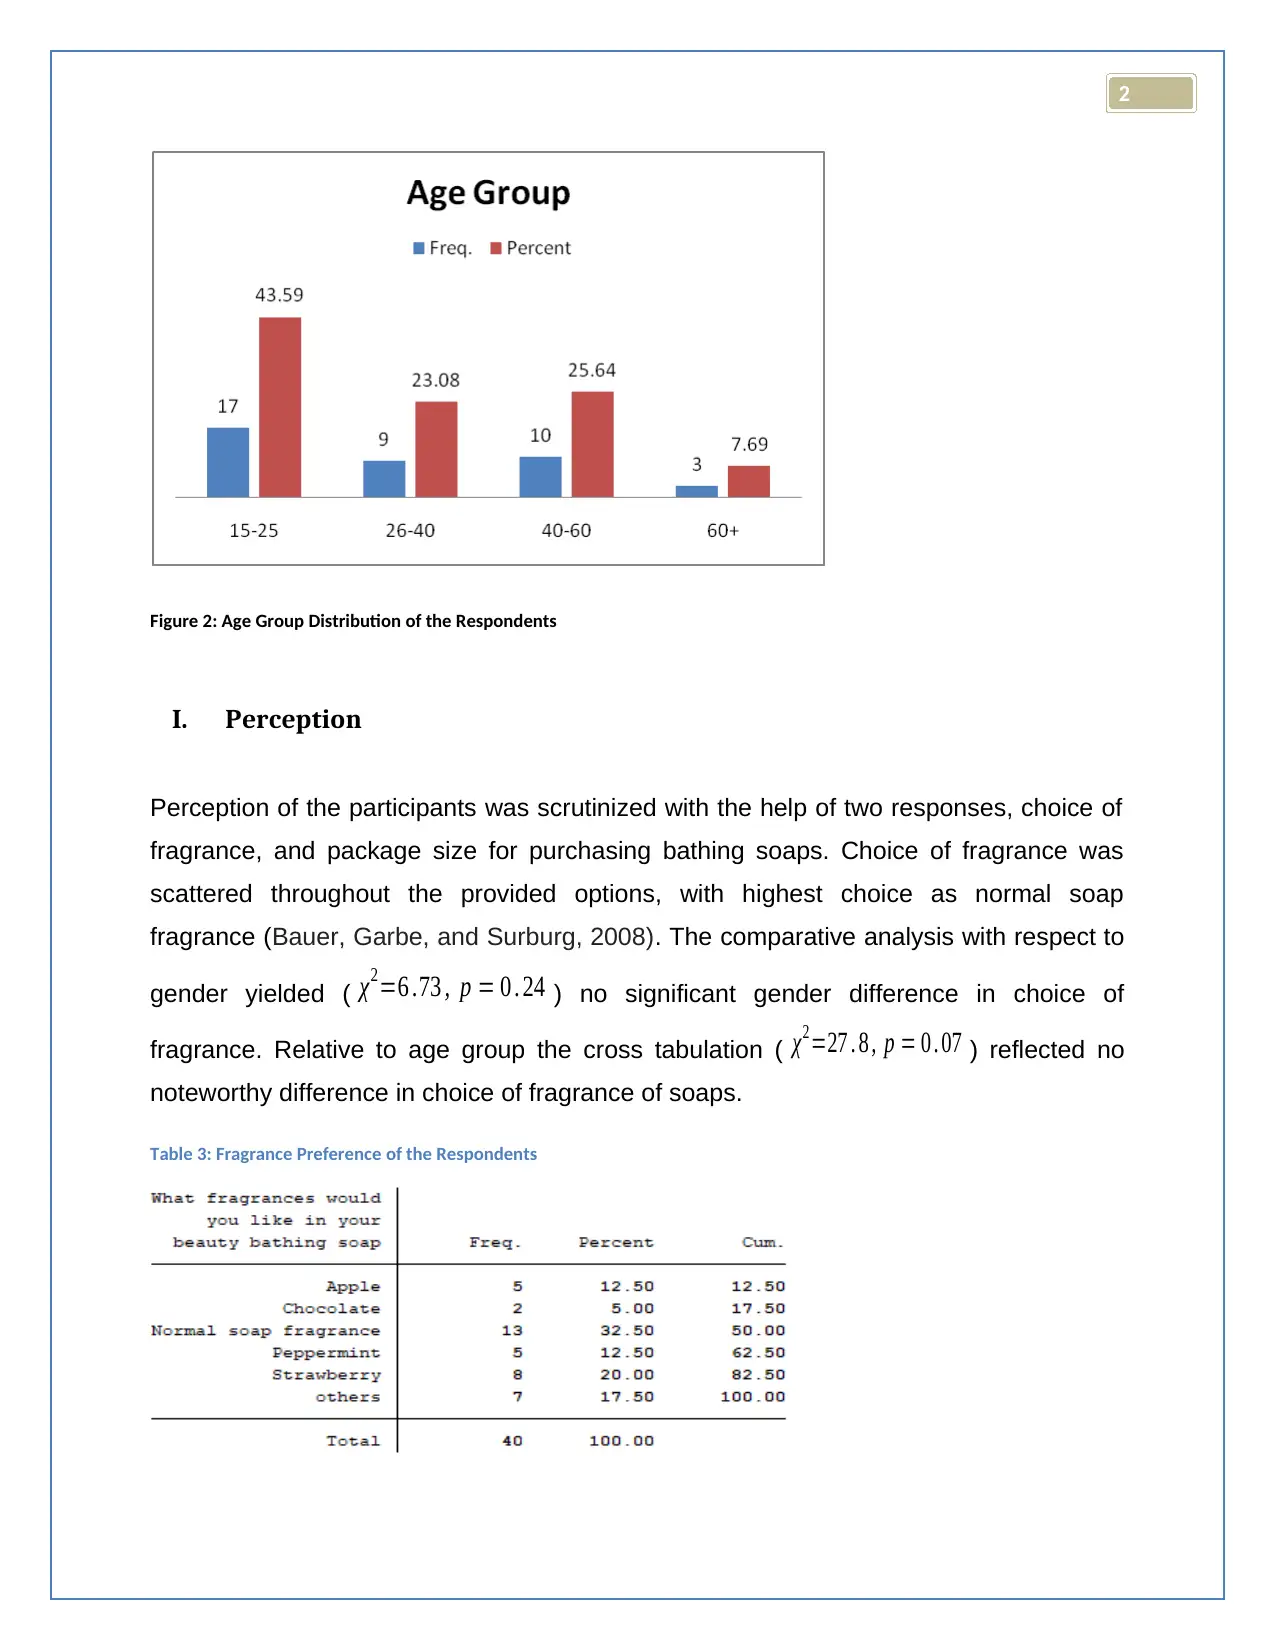
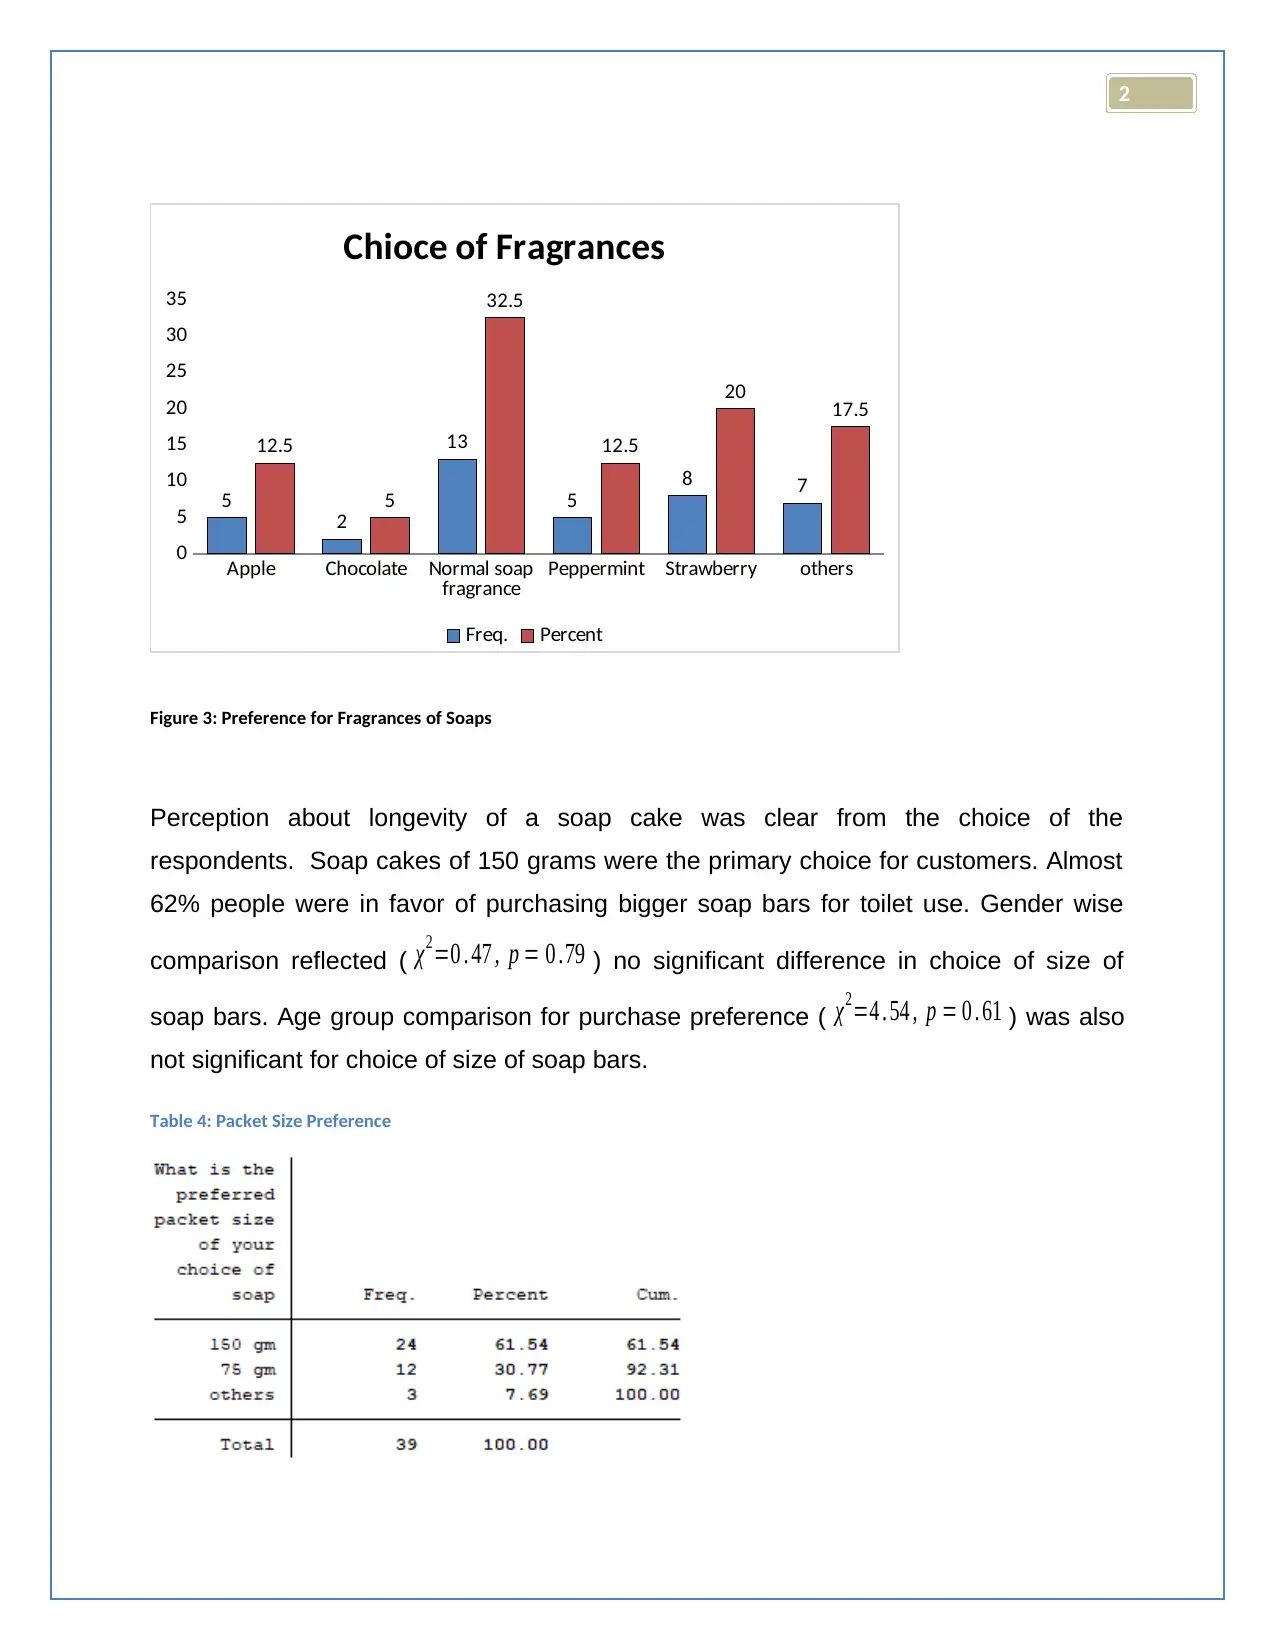
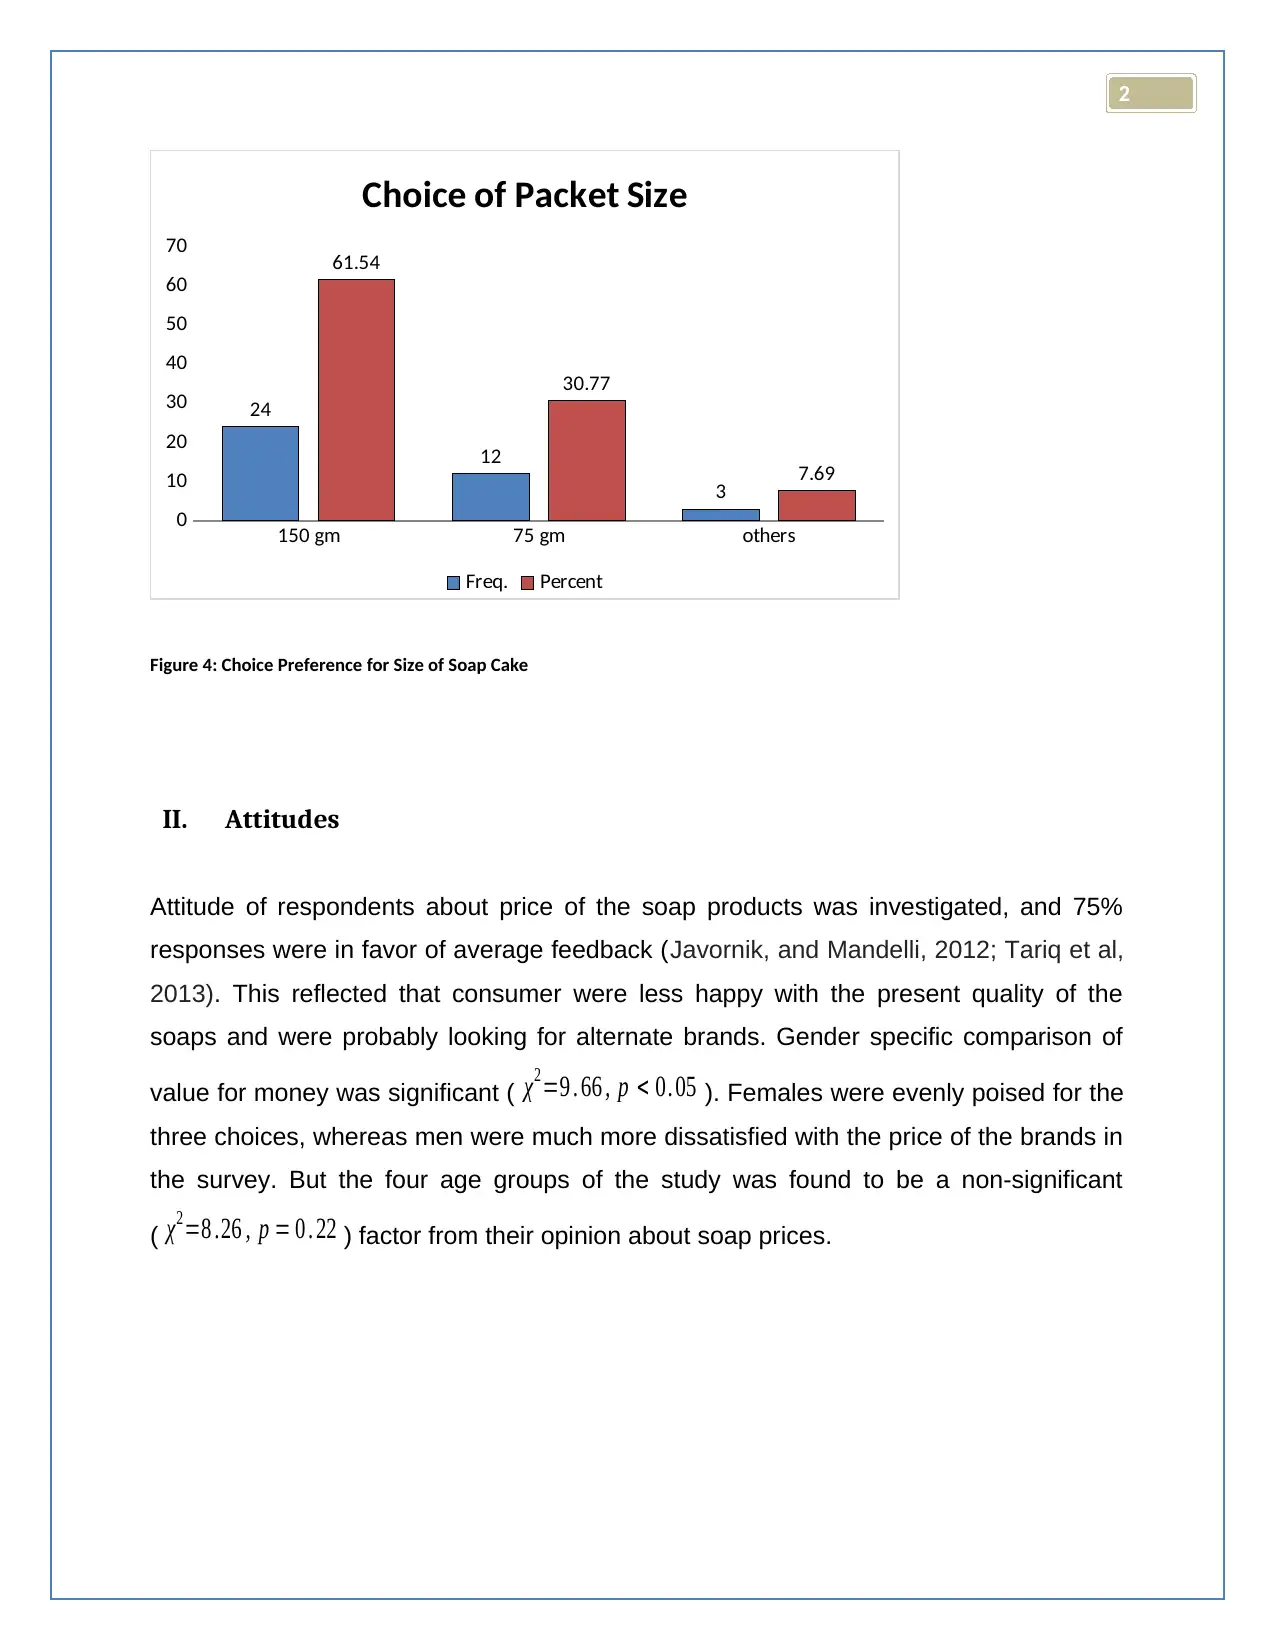
This report presents an exploratory study on consumer behavior analysis in the fast-moving consumer goods (FMCG) sector, specifically focusing on bathing soap procurement. The research utilizes a survey instrument developed on the Survey Monkey platform to collect primary data from 40 respondents, examining their preferences, attitudes, and motivations. The data analysis includes gender and age classifications, revealing insights into fragrance preferences, package size choices, and value perceptions. The study explores the influence of social media on purchasing decisions and investigates brand preferences, highlighting cultural and lifestyle factors. Key findings include the prominence of fragrance as a purchase attribute, the impact of social media advertisements, and the preference for larger soap bar sizes. The report concludes with a discussion of consumer motivations and the implications for FMCG marketing strategies, with the data analyzed using Excel and STATA. The study provides a valuable understanding of consumer behavior within the competitive bathing soap market.
tabler-icon-diamond-filled.svg

Contribute Materials

Your contribution can guide someone’s learning journey. Share your documents today.
Document Page
2
Consumer Behavior Analysis in FMCG
Procurement – An Exploratory Study for Bathing
Soaps
tabler-icon-diamond-filled.svg

Secure Best Marks with AI Grader

Need help grading? Try our AI Grader for instant feedback on your assignments.
Document Page
2
Table of Contents
01. Research Objective.................................................................3
02. Development of survey instrument.........................................3
03. Administration processes........................................................4
04. Data Analysis..........................................................................4
04.1 Gender Classification........................................................4
04.2 Age Distribution of the Respondents................................5
I. Perception.............................................................................6
II. Attitudes................................................................................ 8
III. Motivation...........................................................................9
IV. Group and Individual Differences......................................12
V. Culture................................................................................. 13
VI. Family and lifestyle...........................................................14
05. Key Findings.......................................................................... 16
0.6 References............................................................................17
0.7 Appendix - A.......................................................................... 19
Survey Monkey Graphical Representation of Results..................19
08. Appendix B: Survey Monkey Graphical Representation of
Results........................................................................................ 21
09. Appendix – B (Chi – Square Tests).........................................30
Document Page
2
01. Research Objective
The main objective was to analyze the various requirements and aspirations of
consumer goods purchases. It is important that needs of the customers are met and
FMCG product features are explained and simplified. This testimony describes the
different needs of consumers to purchase bathing soap, a most regular personal care
FMCG product (Deliya, 2012; Subrahmanyan, and Tomas Gomez-Arias, 2008). The
attributes of customer priorities are highlighted here. This investigation explains the
demographical features of the consumer. The analysis was done on the alternative
procurement methods, customer satisfaction after consumer behavior and satisfaction.
Consumer products are finally about choice of the consumers, and whether they're
satisfied when buying them directly from the market for their families. They are the most
important external stakeholders of the company and are also independent. Consumers
can receive information from various media, television advertisements and from family
members, friends and people who have used soap (Hollebeek, Glynn, and Brodie,
2014). Consumers will feel pleased if they realize that their products are used to meet
their expectations and they are repurchasing it, and may be recommending to others.
Market competitors in toilet soap industry are extremely competitive and soap making
technology keeps changing rapidly. Along with that, ethical consumerism with
environment fortification have increased price of the soaps. The article reveals the
importance of contrast creativity of the products for attracting customers, as brands of
soaps are not at well differentiated by customers (Mohankumar, and Shivaraj, 2010).
02. Development of survey instrument
The data collection was administered in accordance with the purpose of the research.
Primary data collection technique was applied for collecting direct feedback from
customers. This way validity of the collected information helped in defining the original
characteristics of the data. A self-structured questionnaire was prepared utilizing the
Document Page
2
Survey Monkey platform. Along with demographic information of age and gender, eight
multiple choice questions (close ended) were included in the survey. Expected time to
complete the survey for an individual was estimated as one minute by Survey Monkey.
03. Administration processes
The ethical consideration part was included in the initial part of the survey. The
respondents were assured of privacy of their responses. The approval was taken from
the ethical committee of the university. The complete survey questionnaire was
circulated for collection of responses. The link of the survey was shared through social
media platforms as Facebook, and WhatsApp. The link was also shared through emails
and messages. The survey was open for 3 days and the convenience sampling yielded
40 responses. The collected data was investigated for missing values and after
thorough cross checking analysis was performed using two data mining tools, Excel and
STATA.
04. Data Analysis
The objective of the survey was to categorize the purchase pattern of the customers.
Gender and age wise cross tabulation was performed to identify the primary brand of
soap that respondents were using. Effects of social and economic achieve on the
reasons of choice were also investigated.
04.1 Gender Classification
The responses were categorized on gender basis as well as on age group basis. 52.5%
responses were from females, and the rest 42.5% were males. No missing information
was seen in this field.
tabler-icon-diamond-filled.svg

Secure Best Marks with AI Grader

Need help grading? Try our AI Grader for instant feedback on your assignments.
Document Page
2
Table 1: Gender Distribution of the Respondents
Freq. Percent
0
10
20
30
40
50
60
19
47.5
21
52.5
Gender Distribution
Female
Male
Figure 1: Gender Distribution of the Respondents
04.2 Age Distribution of the Respondents
The respondents were categorized in four age groups to observe the difference in soap
usage pattern. The responses were mainly received from school and college students.
Overall 66.67% respondents were under 40 years of age. The oldest age group was
kind enough to provide a sheer 7.69% response.
Table 2: Age Distribution of the Respondents
Document Page
2
Figure 2: Age Group Distribution of the Respondents
I. Perception
Perception of the participants was scrutinized with the help of two responses, choice of
fragrance, and package size for purchasing bathing soaps. Choice of fragrance was
scattered throughout the provided options, with highest choice as normal soap
fragrance (Bauer, Garbe, and Surburg, 2008). The comparative analysis with respect to
gender yielded ( χ2=6 .73 , p = 0 . 24 ) no significant gender difference in choice of
fragrance. Relative to age group the cross tabulation ( χ2=27 . 8 , p = 0 . 07 ) reflected no
noteworthy difference in choice of fragrance of soaps.
Table 3: Fragrance Preference of the Respondents
Document Page
2
Apple Chocolate Normal soap
fragrance Peppermint Strawberry others
0
5
10
15
20
25
30
35
5
2
13
5
8 7
12.5
5
32.5
12.5
20 17.5
Chioce of Fragrances
Freq. Percent
Figure 3: Preference for Fragrances of Soaps
Perception about longevity of a soap cake was clear from the choice of the
respondents. Soap cakes of 150 grams were the primary choice for customers. Almost
62% people were in favor of purchasing bigger soap bars for toilet use. Gender wise
comparison reflected ( χ2=0 . 47 , p = 0 .79 ) no significant difference in choice of size of
soap bars. Age group comparison for purchase preference ( χ2=4 . 54 , p = 0 . 61 ) was also
not significant for choice of size of soap bars.
Table 4: Packet Size Preference
tabler-icon-diamond-filled.svg

Paraphrase This Document

Need a fresh take? Get an instant paraphrase of this document with our AI Paraphraser
Document Page
2
150 gm 75 gm others
0
10
20
30
40
50
60
70
24
12
3
61.54
30.77
7.69
Choice of Packet Size
Freq. Percent
Figure 4: Choice Preference for Size of Soap Cake
II. Attitudes
Attitude of respondents about price of the soap products was investigated, and 75%
responses were in favor of average feedback (Javornik, and Mandelli, 2012; Tariq et al,
2013). This reflected that consumer were less happy with the present quality of the
soaps and were probably looking for alternate brands. Gender specific comparison of
value for money was significant ( χ2=9 . 66 , p < 0. 05 ). Females were evenly poised for the
three choices, whereas men were much more dissatisfied with the price of the brands in
the survey. But the four age groups of the study was found to be a non-significant
( χ2=8 .26 , p = 0 . 22 ) factor from their opinion about soap prices.
Document Page
2
Table 5: Value for Money of the Respondents
Above average Average Excellent
0
5
10
15
20
25
30
35
40
45
50
18
12 10
45
30
25
Value for Money
Freq. Percent
Figure 5: Views about Value for Money of Soap Used by Customer
III. Motivation
Consumer motivation was scrutinized through motives of purchase of the brands, and
effect on social media on procurement decision. Fragrance was the most prominent
attribute for section of the bathing product, followed by color of the bars. Gender
comparison yielded no significant results ( χ2=5 . 46 , p = 0. 24 ), indicating that choices of
men and women were almost equally distributed. But, age comparison revealed that
choice of attribute was significantly different among the four groups ( χ2=21. 23 , p <0 . 05 ).
Document Page
2
Fragrance and then color were noticeable choices for respondents aged between 15
years and 25 years. Older people were more inclined towards price and packaging of
the products.
Table 6: Reason for Purchasing Bath Soaps
Color Fragrance Price Thickness packaging
0
10
20
30
40
50
60
70
8
23
5 2 2
20
57.5
12.5
5 5
Most Important Attributes
Freq. Percent
Figure 6: Important Reason for Purchase
Effect of social media on the respondents was noticeable from the shape of the
distribution of the answers. Purchase choice was affected by advertisements in TV,
newspaper and other social media. Uncertainty in product choice was visible in the
tabler-icon-diamond-filled.svg

Secure Best Marks with AI Grader

Need help grading? Try our AI Grader for instant feedback on your assignments.
Document Page
2
pattern of the responses. 57.5% respondents were found to buy products under social
influence. The competitors in FMCG market for toilet soaps were found to influence
consumer choice using social media. The gender wise comparison was assessed for
the effect of mass media, and no significant result ( χ2=5 .54 , p = 0 . 24 ) was found. It
signified that both the genders were equally influenced by advertisements of the
products. The differentiating effect of advertisement on the age groups was not
significant ( χ2=17 . 47 , p = 0 .13 ). Respondents from all the age groups were found to be
equally prompted by mass media towards different brands.
Table 7: Effect of Advertisement on Respondents
Extremely likely Not at all likely Not so likely Somewhat
likely Very likely
0
5
10
15
20
25
30
35
40
1
6
11 14
8
2.5
15
27.5
35
20
Influence of Advertisement
Freq. Percent
Figure 7: Effect of Social Media for Brand Choice
Document Page
2
IV. Group and Individual Differences
An individual difference in product preference was highlighted by choice of brands of the
soap cakes. The shape of the frequency distribution revealed that 65% responses were
looking for alternate brands. The major reason might have been dissatisfaction with
current brands and higher price of the products. Bathing soap is very much a personal
choice and willingness to change the brand reveals the level of displeasure of the
consumer. Gender wise difference in unhappiness was not ( χ2=5 .32 , p = 0 .26 ) a
signification indicator. Age wise choices were also not significant ( χ2=15 .27 , p = 0 . 23 )
enough to find any differences in opinions about preference for alternate brands.
Table 8: Choice of Alternate Brands
Document Page
2
Extremely likely Not at all likely Not so likely Somewhat
likely Very likely
0
5
10
15
20
25
30
35
40
45
1 3
10
17
9
2.5
7.5
25
42.5
22.5
Alternative Choice of Preference
Freq. Percent
Figure 8: Opinion about Alternative Selection
V. Culture
The cultural backdrop of the survey respondents was evaluated through brand
preference. 50% of the responses were using Fragonard MA Perfumed body soap,
whereas almost 24% responses were collected in favor of Acca Kappa. Both the brands
are multinational brands, where Acca Kappa manufactures unique collection of fragrant
toiletries. The perfume collection of Acca Kappa is also admirable. Fragonard MA
Perfumed creates collection of modern perfumery. This 19th century company is world
renowned name in perfume making. Choice of fragrance of the consumers was evident
from the option of the brands in the survey. Attraction towards perfumes is an old and
well known attribute of human. Other than any other characteristic of toilet or cosmetic
products, fragrance has the dominant effect on purchasing decisions. Both the genders
were found to be equally attracted towards both of the products ( χ2=3 .72 , p = 0 .29 ). Age
corresponding difference in choice was found to be significant
( χ2=17 . 44 , p < 0. 05 ).Fragonard MA Perfumed soap was found to be preferred choice
through all the age groups, especially for teenagers and young individuals.
tabler-icon-diamond-filled.svg

Paraphrase This Document

Need a fresh take? Get an instant paraphrase of this document with our AI Paraphraser
Document Page
2
Table 9: Brand Preference of the Respondents
Acca Kappa Fragonard
MaPerfumed
Soap
Neeti Dante Thymes GoldLeaf
Bath Soap
0
10
20
30
40
50
60
Brand Distribution of Body Soaps
Freq. Percent
Figure 9: Preference of Brands
VI. Family and lifestyle
Involvement with family and lifestyle was assessed trough frequency of purchase of the
soap cakes. Majority of the respondents were found to buy soaps on a bi-weekly basis.
Purchase due to number of family members might have been the influencing factor for
their purchase frequency. 55% of the responses were in favor by purchasing soaps
every 15 days. Though, gender wise comparison revealed that ( χ2=2. 63 , p = 0 .27 ) there
was no significant difference in purchase frequency. People of both the genders were
Document Page
2
purchasing soaps for their families on an equal distribution pattern. Age was an
important factor in purchasing frequency. Responses from all the four age groups were
skewed towards bi-weekly purchase. A significant difference was observed
( χ2=23 .16 , p < 0. 05 ) between the 15 days purchasing schedule and other options.
People were less habituated in buying soaps once in every month. But, 30.77%
responses revealed that a noticeable number of consumers were buying soaps every
two months. This was an important observation from the point of view of the soap
brands.
Table 10: Frequency of Purchasing Body Soaps
Once in 15 days Once in every 2
months Once in month
0
10
20
30
40
50
60
22
6
12
55
15
30
Frequency of Purchase
Freq. Percent
Figure 10: Distribution of Purchasing Frequency
Document Page
2
05. Key Findings
From the responses it was discovered that paramount criteria for selection of a
particular brand depends on fragrance and size of the soap cakes. Young populace was
more attracted towards fragrance and color of the soaps (Gatti, Bordegoni, and Spence,
2014). Price and packaging were other two product criteria for rating the soaps,
especially for old age group. People were favoring soaps with normal fragrances other
than typical strong essence. The price consciousness was reflected from the analysis of
the responses. Due to size effectiveness purchase tendency for small soap bars was
observed (Deliya, and Parmar, 2012). Smaller toilet soaps are always convenient for
carrying and travelling purposes. Reservation towards a particular brand that was used
by the customer was clearly apprehended, probable reason was fragrance of the soaps
in the current survey. Probability in alteration in choice for brand was found to some
extent, especially in absence of preferred brand. Here, customers were found be unable
to differentiate among the brands (Dallmeier-Tiessen et al., 2010). Effect of
advertisements was visible among all age groups and the two genders. Consumers
were found to be frequent purchaser of bathing soaps; this was a positive indication for
market players. The current study was useful from market competitors and
manufacturer of different soap brands (Comiskey et al., 2017; Calder, Isaac, and
Malthouse, 2015).
The survey had its own limitations; especially due to convenience sampling the nature
of the responses was impacted. Sample size of the study was not verified for its
effectiveness. In case of random sampling with large sample size, the outputs of this
research may have different inferences. The demographic details of participants, such
as marital status, number of kids and location of staying could be included in future
researches for detail analysis of the consumer (Katiyar, and Katiyar, 2014;
Schwarzkopf, 2009). Variety in soap products with more choices in packaging weight,
variety of fragrance, and more importantly shapes could be the impact factors in future
market studies.
tabler-icon-diamond-filled.svg

Secure Best Marks with AI Grader

Need help grading? Try our AI Grader for instant feedback on your assignments.
Document Page
2
0.6 References
Bauer, K., Garbe, D. and Surburg, H., 2008. Common fragrance and flavor materials:
preparation, properties and uses. John Wiley & Sons.
Calder, B.J., Isaac, M.S. and Malthouse, E.C., 2015. How to capture consumer
experiences: A context-specific approach to measuring engagement: Predicting
consumer behavior across qualitatively different experiences. Journal of Advertising
Research, pp.JAR-2015.
Comiskey, D., Api, A.M., Barrett, C., Ellis, G., McNamara, C., O'mahony, C., Robison,
S.H., Rose, J., Safford, B., Smith, B. and Tozer, S., 2017. Integrating habits and
practices data for soaps, cosmetics and air care products into an existing aggregate
exposure model. Regulatory Toxicology and Pharmacology, 88, pp.144-156.
Dallmeier-Tiessen, S., Goerner, B., Darby, R., Hyppoelae, J., Igo-Kemenes, P., Kahn,
D., Lambert, S., Lengenfelder, A., Leonard, C., Mele, S. and Polydoratou, P., 2010,
August. First results of the SOAP project. In COASP (2nd Conference on Open Access
Scholarly Publishing).
Deliya, M., 2012. Consumer behavior towards the new packaging of FMCG
products. National Monthly Refereed Journal of Research in Commerce and
Management, 1(11), pp.199-211.
Deliya, M.M.M. and Parmar, M.B.J., 2012. Role of Packaging on Consumer Buying
Behavior –Patan District. Global Journal of Management and Business
Research, 12(10).
Gatti, E., Bordegoni, M. and Spence, C., 2014. Investigating the influence of colour,
weight, and fragrance intensity on the perception of liquid bath soap: An experimental
study. Food Quality and Preference, 31, pp.56-64..
Hollebeek, L.D., Glynn, M.S. and Brodie, R.J., 2014. Consumer brand engagement in
social media: Conceptualization, scale development and validation. Journal of
interactive marketing, 28(2), pp.149-165.
Document Page
2
Javornik, A. and Mandelli, A., 2012. Behavioral perspectives of customer engagement:
An exploratory study of customer engagement with three Swiss FMCG brands. Journal
of Database Marketing & Customer Strategy Management, 19(4), pp.300-310.
Katiyar, A. and Katiyar, N., 2014. An empirical study of Indian consumer buying
behavior of FMCG products (with special reference of bathing soap). International
journal of management and commerce innovations, 2(1), pp.211-217.
Mohankumar, T.P. and Shivaraj, B., 2010. Product Mix Strategies: FMCG in Indian
Market. SCMS Journal of Indian Management, 7(2).
Schwarzkopf, S., 2009. Discovering the consumer: Market research, product innovation,
and the creation of brand loyalty in Britain and the United States in the interwar
years. Journal of Macromarketing, 29(1), pp.8-20.
Subrahmanyan, S. and Tomas Gomez-Arias, J., 2008. Integrated approach to
understanding consumer behavior at bottom of pyramid. Journal of Consumer
Marketing, 25(7), pp.402-412.
Tariq, M.I., Nawaz, M.R., Nawaz, M.M. and Butt, H.A., 2013. Customer perceptions
about branding and purchase intention: a study of FMCG in an emerging
market. Journal of Basic and Applied Scientific Research, 3(2), pp.340-347.
Document Page
2
0.7 Appendix - A
Survey Monkey Graphical Representation of Results
tabler-icon-diamond-filled.svg

Paraphrase This Document

Need a fresh take? Get an instant paraphrase of this document with our AI Paraphraser
Document Page
2
Document Page
2
08. Appendix B: Survey Monkey Graphical Representation
of Results
Document Page
2
tabler-icon-diamond-filled.svg

Secure Best Marks with AI Grader

Need help grading? Try our AI Grader for instant feedback on your assignments.
Document Page
2
Document Page
2
Document Page
2
tabler-icon-diamond-filled.svg

Paraphrase This Document

Need a fresh take? Get an instant paraphrase of this document with our AI Paraphraser
Document Page
2
Document Page
2
Document Page
2
tabler-icon-diamond-filled.svg

Secure Best Marks with AI Grader

Need help grading? Try our AI Grader for instant feedback on your assignments.
Document Page
2
Document Page
2
09. Appendix – B (Chi – Square Tests)
Document Page
2
tabler-icon-diamond-filled.svg

Paraphrase This Document

Need a fresh take? Get an instant paraphrase of this document with our AI Paraphraser
Document Page
2
Document Page
2
Document Page
2
tabler-icon-diamond-filled.svg

Secure Best Marks with AI Grader

Need help grading? Try our AI Grader for instant feedback on your assignments.
Document Page
2
Document Page
2
Document Page
2
tabler-icon-diamond-filled.svg

Paraphrase This Document

Need a fresh take? Get an instant paraphrase of this document with our AI Paraphraser
Document Page
2
chevron_up_icon
1 out of 38
circle_padding
hide_on_mobile
zoom_out_icon
logo.png

Your All-in-One AI-Powered Toolkit for Academic Success.

Available 24*7 on WhatsApp / Email

[object Object]