Foster's Beer: Marketing Research Report and Reliability Analysis
VerifiedAdded on 2020/04/13
|26
|4312
|124
Report
AI Summary
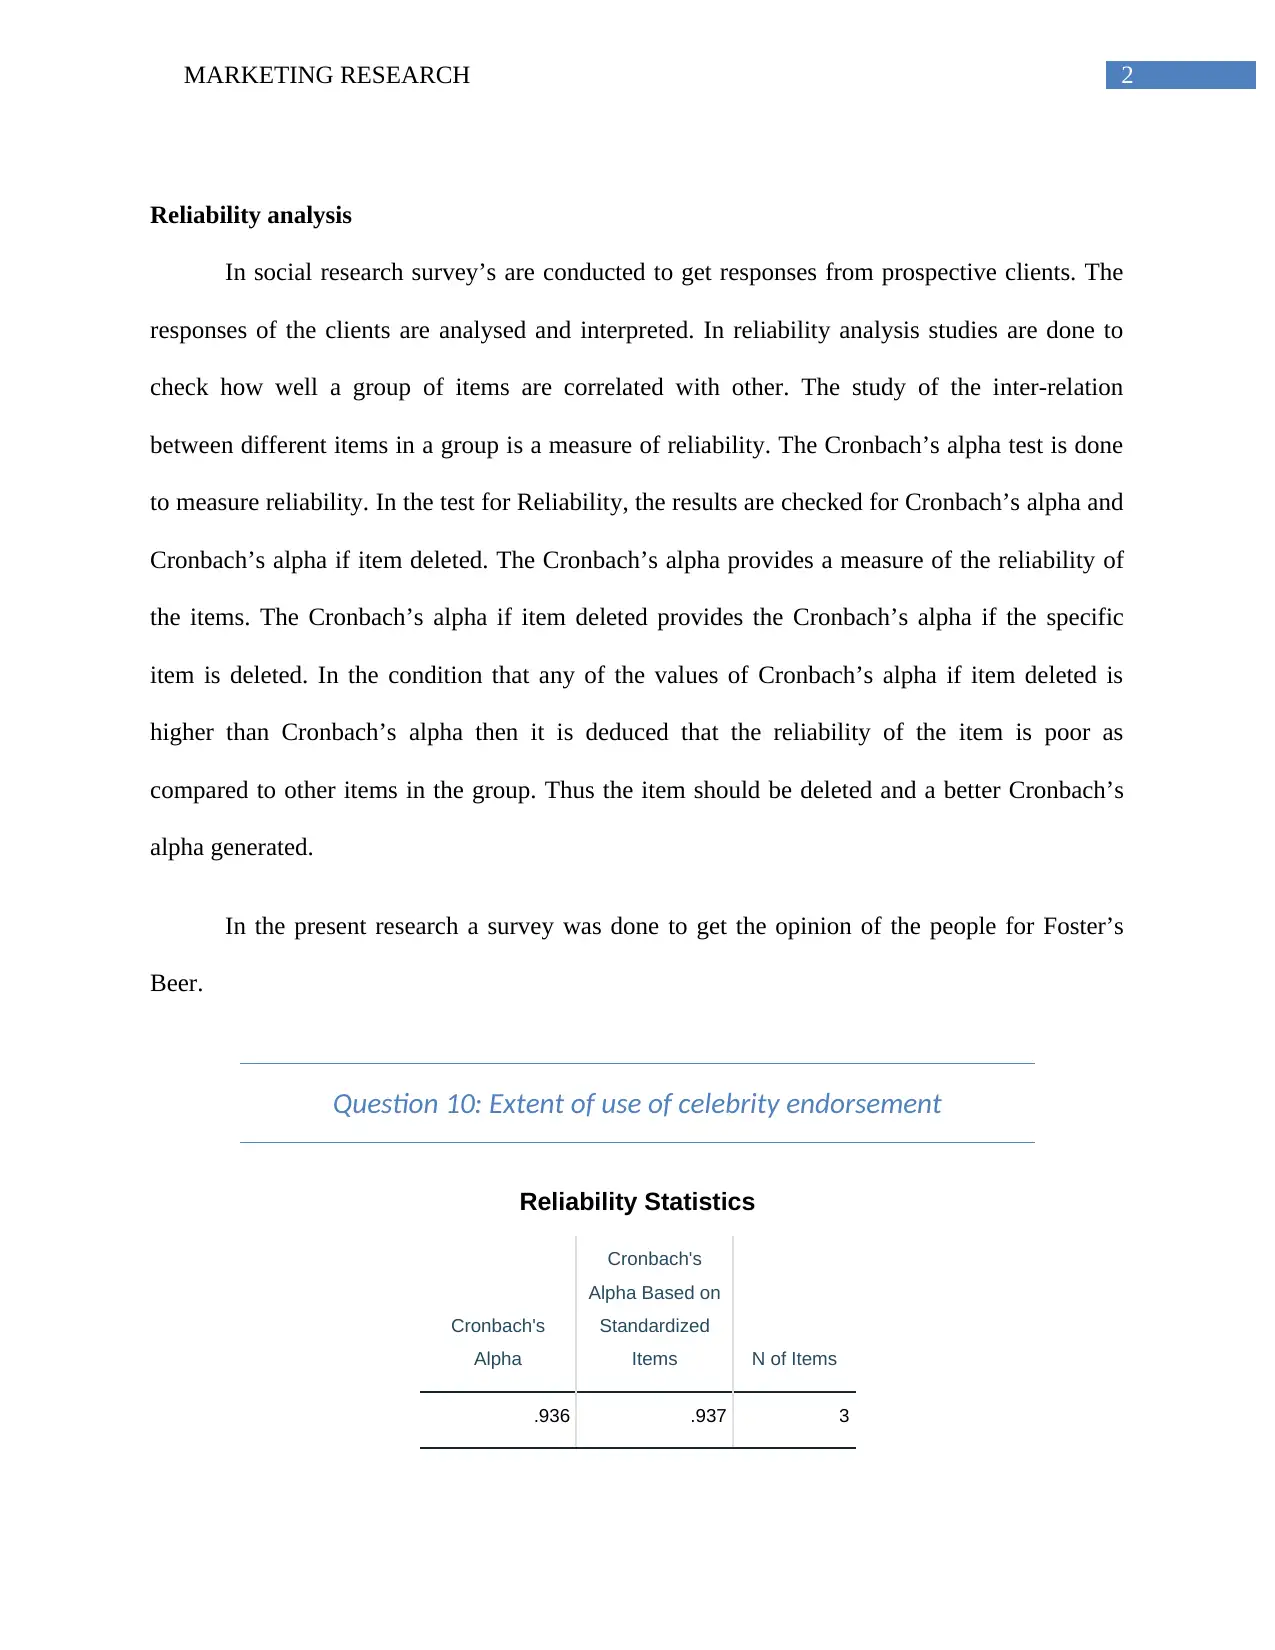
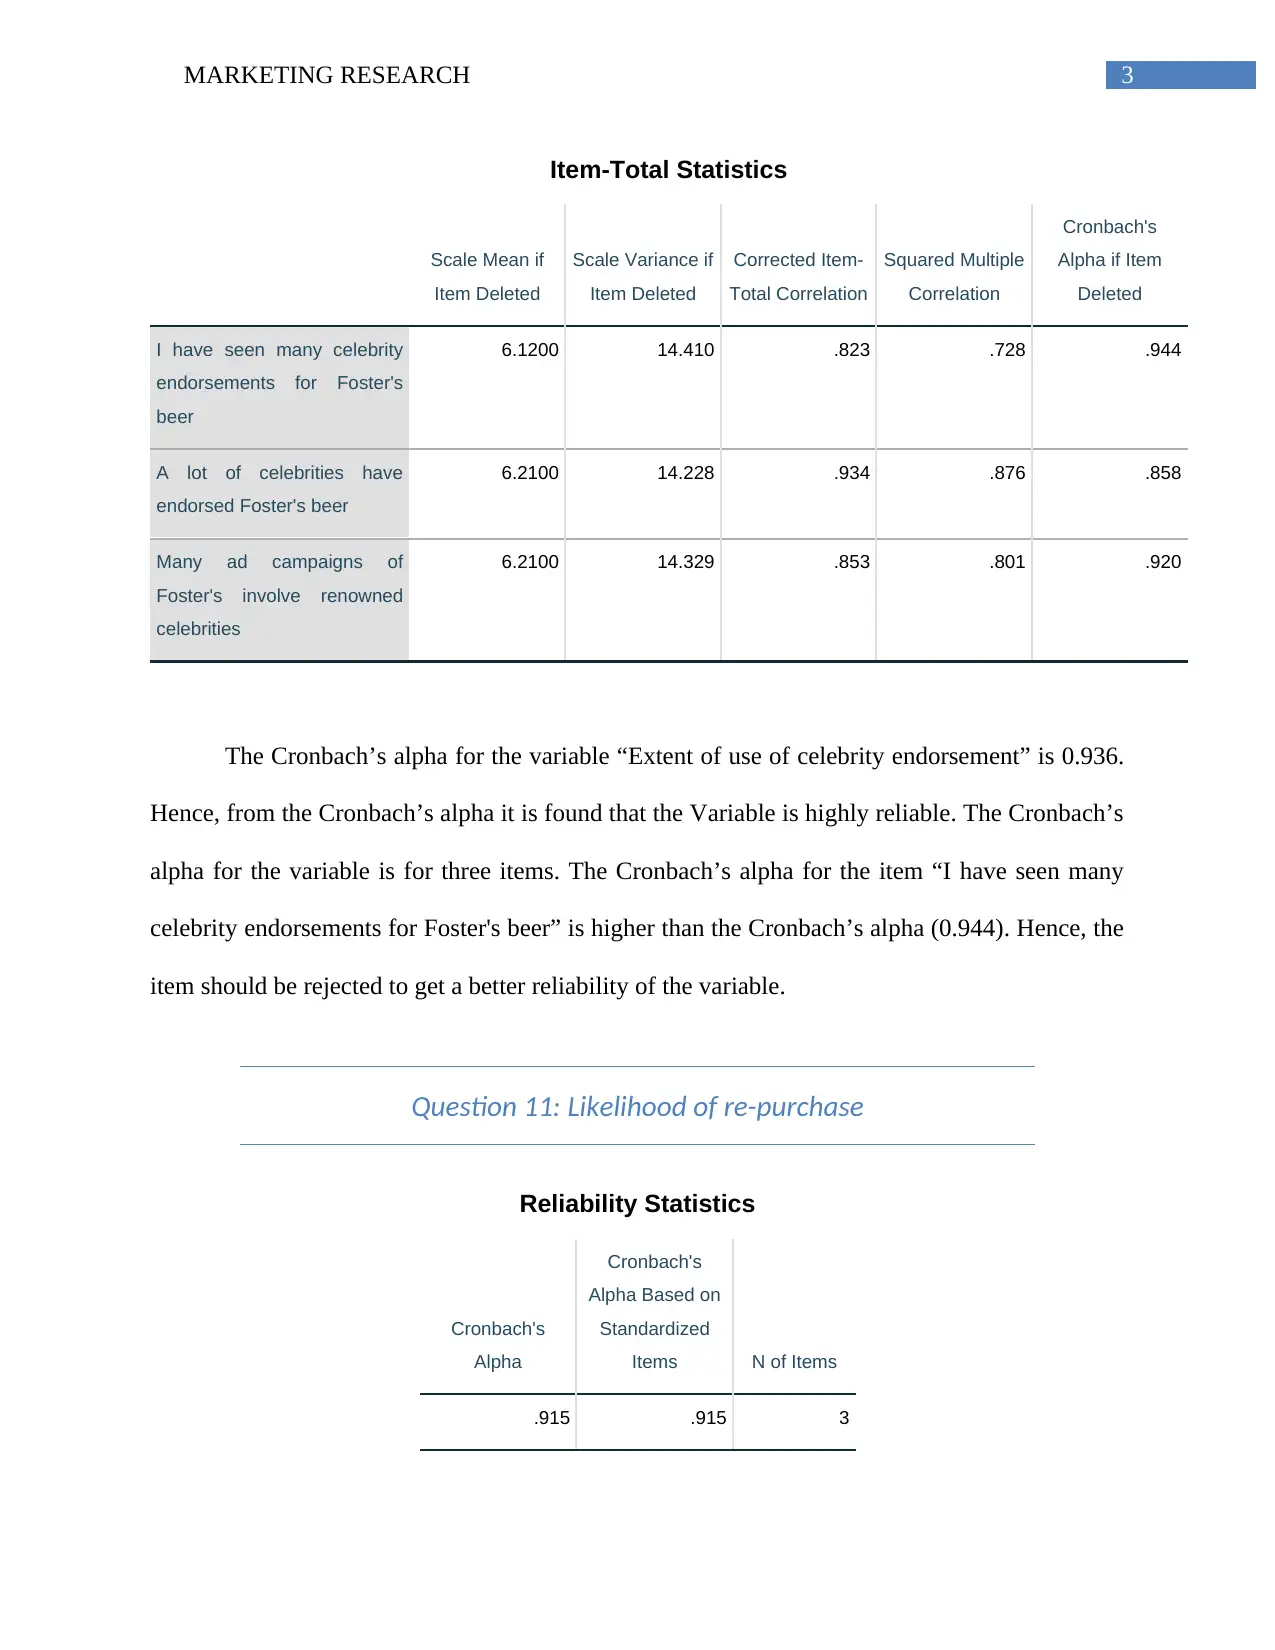
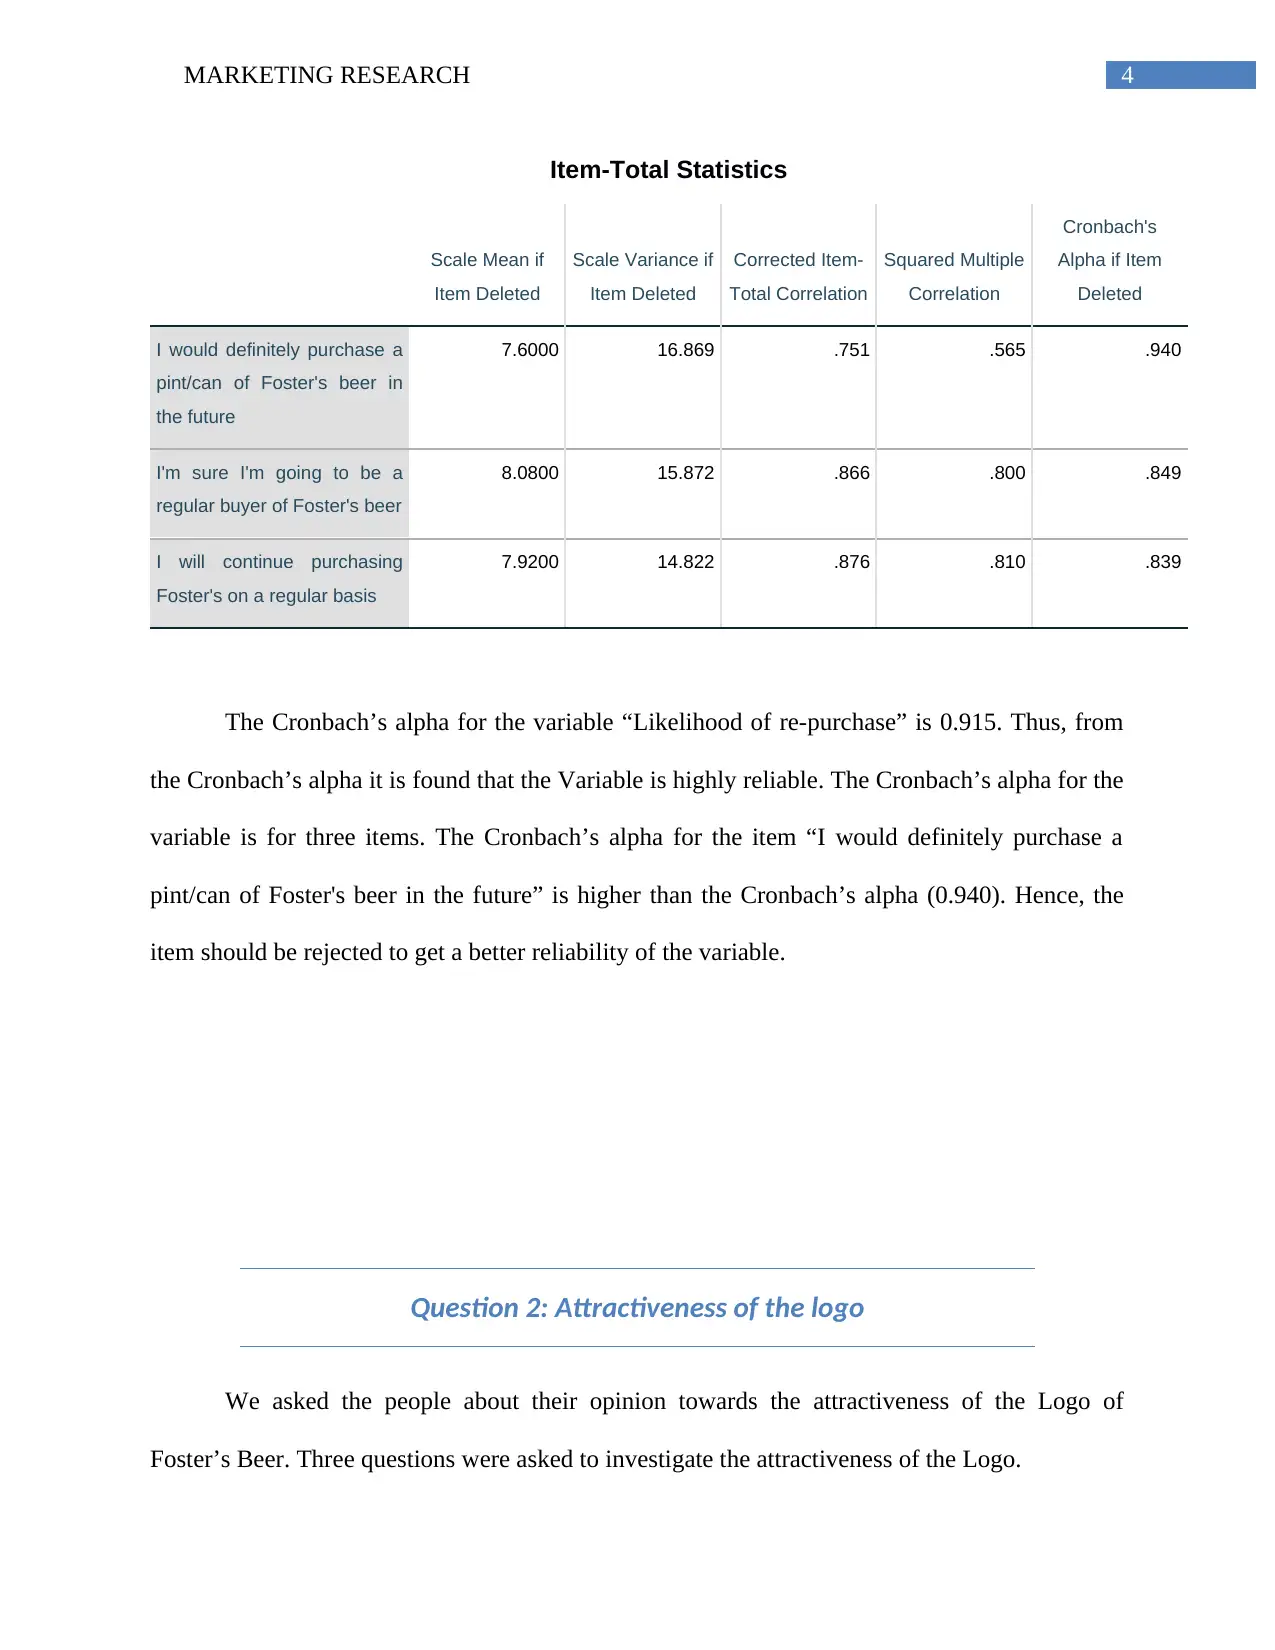
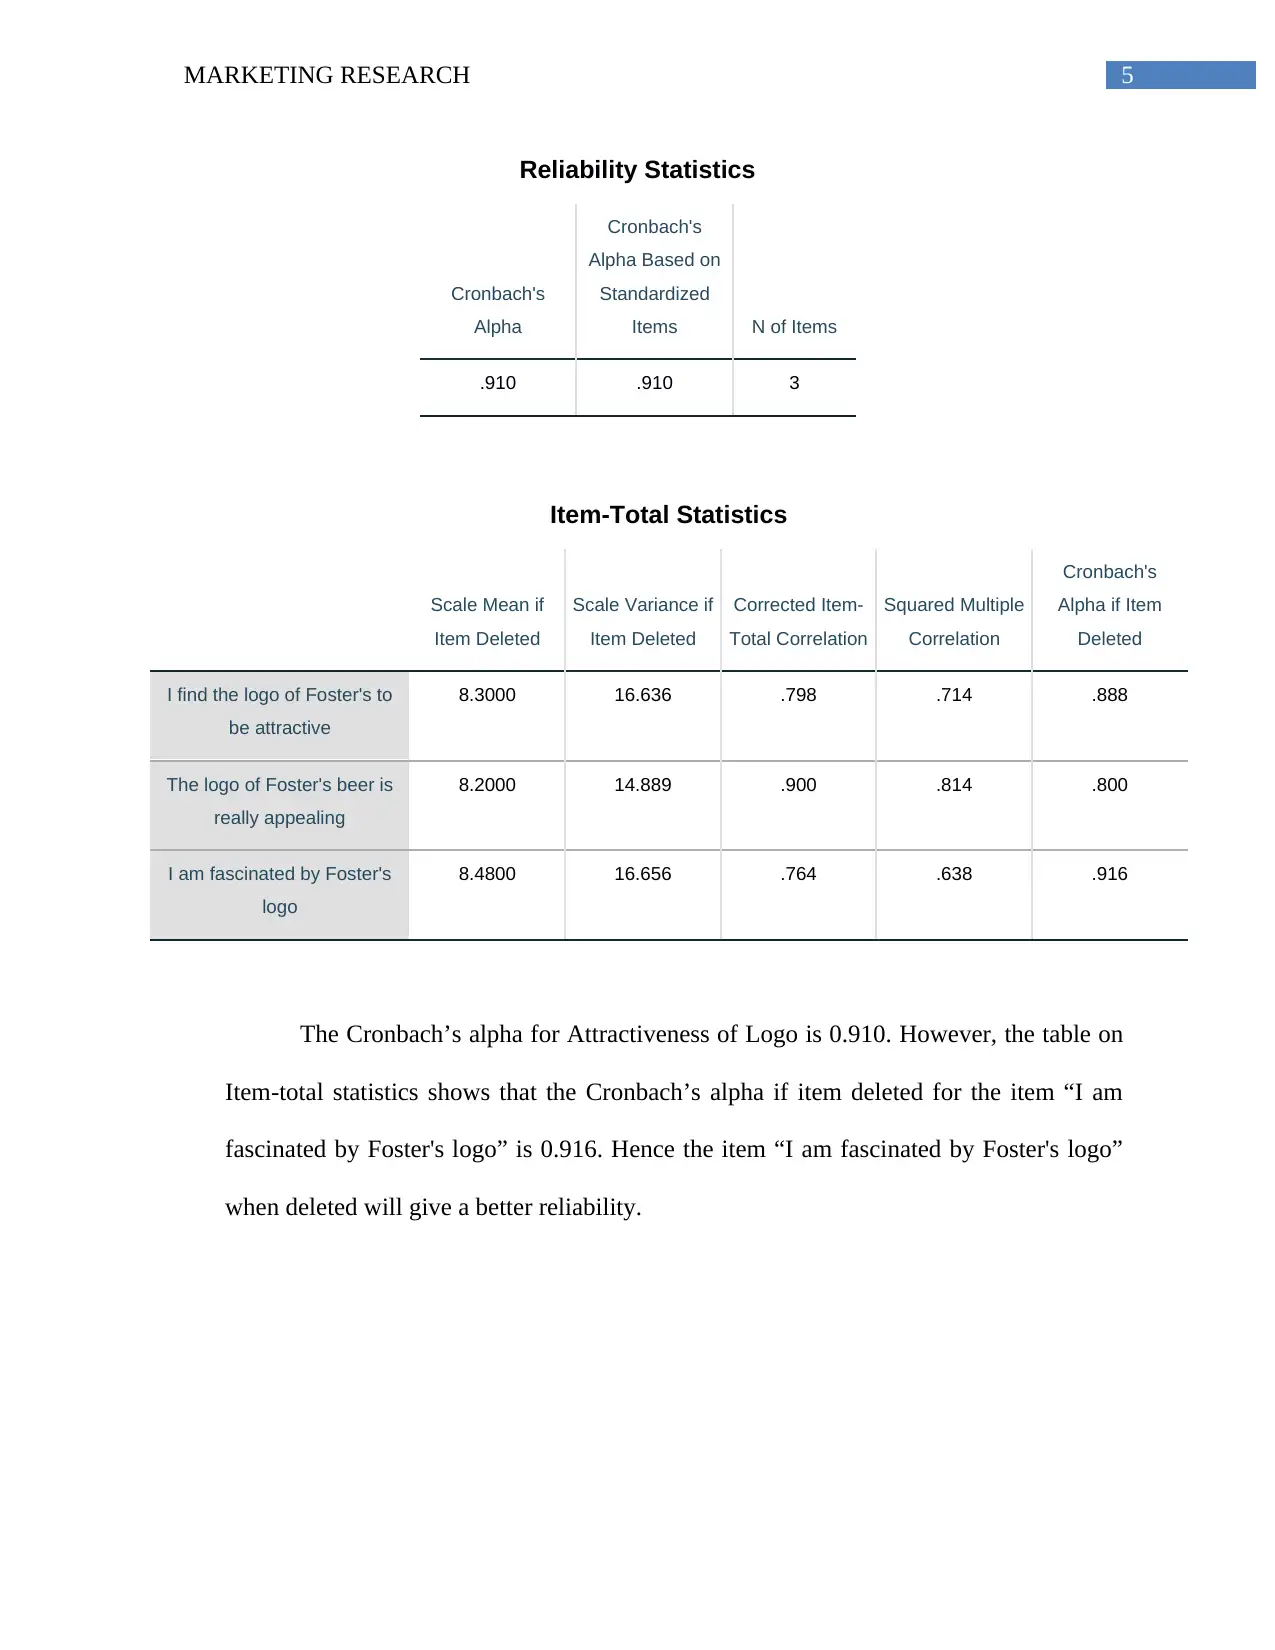
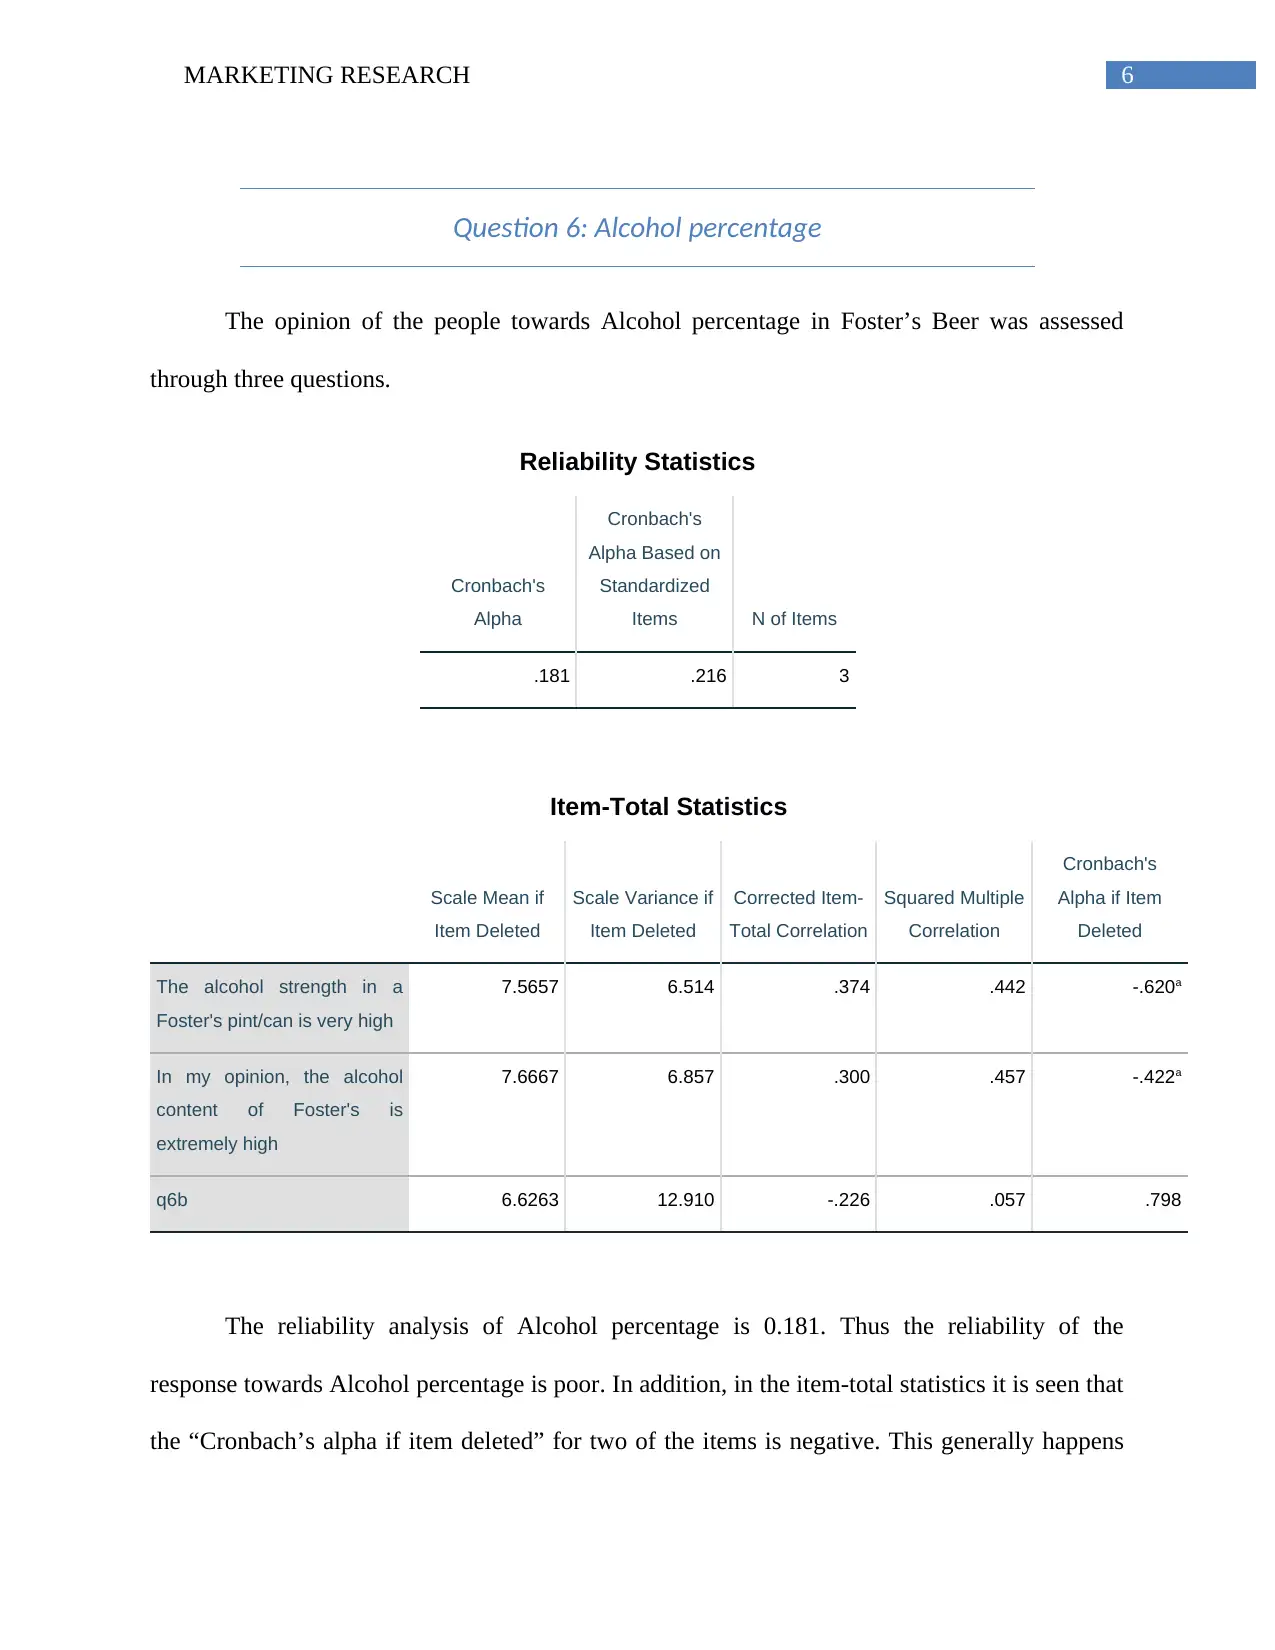
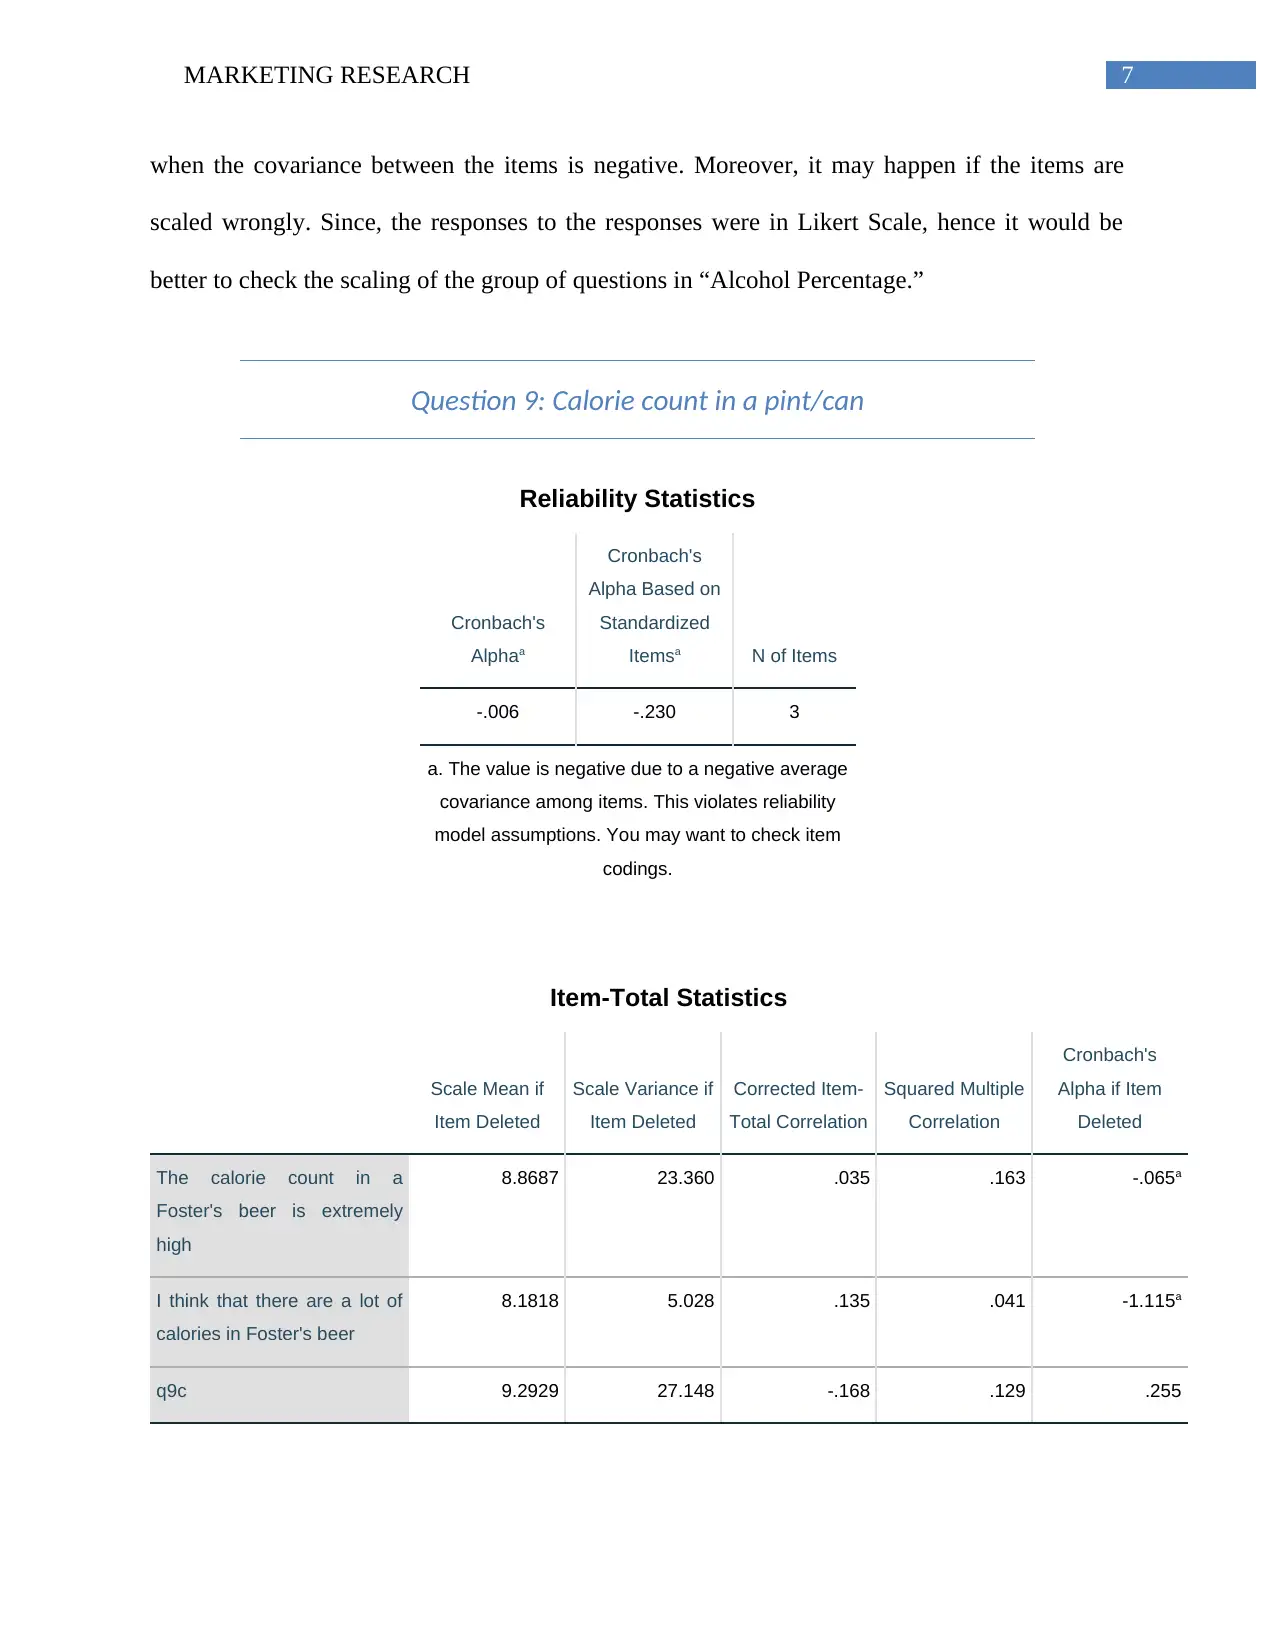
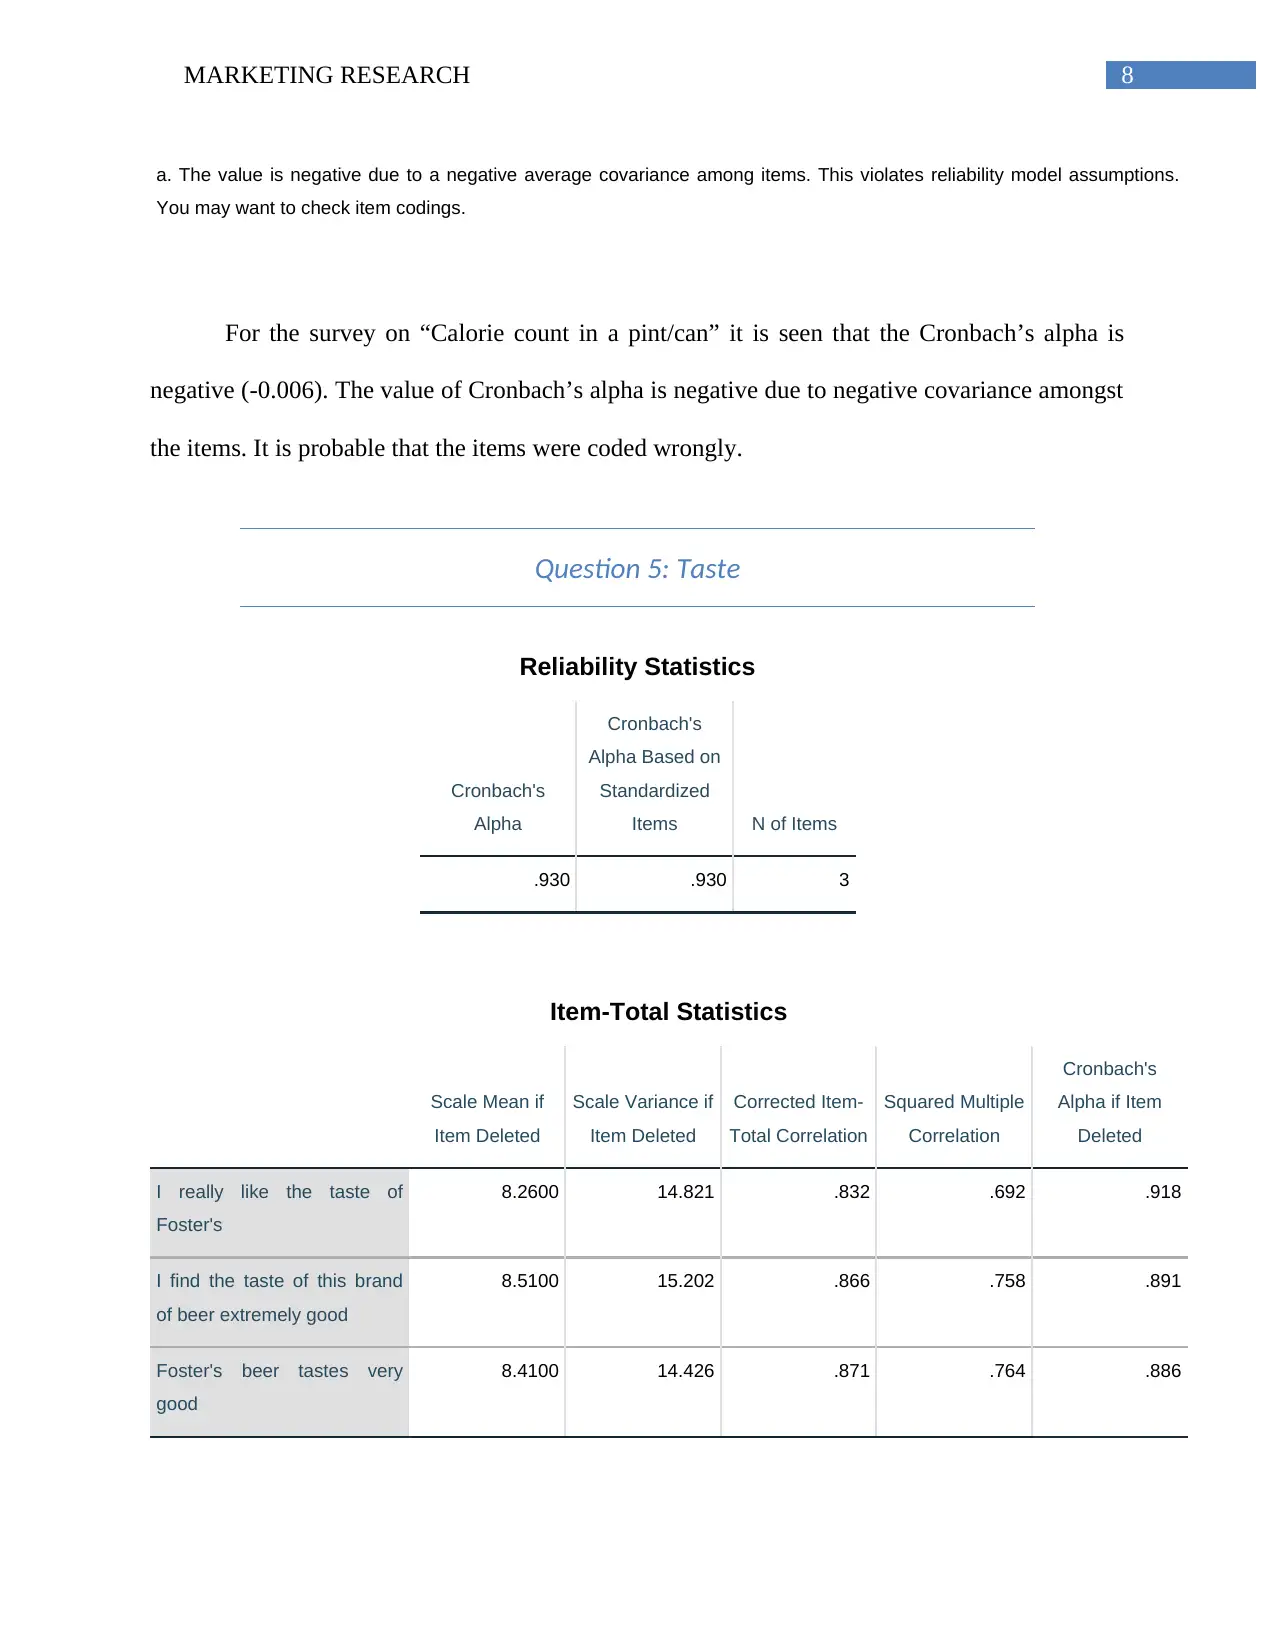
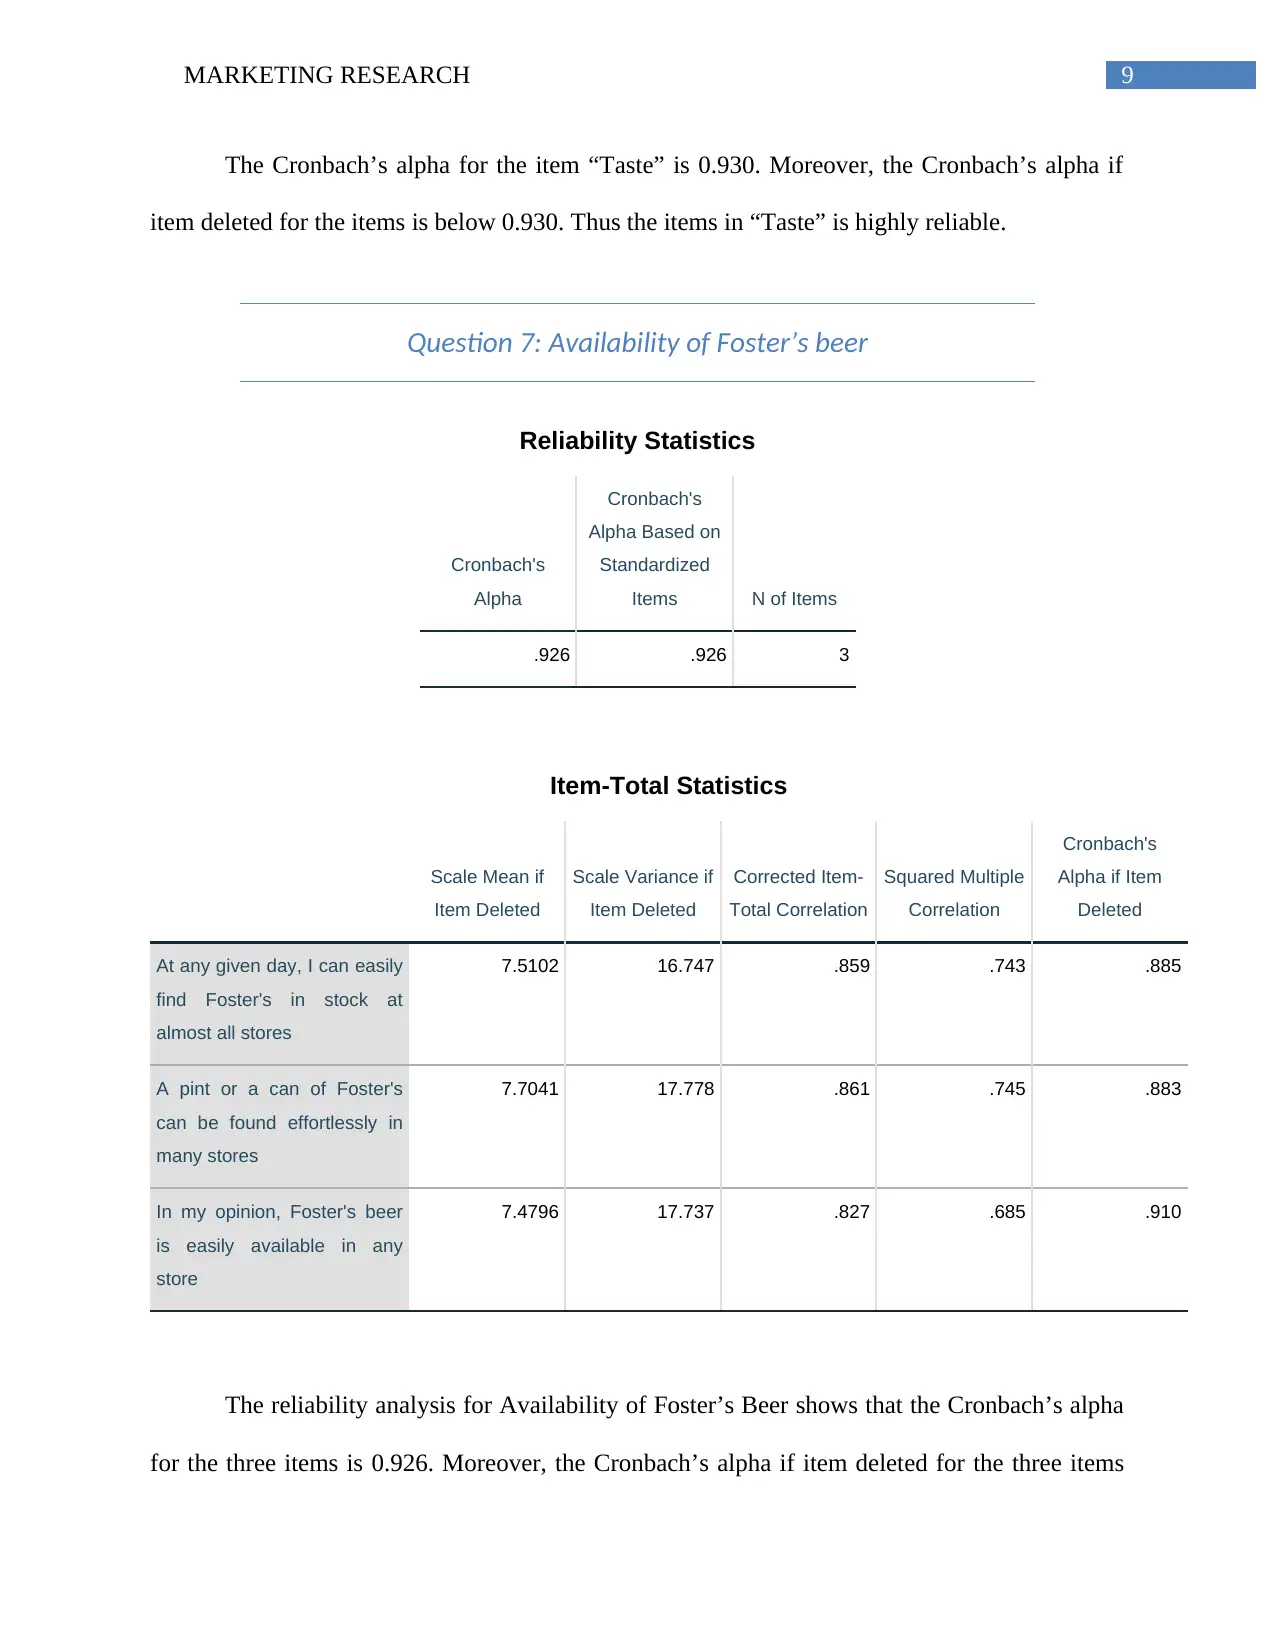
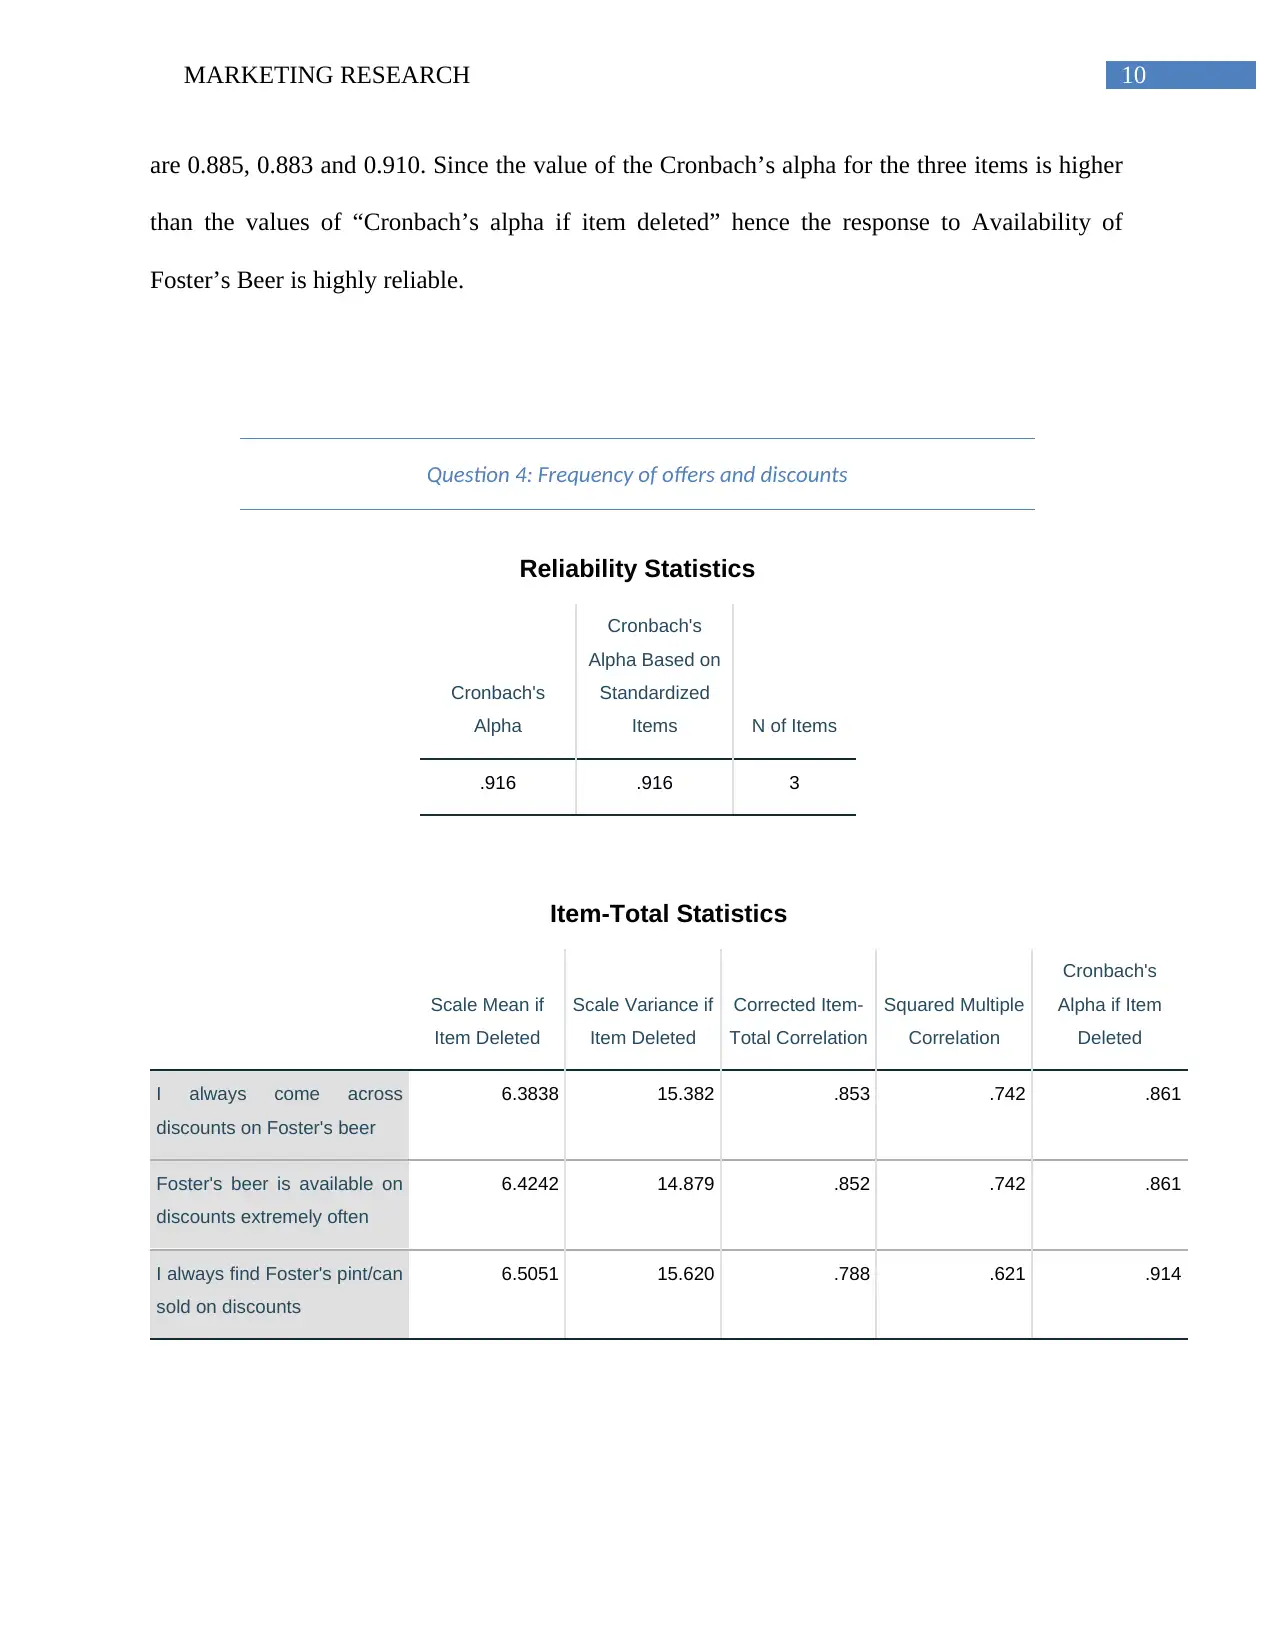
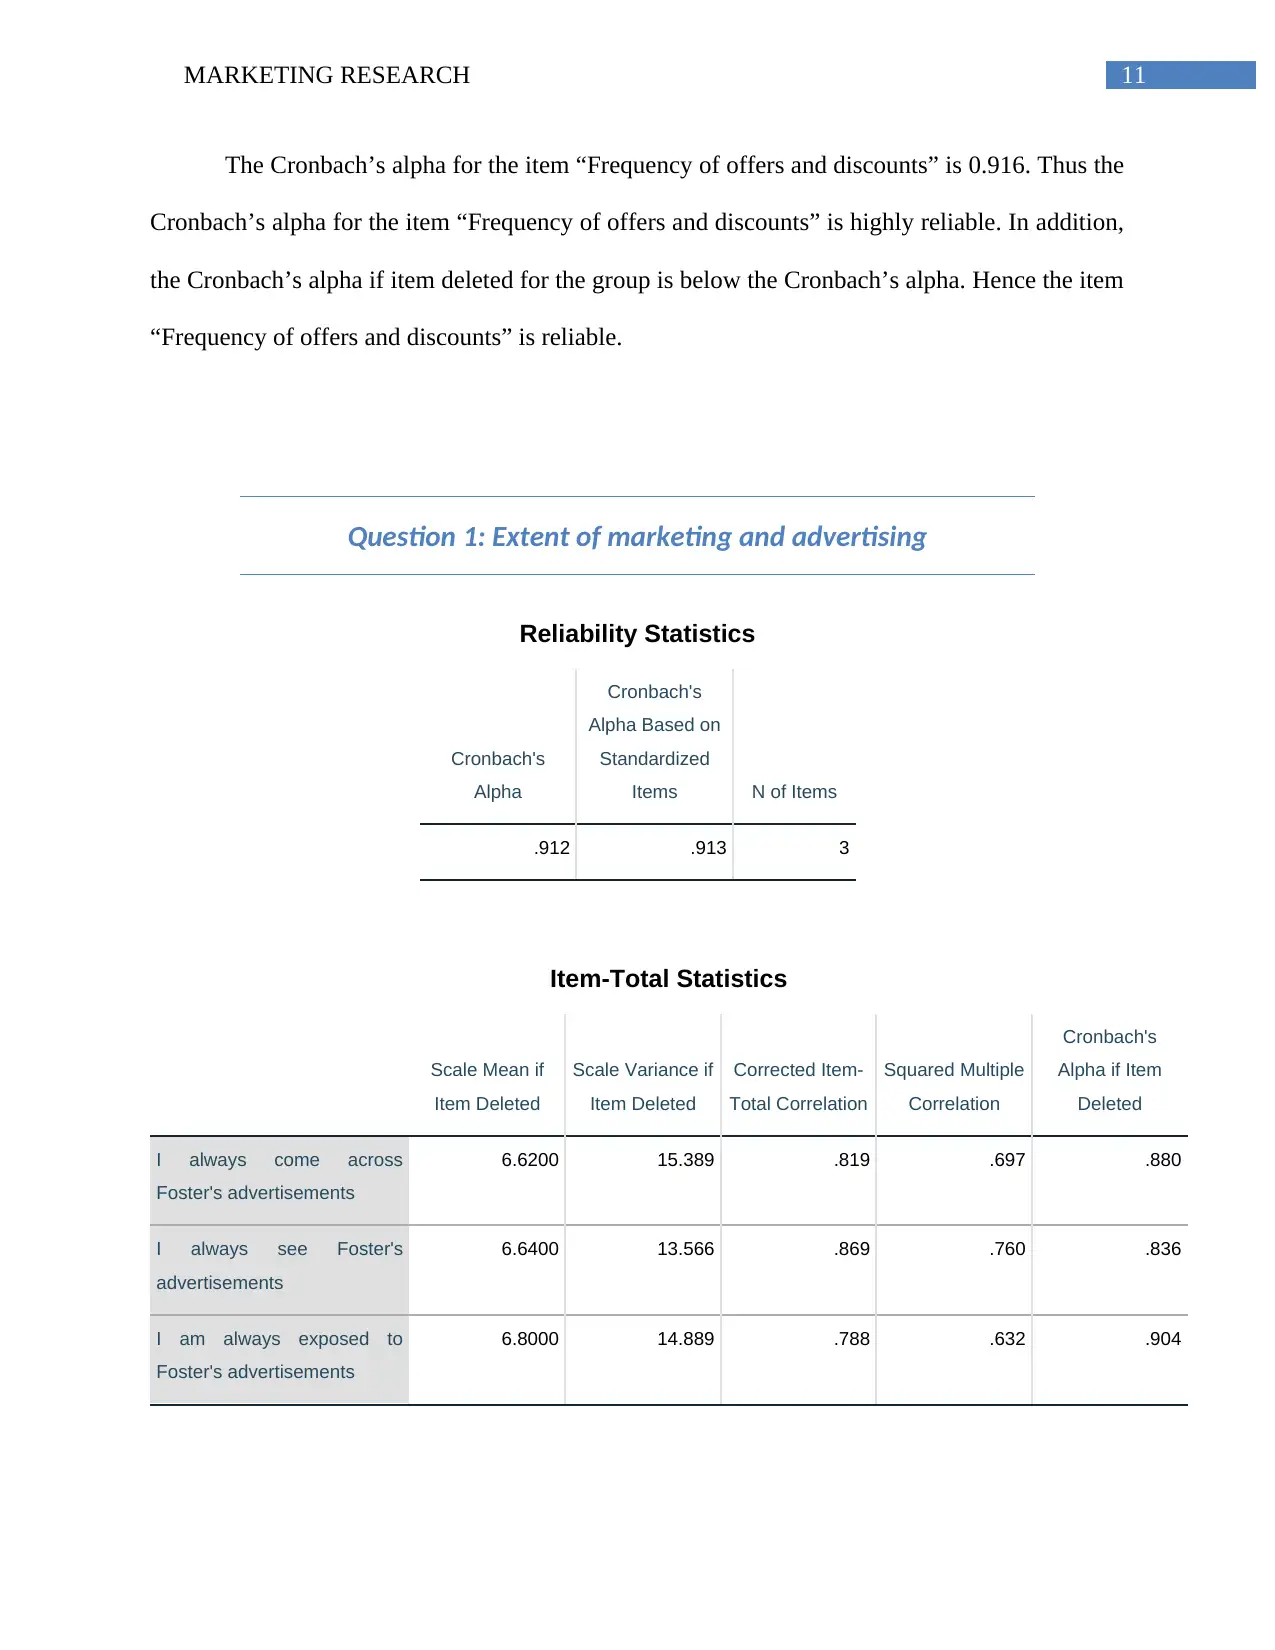
This report presents a marketing research analysis focusing on consumer perceptions of Foster's beer. The research employs survey data to assess various aspects, including celebrity endorsements, repurchase likelihood, logo attractiveness, alcohol percentage, calorie count, taste, availability, offe...
Read More
Contribute Materials
Your contribution can guide someone’s learning journey. Share your
documents today.

Running head: MARKETING RESEARCH
Marketing Research
Name of Student:
Name of University:
Author’s Note:
Marketing Research
Name of Student:
Name of University:
Author’s Note:
Secure Best Marks with AI Grader
Need help grading? Try our AI Grader for instant feedback on your assignments.

1MARKETING RESEARCH
Table of Contents
Reliability analysis...........................................................................................................................2
Correlation Analysis......................................................................................................................15
Regression Analysis.......................................................................................................................19
Summary........................................................................................................................................24

2MARKETING RESEARCH
Reliability analysis
In social research survey’s are conducted to get responses from prospective clients. The
responses of the clients are analysed and interpreted. In reliability analysis studies are done to
check how well a group of items are correlated with other. The study of the inter-relation
between different items in a group is a measure of reliability. The Cronbach’s alpha test is done
to measure reliability. In the test for Reliability, the results are checked for Cronbach’s alpha and
Cronbach’s alpha if item deleted. The Cronbach’s alpha provides a measure of the reliability of
the items. The Cronbach’s alpha if item deleted provides the Cronbach’s alpha if the specific
item is deleted. In the condition that any of the values of Cronbach’s alpha if item deleted is
higher than Cronbach’s alpha then it is deduced that the reliability of the item is poor as
compared to other items in the group. Thus the item should be deleted and a better Cronbach’s
alpha generated.
In the present research a survey was done to get the opinion of the people for Foster’s
Beer.
Question 10: Extent of use of celebrity endorsement
Reliability Statistics
Cronbach's
Alpha
Cronbach's
Alpha Based on
Standardized
Items N of Items
.936 .937 3

3MARKETING RESEARCH
Item-Total Statistics
Scale Mean if
Item Deleted
Scale Variance if
Item Deleted
Corrected Item-
Total Correlation
Squared Multiple
Correlation
Cronbach's
Alpha if Item
Deleted
I have seen many celebrity
endorsements for Foster's
beer
6.1200 14.410 .823 .728 .944
A lot of celebrities have
endorsed Foster's beer
6.2100 14.228 .934 .876 .858
Many ad campaigns of
Foster's involve renowned
celebrities
6.2100 14.329 .853 .801 .920
The Cronbach’s alpha for the variable “Extent of use of celebrity endorsement” is 0.936.
Hence, from the Cronbach’s alpha it is found that the Variable is highly reliable. The Cronbach’s
alpha for the variable is for three items. The Cronbach’s alpha for the item “I have seen many
celebrity endorsements for Foster's beer” is higher than the Cronbach’s alpha (0.944). Hence, the
item should be rejected to get a better reliability of the variable.
Question 11: Likelihood of re-purchase
Reliability Statistics
Cronbach's
Alpha
Cronbach's
Alpha Based on
Standardized
Items N of Items
.915 .915 3
Secure Best Marks with AI Grader
Need help grading? Try our AI Grader for instant feedback on your assignments.

4MARKETING RESEARCH
Item-Total Statistics
Scale Mean if
Item Deleted
Scale Variance if
Item Deleted
Corrected Item-
Total Correlation
Squared Multiple
Correlation
Cronbach's
Alpha if Item
Deleted
I would definitely purchase a
pint/can of Foster's beer in
the future
7.6000 16.869 .751 .565 .940
I'm sure I'm going to be a
regular buyer of Foster's beer
8.0800 15.872 .866 .800 .849
I will continue purchasing
Foster's on a regular basis
7.9200 14.822 .876 .810 .839
The Cronbach’s alpha for the variable “Likelihood of re-purchase” is 0.915. Thus, from
the Cronbach’s alpha it is found that the Variable is highly reliable. The Cronbach’s alpha for the
variable is for three items. The Cronbach’s alpha for the item “I would definitely purchase a
pint/can of Foster's beer in the future” is higher than the Cronbach’s alpha (0.940). Hence, the
item should be rejected to get a better reliability of the variable.
Question 2: Attractiveness of the logo
We asked the people about their opinion towards the attractiveness of the Logo of
Foster’s Beer. Three questions were asked to investigate the attractiveness of the Logo.

5MARKETING RESEARCH
Reliability Statistics
Cronbach's
Alpha
Cronbach's
Alpha Based on
Standardized
Items N of Items
.910 .910 3
Item-Total Statistics
Scale Mean if
Item Deleted
Scale Variance if
Item Deleted
Corrected Item-
Total Correlation
Squared Multiple
Correlation
Cronbach's
Alpha if Item
Deleted
I find the logo of Foster's to
be attractive
8.3000 16.636 .798 .714 .888
The logo of Foster's beer is
really appealing
8.2000 14.889 .900 .814 .800
I am fascinated by Foster's
logo
8.4800 16.656 .764 .638 .916
The Cronbach’s alpha for Attractiveness of Logo is 0.910. However, the table on
Item-total statistics shows that the Cronbach’s alpha if item deleted for the item “I am
fascinated by Foster's logo” is 0.916. Hence the item “I am fascinated by Foster's logo”
when deleted will give a better reliability.

6MARKETING RESEARCH
Question 6: Alcohol percentage
The opinion of the people towards Alcohol percentage in Foster’s Beer was assessed
through three questions.
Reliability Statistics
Cronbach's
Alpha
Cronbach's
Alpha Based on
Standardized
Items N of Items
.181 .216 3
Item-Total Statistics
Scale Mean if
Item Deleted
Scale Variance if
Item Deleted
Corrected Item-
Total Correlation
Squared Multiple
Correlation
Cronbach's
Alpha if Item
Deleted
The alcohol strength in a
Foster's pint/can is very high
7.5657 6.514 .374 .442 -.620a
In my opinion, the alcohol
content of Foster's is
extremely high
7.6667 6.857 .300 .457 -.422a
q6b 6.6263 12.910 -.226 .057 .798
The reliability analysis of Alcohol percentage is 0.181. Thus the reliability of the
response towards Alcohol percentage is poor. In addition, in the item-total statistics it is seen that
the “Cronbach’s alpha if item deleted” for two of the items is negative. This generally happens
Paraphrase This Document
Need a fresh take? Get an instant paraphrase of this document with our AI Paraphraser

7MARKETING RESEARCH
when the covariance between the items is negative. Moreover, it may happen if the items are
scaled wrongly. Since, the responses to the responses were in Likert Scale, hence it would be
better to check the scaling of the group of questions in “Alcohol Percentage.”
Question 9: Calorie count in a pint/can
Reliability Statistics
Cronbach's
Alphaa
Cronbach's
Alpha Based on
Standardized
Itemsa N of Items
-.006 -.230 3
a. The value is negative due to a negative average
covariance among items. This violates reliability
model assumptions. You may want to check item
codings.
Item-Total Statistics
Scale Mean if
Item Deleted
Scale Variance if
Item Deleted
Corrected Item-
Total Correlation
Squared Multiple
Correlation
Cronbach's
Alpha if Item
Deleted
The calorie count in a
Foster's beer is extremely
high
8.8687 23.360 .035 .163 -.065a
I think that there are a lot of
calories in Foster's beer
8.1818 5.028 .135 .041 -1.115a
q9c 9.2929 27.148 -.168 .129 .255

8MARKETING RESEARCH
a. The value is negative due to a negative average covariance among items. This violates reliability model assumptions.
You may want to check item codings.
For the survey on “Calorie count in a pint/can” it is seen that the Cronbach’s alpha is
negative (-0.006). The value of Cronbach’s alpha is negative due to negative covariance amongst
the items. It is probable that the items were coded wrongly.
Question 5: Taste
Reliability Statistics
Cronbach's
Alpha
Cronbach's
Alpha Based on
Standardized
Items N of Items
.930 .930 3
Item-Total Statistics
Scale Mean if
Item Deleted
Scale Variance if
Item Deleted
Corrected Item-
Total Correlation
Squared Multiple
Correlation
Cronbach's
Alpha if Item
Deleted
I really like the taste of
Foster's
8.2600 14.821 .832 .692 .918
I find the taste of this brand
of beer extremely good
8.5100 15.202 .866 .758 .891
Foster's beer tastes very
good
8.4100 14.426 .871 .764 .886

9MARKETING RESEARCH
The Cronbach’s alpha for the item “Taste” is 0.930. Moreover, the Cronbach’s alpha if
item deleted for the items is below 0.930. Thus the items in “Taste” is highly reliable.
Question 7: Availability of Foster’s beer
Reliability Statistics
Cronbach's
Alpha
Cronbach's
Alpha Based on
Standardized
Items N of Items
.926 .926 3
Item-Total Statistics
Scale Mean if
Item Deleted
Scale Variance if
Item Deleted
Corrected Item-
Total Correlation
Squared Multiple
Correlation
Cronbach's
Alpha if Item
Deleted
At any given day, I can easily
find Foster's in stock at
almost all stores
7.5102 16.747 .859 .743 .885
A pint or a can of Foster's
can be found effortlessly in
many stores
7.7041 17.778 .861 .745 .883
In my opinion, Foster's beer
is easily available in any
store
7.4796 17.737 .827 .685 .910
The reliability analysis for Availability of Foster’s Beer shows that the Cronbach’s alpha
for the three items is 0.926. Moreover, the Cronbach’s alpha if item deleted for the three items
Secure Best Marks with AI Grader
Need help grading? Try our AI Grader for instant feedback on your assignments.

10MARKETING RESEARCH
are 0.885, 0.883 and 0.910. Since the value of the Cronbach’s alpha for the three items is higher
than the values of “Cronbach’s alpha if item deleted” hence the response to Availability of
Foster’s Beer is highly reliable.
Question 4: Frequency of offers and discounts
Reliability Statistics
Cronbach's
Alpha
Cronbach's
Alpha Based on
Standardized
Items N of Items
.916 .916 3
Item-Total Statistics
Scale Mean if
Item Deleted
Scale Variance if
Item Deleted
Corrected Item-
Total Correlation
Squared Multiple
Correlation
Cronbach's
Alpha if Item
Deleted
I always come across
discounts on Foster's beer
6.3838 15.382 .853 .742 .861
Foster's beer is available on
discounts extremely often
6.4242 14.879 .852 .742 .861
I always find Foster's pint/can
sold on discounts
6.5051 15.620 .788 .621 .914

11MARKETING RESEARCH
The Cronbach’s alpha for the item “Frequency of offers and discounts” is 0.916. Thus the
Cronbach’s alpha for the item “Frequency of offers and discounts” is highly reliable. In addition,
the Cronbach’s alpha if item deleted for the group is below the Cronbach’s alpha. Hence the item
“Frequency of offers and discounts” is reliable.
Question 1: Extent of marketing and advertising
Reliability Statistics
Cronbach's
Alpha
Cronbach's
Alpha Based on
Standardized
Items N of Items
.912 .913 3
Item-Total Statistics
Scale Mean if
Item Deleted
Scale Variance if
Item Deleted
Corrected Item-
Total Correlation
Squared Multiple
Correlation
Cronbach's
Alpha if Item
Deleted
I always come across
Foster's advertisements
6.6200 15.389 .819 .697 .880
I always see Foster's
advertisements
6.6400 13.566 .869 .760 .836
I am always exposed to
Foster's advertisements
6.8000 14.889 .788 .632 .904

12MARKETING RESEARCH
For the item “Extent of marketing and advertising” it is seen that the Cronbach’s alpha is
0.915. Hence, it is seen that the Cronbach’s alpha for the item “Extent of marketing and
advertising” are highly reliable. Moreover, Cronbach's Alpha if Item Deleted for the items in the
group is below the Cronbach’s alpha for the group. Hence the items in the group are highly
reliable.
Question 3: Pricing
Reliability Statistics
Cronbach's
Alpha
Cronbach's
Alpha Based on
Standardized
Items N of Items
.898 .899 3
Item-Total Statistics
Scale Mean if
Item Deleted
Scale Variance if
Item Deleted
Corrected Item-
Total Correlation
Squared Multiple
Correlation
Cronbach's
Alpha if Item
Deleted
In my opinion, Foster's is
expensive
7.5833 14.267 .841 .708 .818
A pint/can of Foster's beer is
very expensive for me
7.9167 14.456 .782 .626 .871
The cost of a pint/can of
Foster's beer is too high
7.7917 15.198 .776 .616 .874
Paraphrase This Document
Need a fresh take? Get an instant paraphrase of this document with our AI Paraphraser

13MARKETING RESEARCH
For the item “Pricing” it is seen that the Cronbach’s alpha is 0.898. Hence, it is seen that
the Cronbach’s alpha for the item “Pricing” are highly reliable. Moreover, Cronbach's Alpha if
Item Deleted for the items in the group is below the Cronbach’s alpha for the group “Pricing”.
Hence the items in the group are highly reliable.
Question 12: Satisfaction
Reliability Statistics
Cronbach's
Alpha
Cronbach's
Alpha Based on
Standardized
Items N of Items
.887 .887 3
Item-Total Statistics
Scale Mean if
Item Deleted
Scale Variance if
Item Deleted
Corrected Item-
Total Correlation
Squared Multiple
Correlation
Cronbach's
Alpha if Item
Deleted
Foster's beer is one of best
beers I've ever had
7.4900 14.798 .801 .643 .820
I have truly enjoyed Foster's
beer
7.1900 14.943 .778 .611 .840
Foster's beer is exactly what I
need
7.5800 14.933 .759 .578 .857

14MARKETING RESEARCH
The variable “Satisfaction” has a Cronbach’s alpha is 0.887. Moreover, the Cronbach's
Alpha if Item Deleted for the items in the group is below the Cronbach’s alpha for the group
“Satisfaction”. Hence the items in the group are highly reliable.
Question 8: Variety of beer
Reliability Statistics
Cronbach's
Alpha
Cronbach's
Alpha Based on
Standardized
Items N of Items
.881 .882 3
Item-Total Statistics
Scale Mean if
Item Deleted
Scale Variance if
Item Deleted
Corrected Item-
Total Correlation
Squared Multiple
Correlation
Cronbach's
Alpha if Item
Deleted
I see very few types of beer
under the Foster's brand
8.4200 13.499 .719 .521 .878
The range of beer provided
by Foster's is not diverse
8.4400 13.219 .814 .675 .791
Foster's has a limited range
of beer types
8.2600 13.851 .778 .636 .824

15MARKETING RESEARCH
For the item “Variety of Beer” the Cronbach’s alpha is 0.881. Thus, the Cronbach’s alpha
for the item “Variety of Beer” is highly reliable. Moreover, Cronbach's Alpha if Item Deleted for
the three items in the group is below the Cronbach’s alpha for the group “Variety of Beer”.
Hence the items in the group are highly reliable.
Summary
The reliability of the 12 group of variables shows that one of the items should be deleted
in the variables "Extent of use of celebrity endorsement", "Likelihood of re-purchase" and
"Attractiveness of logo." Deleting of one of the items in the variable would increase the
reliability of the variables. Moreover, for the variable "Alcohol percentage" two of the items
have a negative covariance. The items have a negative covariance due to negative average
covariance amongst the items. This generally happens due to incorrect coding of the items. In
addition, for the variable "Calorie count in a pint/can" the Cronbach's alpha is negative. The
negative Cronbach's alpha is due to incorrect coding of the variables. The three items in "Calorie
count in a pint/can" and "Alcohol percentage" needs to be coded correctly. The rest of the
variables are highly reliable.
Secure Best Marks with AI Grader
Need help grading? Try our AI Grader for instant feedback on your assignments.

16MARKETING RESEARCH
Correlation Analysis
The test for association between two variables is tested through Karl Pearson Correlation coefficient
(r). The correlation coefficient is used to detect the strength as well as the direction of the
relationship. A positive correlation is reflected by a positive sign (+) and a negative correlation is
identified by a negative sign (-). The strength of the correlation depends its distance between 0 and 1.
When a number is closer to 1 then it has a high correlation. When the correlation coefficient, r = 0,
then there is no correlation.
Descriptive Statistics
Mean Std. Deviation N
Extent of Marketing and advertising 3.3433 1.87095 100
Attractiveness of logo 4.1633 1.96004 100
Pricing 3.8819 1.86628 96
Frequency of offers and discounts 3.2189 1.91554 99
Taste 4.1967 1.89162 100
Alcohol Percentage 3.3131 1.79652 99
Availability of Foster’s beer 3.7823 2.04928 98
Variety of Beer 4.1867 1.78617 100
Extent of use of celebrity endorsements 3.0900 1.86278 100
Likelihood of repurchase 3.9333 1.94999 100

17MARKETING RESEARCH
Satisfaction 3.7100 1.87706 100
The correlation coefficient, of 11 variables was calculated. The mean (standard deviation)
of the variable “Taste” is the highest, 4.1967 (1.89162), followed by “Variety of Beer” 4.1867
(1.78617). The mean±sd “attractiveness of logo” was found to be 4.1633 ±1.96004. The
mean±sd “Likelihood of repurchase” is 3.93330±1.94999. The mean±sd “Pricing” is
3.88190±1.86628. The mean±sd for “Availability of Foster’s beer” was found as
3.78230±2.04928. The mean±sd for “Satisfaction” was 3.71000±1.87706. The mean±sd for
“Extent of Marketing and advertising” was found to be 3.34330±1.87095. The mean±sd for
“Alcohol Percentage” was 3.31310±1.79652. The mean±sd for “Frequency of offers and
discounts” was 3.21890± 1.91554. Finally, the mean±sd for “Extent of use of celebrity
endorsements” was found to be 3.09000±1.86278.
Thus it is seen that the mean for the variable “Taste” is the highest and for “Extent of use
of celebrity endorsements” is the least. Hence, it can be interpreted that most of the client’s of
Foster Beer strongly agreed with the three items for Taste. The descriptive statistics for the
variables shows that when the mean is above 4 then most of the clients strongly agreed with
items in the variable. Similarly, when the mean has a value from 3.5 to 4 then most of the client
agreed with the items of the variable. Likewise, when the mean has a value around 3.0 them the
clients were neutral towards the items of the variables. Hence, for “Extent of use of celebrity
endorsements” it can be said that most of the clients of Foster Beer were neutral in their
responses towards the three items.
Correlations

18MARKETING RESEARCH
Likelihood of
Repurchase
Customer
Satisfaction
Extent_Of_Marketing Pearson Correlation .272** .410**
Sig. (2-tailed) 0.006 0.000
N 100 100
Logo_Attractiveness Pearson Correlation 0.051 .294**
Sig. (2-tailed) 0.616 0.003
N 100 100
Pricing Pearson Correlation 0.071 .228*
Sig. (2-tailed) 0.490 0.025
N 96 96
Freq_of_Discounts Pearson Correlation 0.155 .272**
Sig. (2-tailed) 0.126 0.006
N 99 99
Taste Pearson Correlation .368** .506**
Sig. (2-tailed) 0.000 0.000
N 100 100
Alcohol_Percentage Pearson Correlation 0.083 .218*
Sig. (2-tailed) 0.414 0.030
N 99 99
Availability_in_stores Pearson Correlation 0.135 0.032
Sig. (2-tailed) 0.184 0.752
N 98 98
Variety_of_Beer Pearson Correlation .218* 0.178
Sig. (2-tailed) 0.030 0.076
Paraphrase This Document
Need a fresh take? Get an instant paraphrase of this document with our AI Paraphraser

19MARKETING RESEARCH
N 100 100
Extent_of_Celebrity_Endorsements Pearson Correlation 0.127 .346**
Sig. (2-tailed) 0.206 0.000
N 100 100
Intention_For_Repurchase Pearson Correlation 1 .530**
Sig. (2-tailed) 0.000
N 100 100
Customer_Satisfaction Pearson Correlation .530** 1
Sig. (2-tailed) 0.000
N 100 100
**. Correlation is significant at the 0.01 level (2-tailed).
*. Correlation is significant at the 0.05 level (2-tailed).
The correlation has been computed between 11 Independent Variables and 2 dependent
variables. The two dependent variables are “Likelihood of Repurchase” and “Customer
Satisfaction.” The correlation between the two dependent variables is moderate, positive and
linear, r = 0.530. Moreover, the correlation is statistically significant, p = 0.000 at 0.01 level of
significance. Hence, it can be said that when a customer is satisfied and is likely to repurchase
foster Beer. Similarly, the correlation between Taste and customer satisfaction is also moderate,
positive and linear, r = 0.506. Moreover, the correlation is statistically significant, p = 0.000 at
0.01 level of significance. The least correlation is between “Attractiveness of Logo” and
“Likelihood of Repurchase,” r = 0.051. Moreover, the correlation is statistically not significant.
N 100 100
Extent_of_Celebrity_Endorsements Pearson Correlation 0.127 .346**
Sig. (2-tailed) 0.206 0.000
N 100 100
Intention_For_Repurchase Pearson Correlation 1 .530**
Sig. (2-tailed) 0.000
N 100 100
Customer_Satisfaction Pearson Correlation .530** 1
Sig. (2-tailed) 0.000
N 100 100
**. Correlation is significant at the 0.01 level (2-tailed).
*. Correlation is significant at the 0.05 level (2-tailed).
The correlation has been computed between 11 Independent Variables and 2 dependent
variables. The two dependent variables are “Likelihood of Repurchase” and “Customer
Satisfaction.” The correlation between the two dependent variables is moderate, positive and
linear, r = 0.530. Moreover, the correlation is statistically significant, p = 0.000 at 0.01 level of
significance. Hence, it can be said that when a customer is satisfied and is likely to repurchase
foster Beer. Similarly, the correlation between Taste and customer satisfaction is also moderate,
positive and linear, r = 0.506. Moreover, the correlation is statistically significant, p = 0.000 at
0.01 level of significance. The least correlation is between “Attractiveness of Logo” and
“Likelihood of Repurchase,” r = 0.051. Moreover, the correlation is statistically not significant.

20MARKETING RESEARCH
Regression Analysis
Regression analysis is used to predict the relationship between variables. The dependent
variable is the predictor variable. The independent variables are used to predict the dependent
variables.
1 INTENTION FOR REPURCHASE
Model Summary
Model R R Square
Adjusted R
Square
Std. Error of the
Estimate
1 .480a .231 .154 1.79396
a. Predictors: (Constant), Extent_of_Celebrity_Endorsements,
Availability_in_stores, Logo_Attractiveness, Variety_of_Beer, Pricing,
Taste, Alcohol_Percentage, Extent_Of_Marketing, Freq_of_Discounts
ANOVAa
Model Sum of Squares df Mean Square F Sig.
1 Regression 86.797 9 9.644 2.997 .004b
Residual 289.647 90 3.218
Total 376.444 99
a. Dependent Variable: Intention_For_Repurchase
b. Predictors: (Constant), Extent_of_Celebrity_Endorsements, Availability_in_stores,
Logo_Attractiveness, Variety_of_Beer, Pricing, Taste, Alcohol_Percentage, Extent_Of_Marketing,
Freq_of_Discounts

21MARKETING RESEARCH
Coefficientsa
Model
Unstandardized
Coefficients
Standardized
Coefficients
t Sig.
Collinearity Statistics
B Std. Error Beta Tolerance VIF
1 (Constant) 1.295 .803 1.613 .110
Extent_Of_Marketing .147 .121 .141 1.221 .225 .638 1.566
Logo_Attractiveness -.154 .106 -.155 -1.456 .149 .756 1.323
Pricing -.066 .112 -.061 -.586 .559 .778 1.285
Freq_of_Discounts .031 .126 .031 .249 .804 .564 1.773
Taste .386 .113 .374 3.418 .001 .713 1.403
Alcohol_Percentage -.023 .118 -.021 -.192 .848 .730 1.370
Availability_in_stores .022 .093 .022 .231 .818 .907 1.102
Variety_of_Beer .254 .104 .233 2.454 .016 .950 1.053
Extent_of_Celebrity_En
dorsements
.081 .131 .078 .621 .536 .549 1.823
a. Dependent Variable: Intention_For_Repurchase
In the following regression "intention for repurchase" is the dependent variable. 23.1% of
"intention for repurchase" can be predicted from the variables. The equation for regression can
be given as:
Intention for repurchase = 1.295 + 0.147*Extent_of_Marketing - 0.154*Logo_Attractiveness -
0.066*Pricing + 0.031*Frequency_of_discounts+0.386*Taste - 0.023*Alcohol_Percentage +
0.022* Availability_in_stores + 0.254* Variety_of_Beer + 0.081*
Extent_of_Celebrity_Endorsements
Secure Best Marks with AI Grader
Need help grading? Try our AI Grader for instant feedback on your assignments.

22MARKETING RESEARCH
From the equation it is seen that with increase in “logo attractiveness”, “pricing” and
“alcohol percentage” the “intention for repurchase” decreases. For all other variables the
“intention for repurchase” increases. The coefficient for the variables “taste” and “variety of
beer’ are statistically significant. The rest of the variables are not statistically significant.
2 CUSTOMER SATISFACTION
Model Summary
Model R R Square
Adjusted R
Square
Std. Error of the
Estimate
1 .649a .422 .364 1.49702
a. Predictors: (Constant), Extent_of_Celebrity_Endorsements,
Availability_in_stores, Logo_Attractiveness, Variety_of_Beer, Pricing,
Taste, Alcohol_Percentage, Extent_Of_Marketing, Freq_of_Discounts
ANOVAa
Model Sum of Squares df Mean Square F Sig.
1 Regression 147.117 9 16.346 7.294 .000b
Residual 201.696 90 2.241
Total 348.812 99

23MARKETING RESEARCH
a. Dependent Variable: Customer_Satisfaction
b. Predictors: (Constant), Extent_of_Celebrity_Endorsements, Availability_in_stores,
Logo_Attractiveness, Variety_of_Beer, Pricing, Taste, Alcohol_Percentage, Extent_Of_Marketing,
Freq_of_Discounts
Coefficientsa
Model
Unstandardized
Coefficients
Standardized
Coefficients
t Sig.
Collinearity
Statistics
B Std. Error Beta Tolerance VIF
1 (Constant) -.367 .670 -.548 .585
Extent_Of_Marketing .133 .101 .133 1.326 .188 .638 1.566
Logo_Attractiveness .084 .088 .088 .956 .341 .756 1.323
Pricing .004 .093 .004 .045 .964 .778 1.285
Freq_of_Discounts .031 .105 .031 .294 .769 .564 1.773
Taste .395 .094 .398 4.194 .000 .713 1.403
Alcohol_Percentage .052 .099 .049 .527 .599 .730 1.370
Availability_in_stores -.119 .078 -.128 -1.526 .131 .907 1.102
Variety_of_Beer .251 .086 .239 2.900 .005 .950 1.053
Extent_of_Celebrity_Endorsement
s
.237 .109 .235 2.175 .032 .549 1.823
a. Dependent Variable: Customer_Satisfaction

24MARKETING RESEARCH
In the following regression "customer satisfaction" is the dependent variable. 42.2% of
"customer satisfaction" can be predicted from the variables. The equation for regression can be
given as:
Customer Satisfaction = 0.133*Extent_of_Marketing + 0.084*Logo_Attractiveness +
0.004*Pricing + 0.031*Frequency_of_discounts + 0.395*Taste + 0.052*Alcohol_Percentage -
0.119* Availability_in_stores + 0.251* Variety_of_Beer + 0.237*
Extent_of_Celebrity_Endorsements – 0.367
From the equation it is seen that with increase in “availability in stores” the “customer
satisfaction” decreases. For all other variables “customer satisfaction” increases. The coefficient
for the variables “taste”, “variety of beer” and “Extent of celebrity endorsement” are statistically
significant. The rest of the variables are not statistically significant.
Summary
From the above data analysis we can conclude that:
1) One item each of the variables “Extent of use of celebrity endorsement”, “Likelihood of
re-purchase” and “Likelihood of re-purchase” to get a better reliability.
2) The items in “Alcohol percentage” and “Calorie count in a pint/can” should be recoded
and analysis for reliability.
3) The variables “Taste”, “Availability of Foster’s beer”, “Frequency of offers and
discounts”, “Extent of marketing and advertising”, “Pricing”, “Satisfaction” and “Variety
of beer” are highly reliable.
Paraphrase This Document
Need a fresh take? Get an instant paraphrase of this document with our AI Paraphraser

25MARKETING RESEARCH
4) The mean response to “Taste” of Foster Beer is the highest.
5) The mean response to “Extent of use of celebrity endorsements” is the least.
6) The correlation coefficient between “Satisfaction” and “Intention for repurchase” is
moderate and statistically significant.
7) The correlation coefficient between “Logo Attractiveness” and “Likelihood of
repurchase” is very poor.
8) The independent variables can predict 23.1% of the variation in Intention for repurchase.
9) The independent variables can predict 42.2% of the variation in Customer Satisfaction.
1 out of 26
Related Documents

Your All-in-One AI-Powered Toolkit for Academic Success.
+13062052269
info@desklib.com
Available 24*7 on WhatsApp / Email
Unlock your academic potential
© 2024 | Zucol Services PVT LTD | All rights reserved.