University Economics Report: Contemporary Business Economics Analysis
VerifiedAdded on 2023/01/11
|15
|3287
|94
Report
AI Summary
This report provides a comprehensive analysis of contemporary business economics. It begins by exploring the fundamental concepts of demand and supply, detailing the law of demand, its movements, and shifts in the demand curve, along with the law of supply, movements along the supply curve, and factors causing changes. The report then delves into macroeconomic theories, critically evaluating key issues such as inflation, economic growth, and unemployment. It compares and contrasts emerging economic theories of the 21st century, including Keynesian and Friedmanite economics, highlighting their strengths, weaknesses, and practical applications. The analysis includes examples relevant to the fast-food industry, such as KFC, to illustrate real-world implications of these economic principles. The report concludes with a synthesis of the key findings and insights into the complex interplay of market forces and macroeconomic factors in shaping business environments.
Contemporary
Business Economics
Business Economics
Paraphrase This Document
Need a fresh take? Get an instant paraphrase of this document with our AI Paraphraser
TABLE OF CONTENT
INTRODUCTION...........................................................................................................................3
TASK 1............................................................................................................................................3
Law of demand and its movement as well as change in the curve..............................................3
Law of Supply, Movement Along Supply Curve and Changes in Supply Curve with its Factors
.....................................................................................................................................................7
TASK 2..........................................................................................................................................11
Critical evaluation of macroeconomic theories issues...............................................................11
Compare and contrast between emerging theories and model of 21 century of contemporary
economic....................................................................................................................................11
Behavioural Economics.............................................................................................................12
Issues in macroeconomic theory................................................................................................13
CONCLUSION..............................................................................................................................13
REFERENCE................................................................................................................................14
2
INTRODUCTION
Economics is a very wide topic that helps in ascertaining what are the different market
forces and the manner in which they affect the decision making of individual as well as
organisation (Marwala and Hurwitz, 2017). The current report will analyse the concepts of
supply and demand by ascertaining different aspects related to their movement and shift in the
respective demand and supply curves. Further the report will identify and analyse he different
theories that were developed at the macroeconomic level and then they will be critically analysed
and compared to each other.
TASK 1
Law of demand and its movement as well as change in the curve
The concept of the demand is the one force out of the two major market forces i.e. demand
and supply that collectively regulate the entire market. The law of demand broadly depicts the
interrelationship that exists between the price of a commodity and the quantity demanded of that
commodity in the market at any given point of time. Law of demand purports a negative
relationship between the two variable and this is the reason why the demand curves are
downward sloping (Dhingra, 2020). The law of demand states that when the price of any
commodity will increase in the market then consequently the quantity demanded of these goods
will automatically decline and vice- e- versa when price decreases, thus showing an inverse
relationship. In KFC as well, the demand law is practically applicable i.e. when the prices of the
beef burger increased, then demand for it automatically declined thus showing the inverse
relationship.
3
⊘ This is a preview!⊘
Do you want full access?
Subscribe today to unlock all pages.
Trusted by 1+ million students worldwide
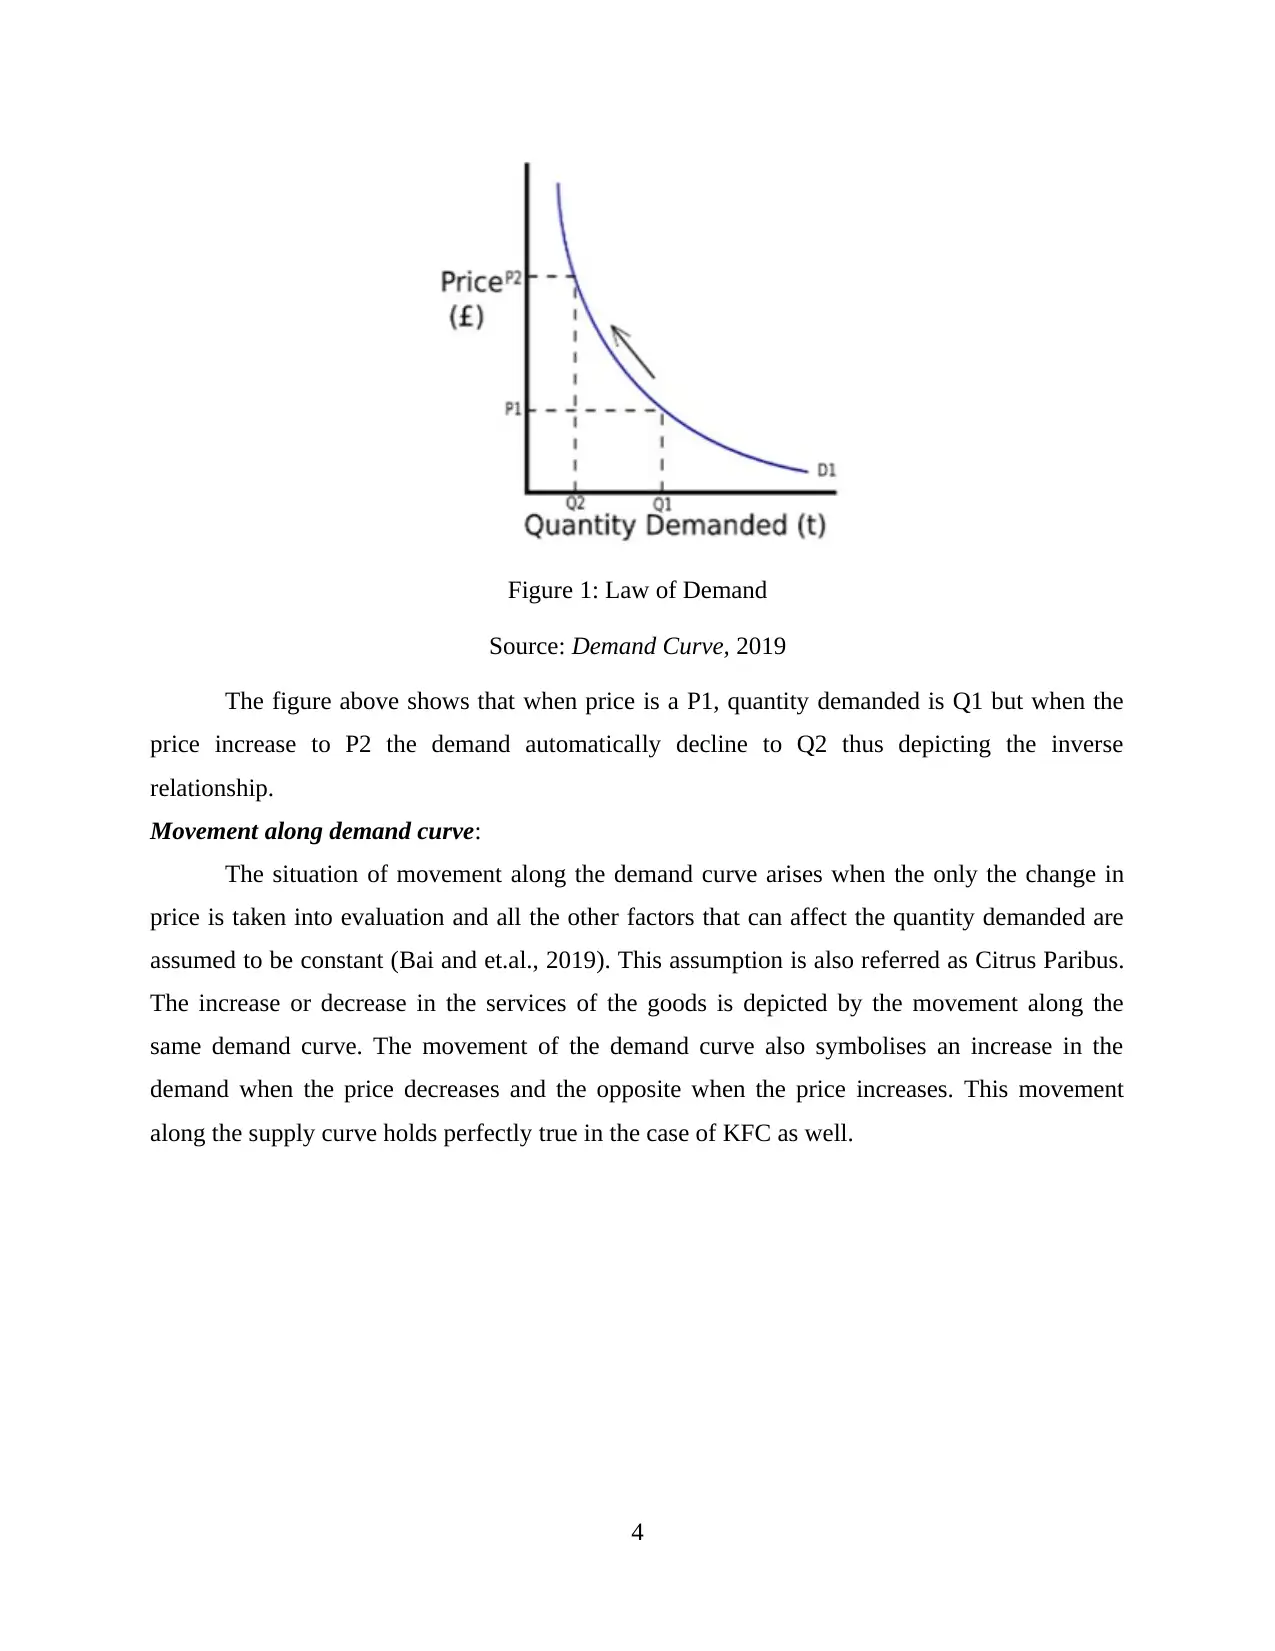
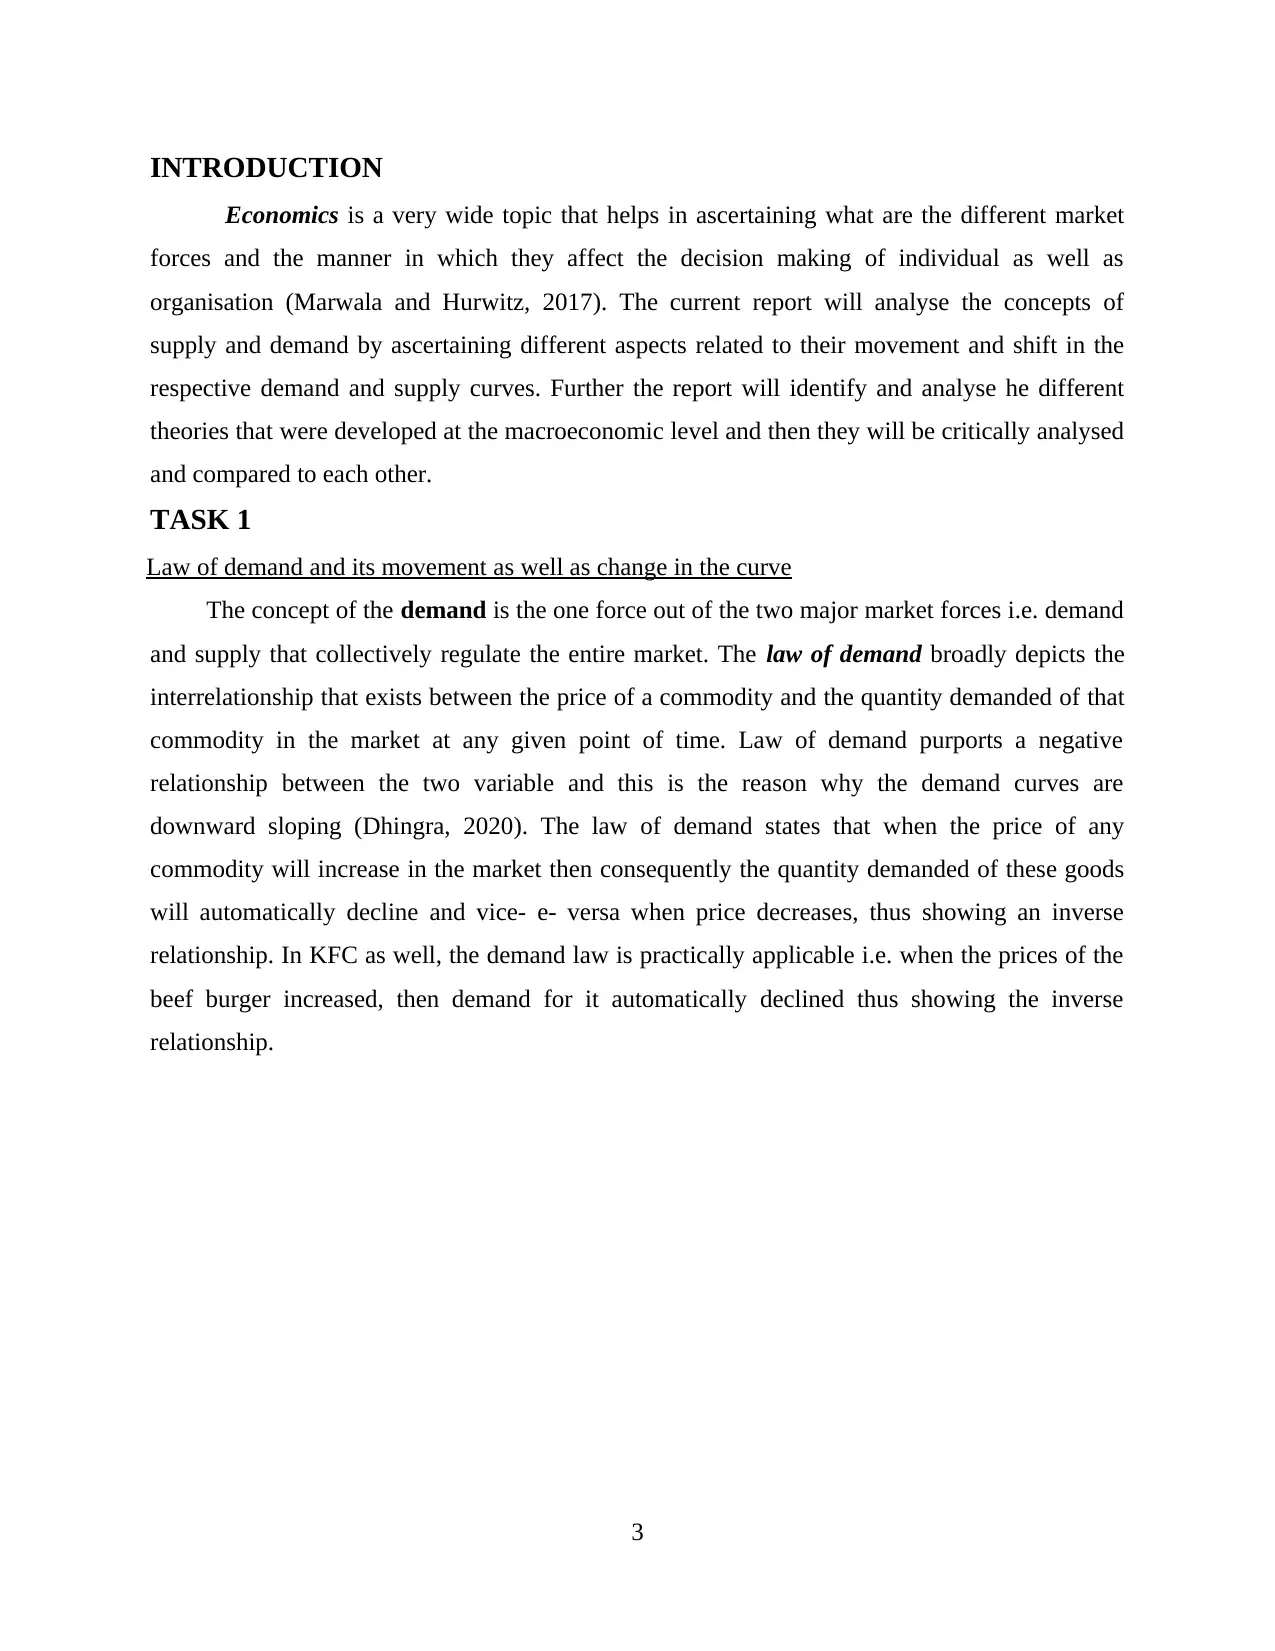
Figure 1: Law of Demand
Source: Demand Curve, 2019
The figure above shows that when price is a P1, quantity demanded is Q1 but when the
price increase to P2 the demand automatically decline to Q2 thus depicting the inverse
relationship.
Movement along demand curve:
The situation of movement along the demand curve arises when the only the change in
price is taken into evaluation and all the other factors that can affect the quantity demanded are
assumed to be constant (Bai and et.al., 2019). This assumption is also referred as Citrus Paribus.
The increase or decrease in the services of the goods is depicted by the movement along the
same demand curve. The movement of the demand curve also symbolises an increase in the
demand when the price decreases and the opposite when the price increases. This movement
along the supply curve holds perfectly true in the case of KFC as well.
4
Paraphrase This Document
Need a fresh take? Get an instant paraphrase of this document with our AI Paraphraser
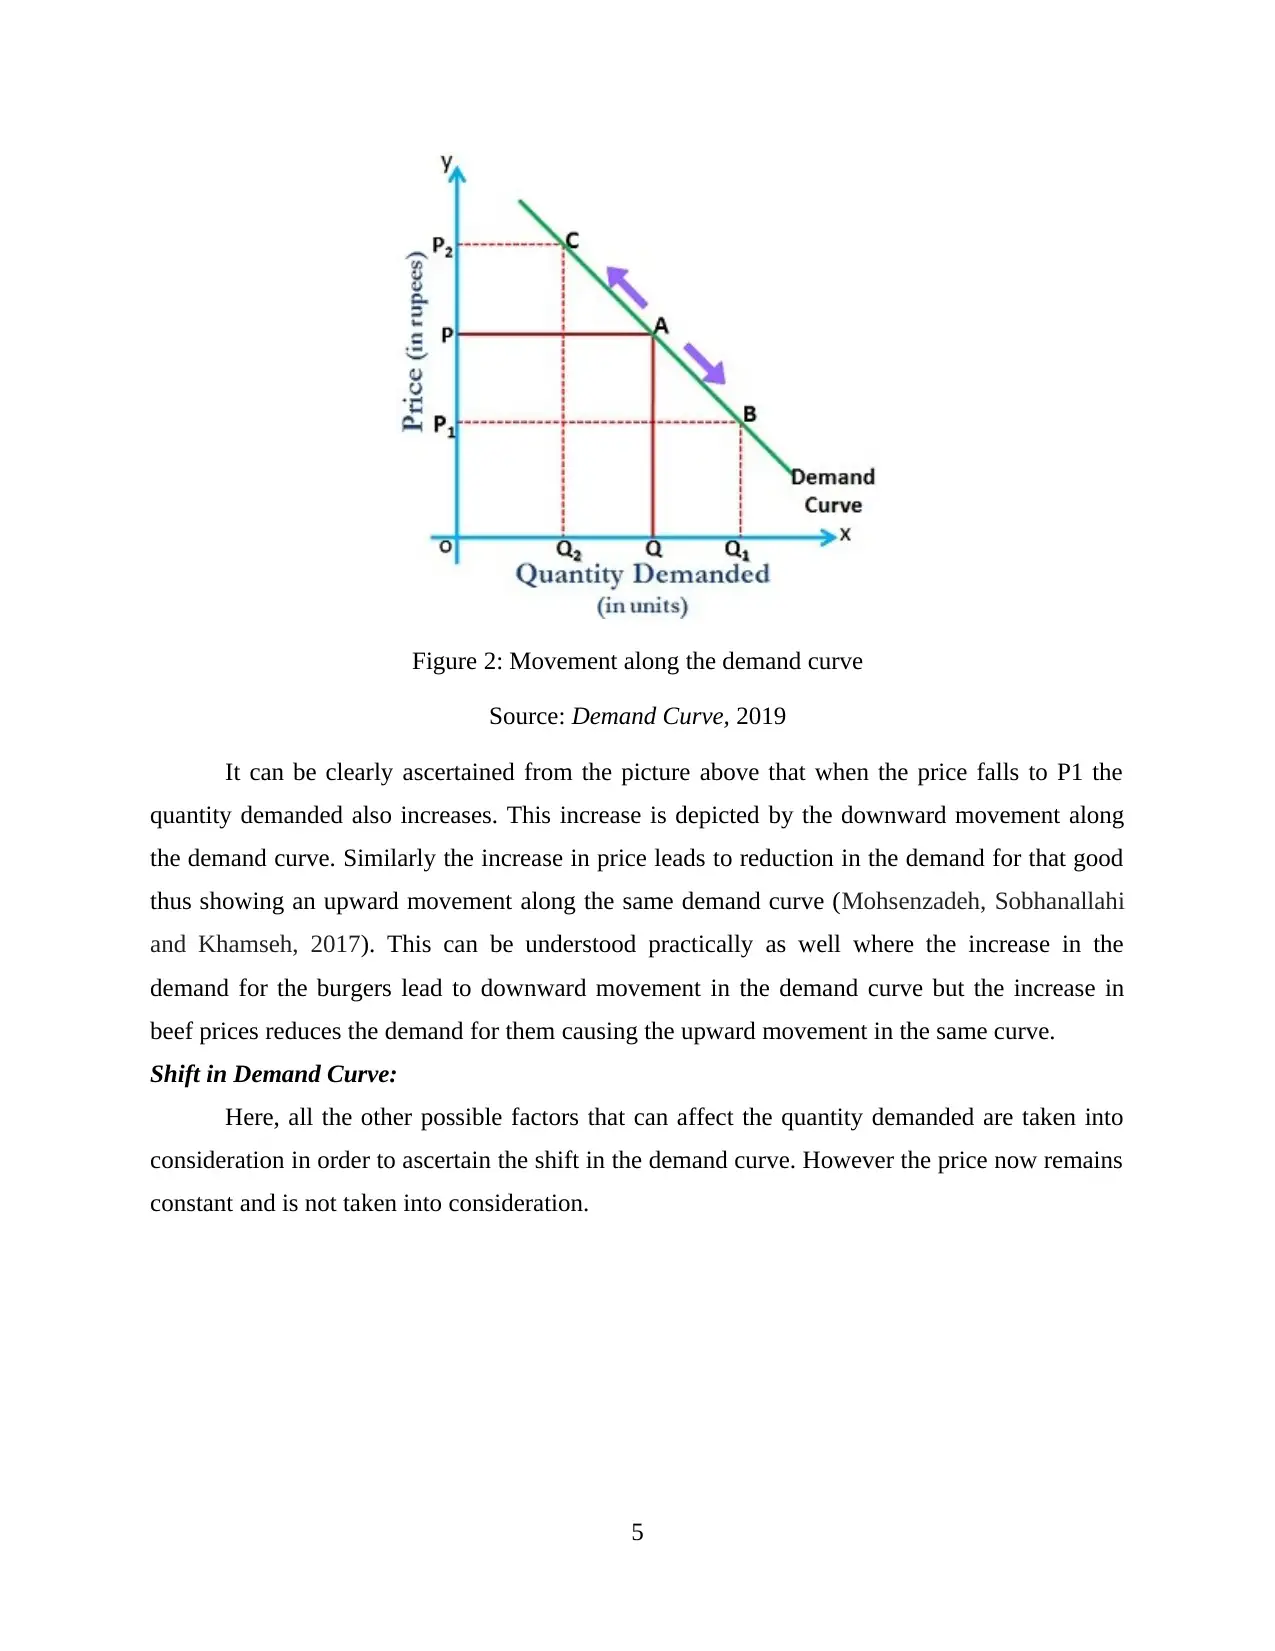
Figure 2: Movement along the demand curve
Source: Demand Curve, 2019
It can be clearly ascertained from the picture above that when the price falls to P1 the
quantity demanded also increases. This increase is depicted by the downward movement along
the demand curve. Similarly the increase in price leads to reduction in the demand for that good
thus showing an upward movement along the same demand curve (Mohsenzadeh, Sobhanallahi
and Khamseh, 2017). This can be understood practically as well where the increase in the
demand for the burgers lead to downward movement in the demand curve but the increase in
beef prices reduces the demand for them causing the upward movement in the same curve.
Shift in Demand Curve:
Here, all the other possible factors that can affect the quantity demanded are taken into
consideration in order to ascertain the shift in the demand curve. However the price now remains
constant and is not taken into consideration.
5
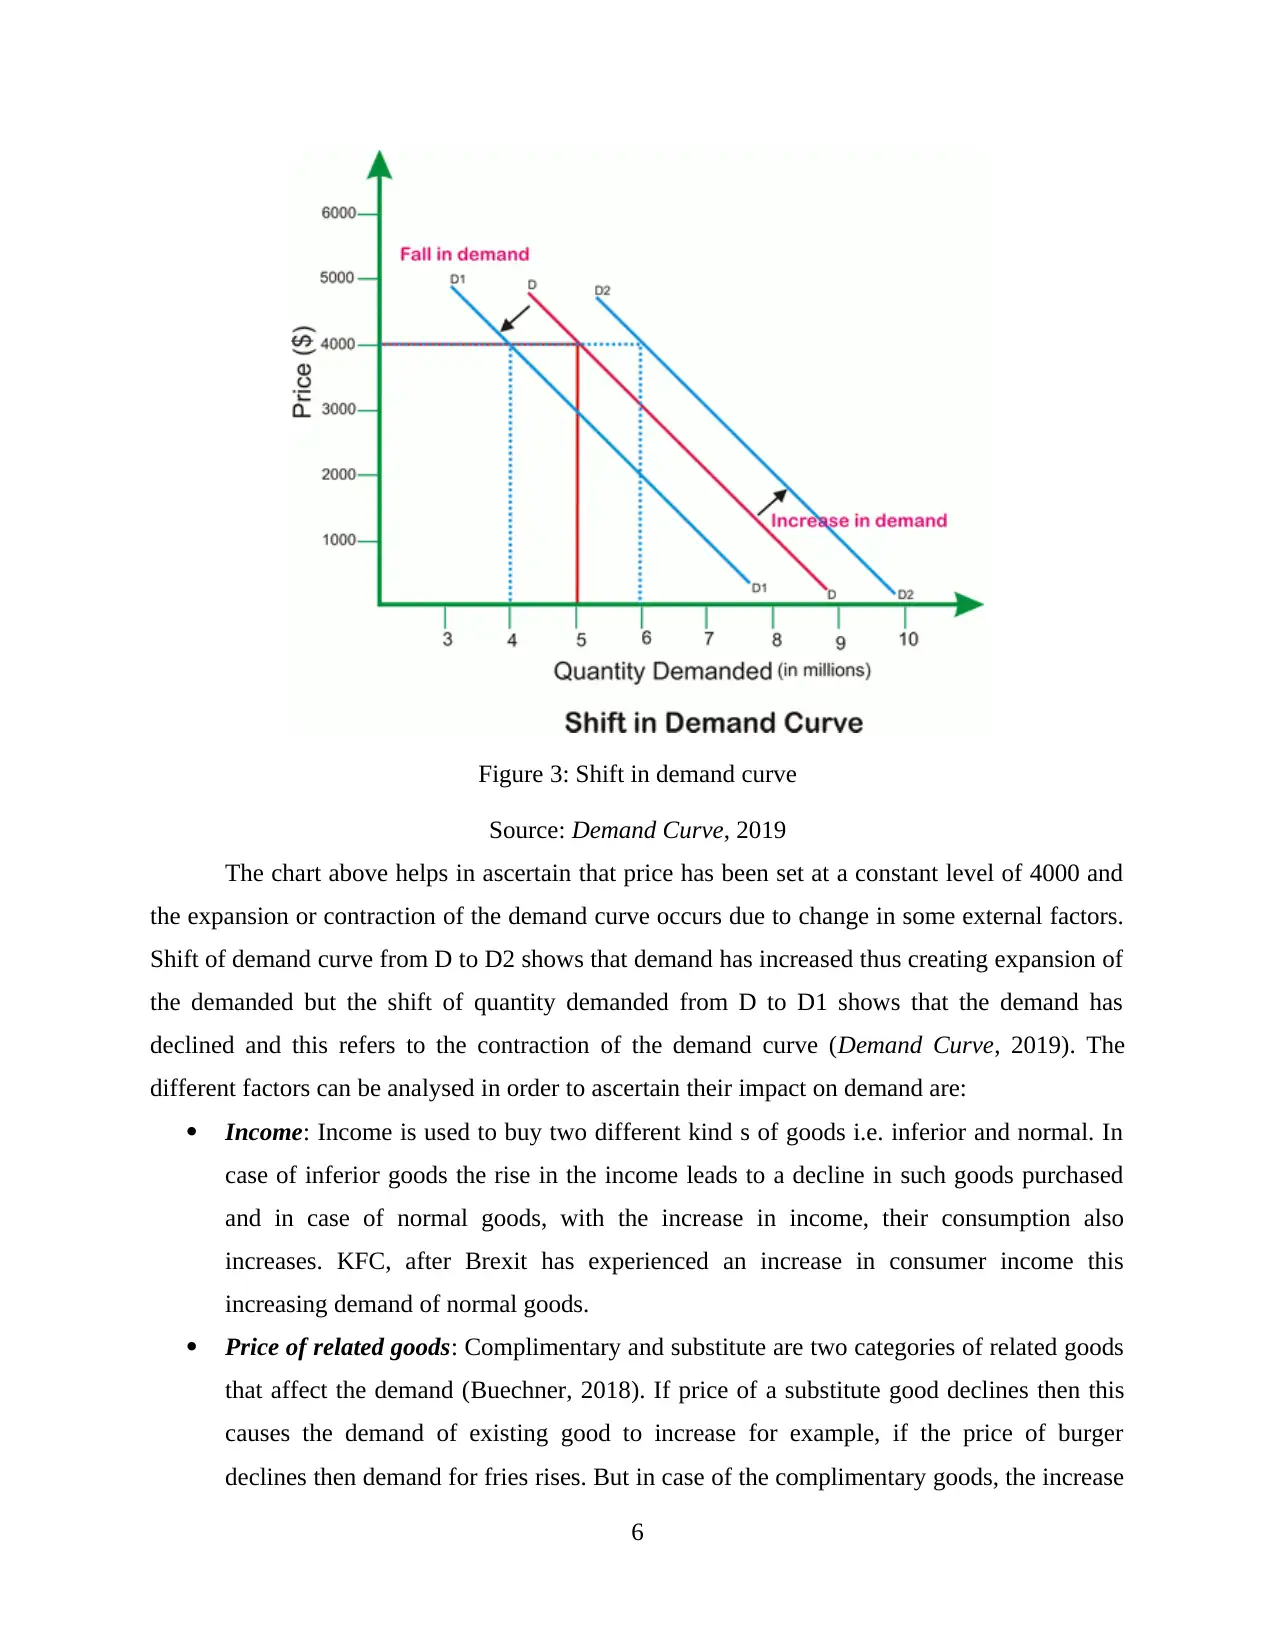
Figure 3: Shift in demand curve
Source: Demand Curve, 2019
The chart above helps in ascertain that price has been set at a constant level of 4000 and
the expansion or contraction of the demand curve occurs due to change in some external factors.
Shift of demand curve from D to D2 shows that demand has increased thus creating expansion of
the demanded but the shift of quantity demanded from D to D1 shows that the demand has
declined and this refers to the contraction of the demand curve (Demand Curve, 2019). The
different factors can be analysed in order to ascertain their impact on demand are:
Income: Income is used to buy two different kind s of goods i.e. inferior and normal. In
case of inferior goods the rise in the income leads to a decline in such goods purchased
and in case of normal goods, with the increase in income, their consumption also
increases. KFC, after Brexit has experienced an increase in consumer income this
increasing demand of normal goods.
Price of related goods: Complimentary and substitute are two categories of related goods
that affect the demand (Buechner, 2018). If price of a substitute good declines then this
causes the demand of existing good to increase for example, if the price of burger
declines then demand for fries rises. But in case of the complimentary goods, the increase
6
⊘ This is a preview!⊘
Do you want full access?
Subscribe today to unlock all pages.
Trusted by 1+ million students worldwide
in price of one good leads to the decrease in demand of its complimentary as well. For
example, if price of burgers increase at KFC then demand for coke automatically
declines.
Therefore, there are many other factors as well such as taste and preferences, government
norms etc that affect the consumer demand in market.
Law of Supply, Movement Along Supply Curve and Changes in Supply Curve with its Factors
Law of Supply:
The law of supply states is an economic law that states that when all external factors are
unchanged, the quantity of products manufactured by a business organisation increases, when its
price in the consumer markers increases. This is because suppliers and manufacturers always
wish to maximise their own profitability by increasing the quantity of products available in the
markets at higher costs (Buechner, 2018). This law can be applied to the operations of KFC,
stating that as the prices of a particular product offered by KFC increases in the consumer
markets, KFC’s leadership and management will want to capitalise on this increased price and
produce higher quantity of this particular product in the consumer markets in order maximise
their operational profitability within the fast food industries.
The supply curve is a way to graphically represent the relationship that exists between the price
of a given commodity such as price of Zinger burger of KFC and the quantity of the product that
is available for the consumers to purchase, i.e. the number of Zinger burgers available for
purchase by consumers at KFC outlets (Marwala and Hurwitz, 2017). The supply curve
depicting law of supply is as follows:
7
Paraphrase This Document
Need a fresh take? Get an instant paraphrase of this document with our AI Paraphraser
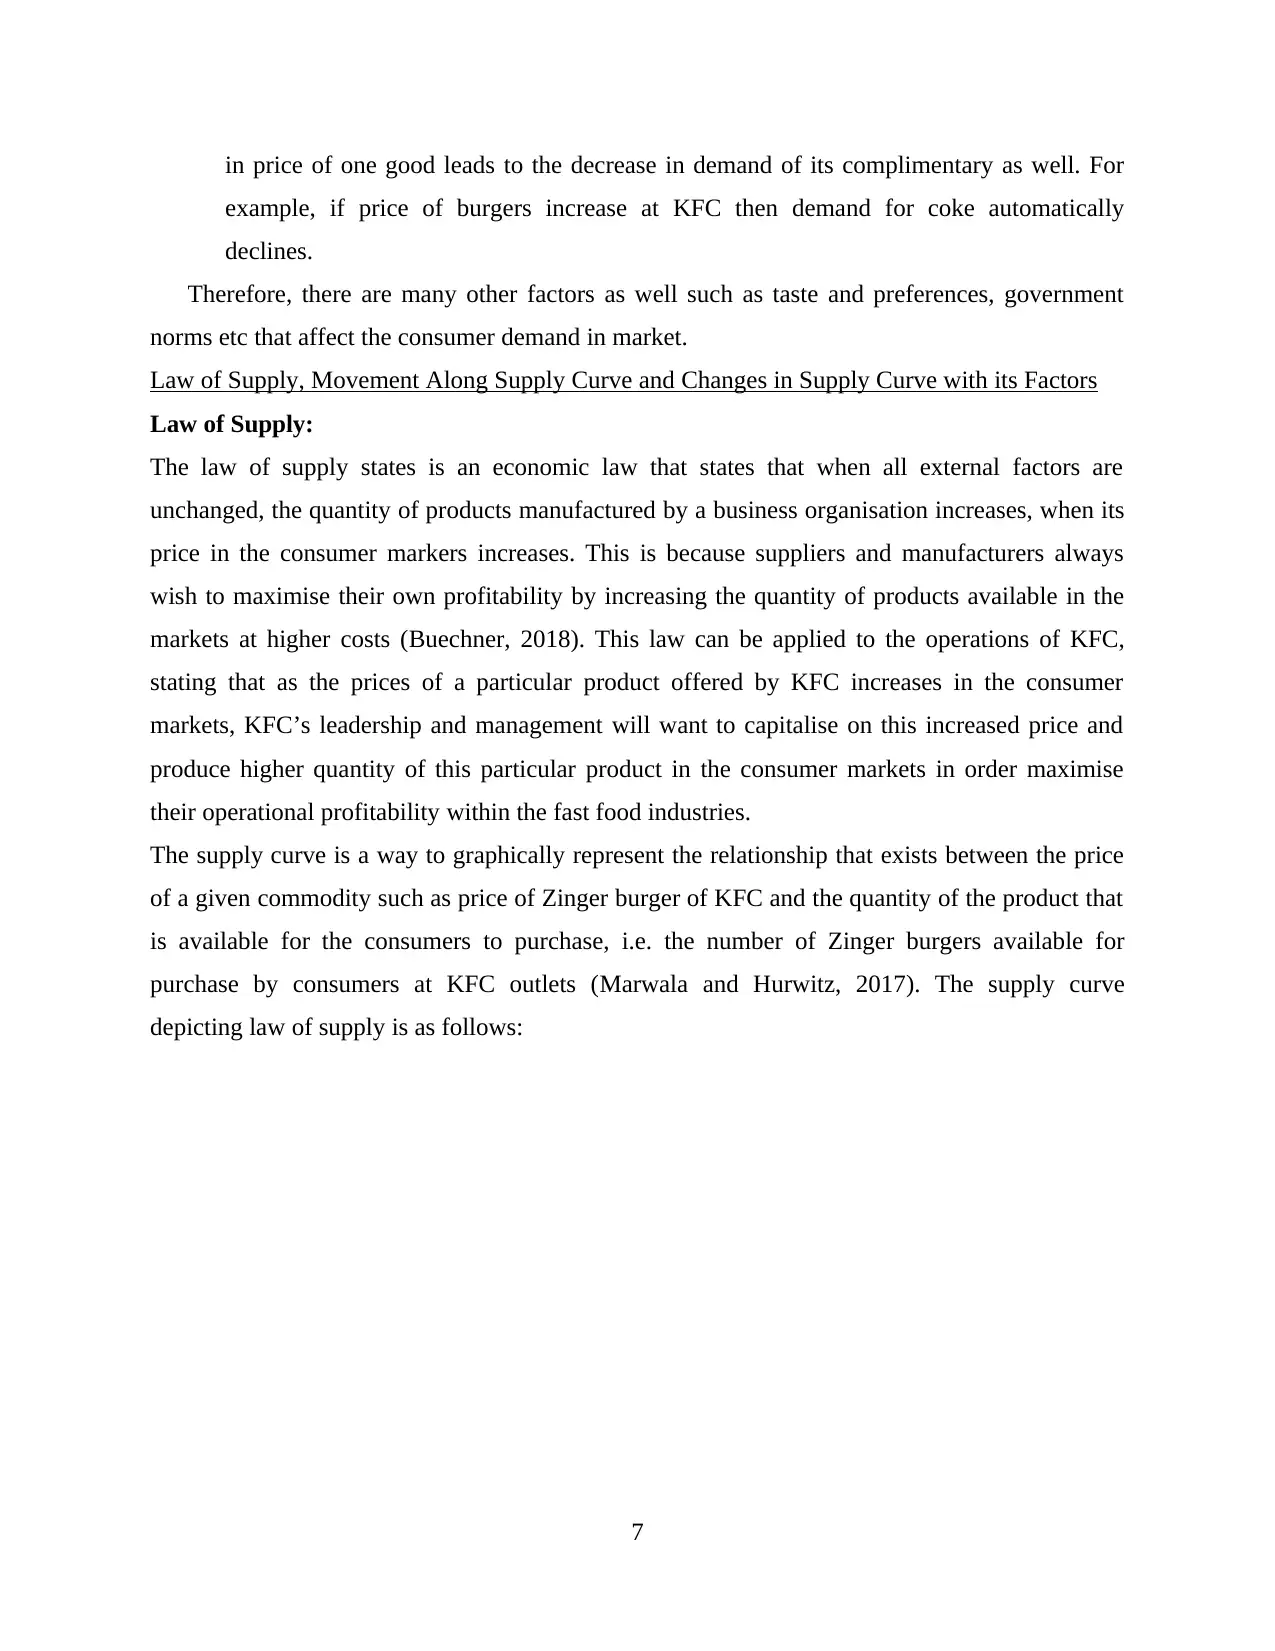
Figure 4: Diagram for the law of supply
From the above diagram, it can clearly be seen that as the price of a product increases
from P3 to P2 to P1, its quantity supplied to consumer also proportionally increases from Q3 to
Q2 to Q1, with the supply curve being a straight line as a direct result of this proportional
increase.
Movement Along Supply Curve:
Movement along the supply curve graphically represents to us the changes with respect to
the rise and fall of prices of a given commodity, and the overall quantity of commodity supplied
to consumers which is directly dependent on the rise and fall in the given price of the commodity
(Dhingra, 2020). This movement along a supply curve showcases to us the variations in the
quantity of supplied products in relation to changes in its price charged, as long as all other
external factors remain unchanged. Movement along a given supply curve can be seen in the
following figure:
8
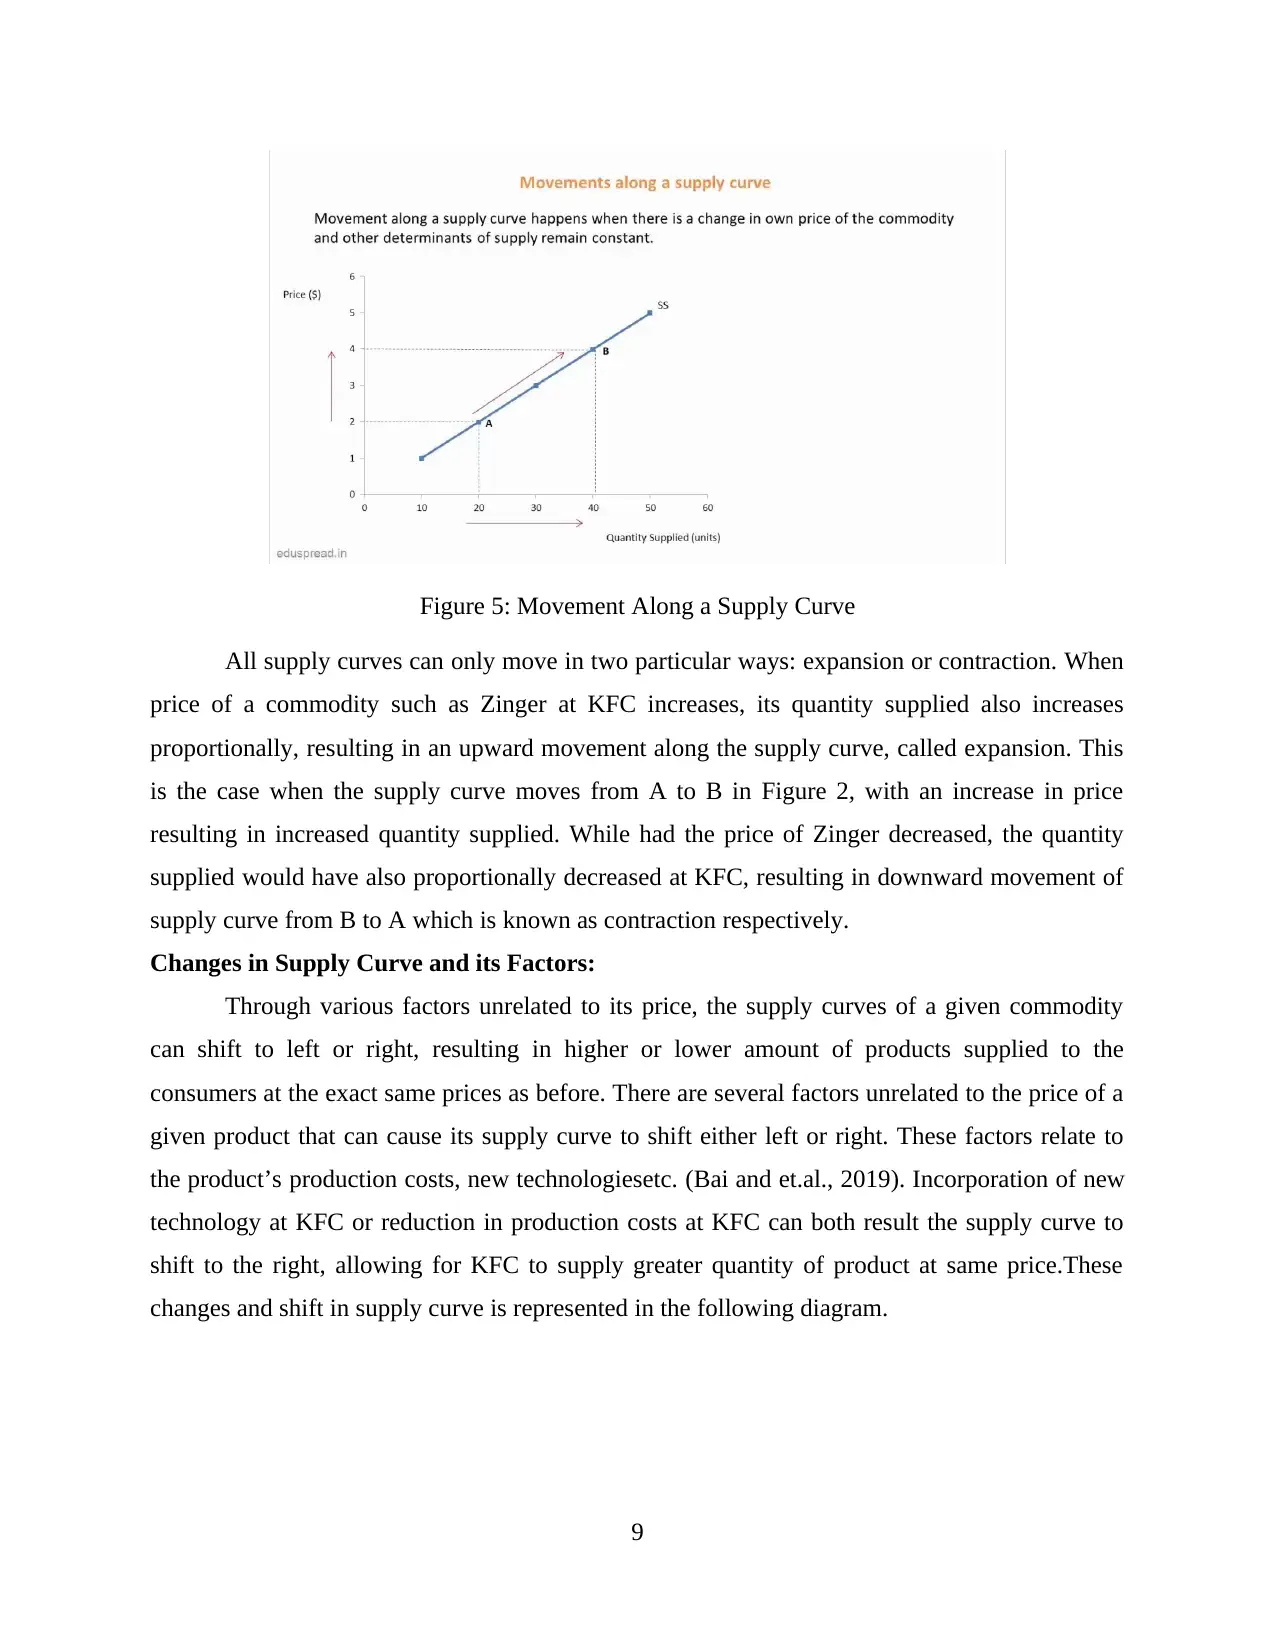
Figure 5: Movement Along a Supply Curve
All supply curves can only move in two particular ways: expansion or contraction. When
price of a commodity such as Zinger at KFC increases, its quantity supplied also increases
proportionally, resulting in an upward movement along the supply curve, called expansion. This
is the case when the supply curve moves from A to B in Figure 2, with an increase in price
resulting in increased quantity supplied. While had the price of Zinger decreased, the quantity
supplied would have also proportionally decreased at KFC, resulting in downward movement of
supply curve from B to A which is known as contraction respectively.
Changes in Supply Curve and its Factors:
Through various factors unrelated to its price, the supply curves of a given commodity
can shift to left or right, resulting in higher or lower amount of products supplied to the
consumers at the exact same prices as before. There are several factors unrelated to the price of a
given product that can cause its supply curve to shift either left or right. These factors relate to
the product’s production costs, new technologiesetc. (Bai and et.al., 2019). Incorporation of new
technology at KFC or reduction in production costs at KFC can both result the supply curve to
shift to the right, allowing for KFC to supply greater quantity of product at same price.These
changes and shift in supply curve is represented in the following diagram.
9
⊘ This is a preview!⊘
Do you want full access?
Subscribe today to unlock all pages.
Trusted by 1+ million students worldwide
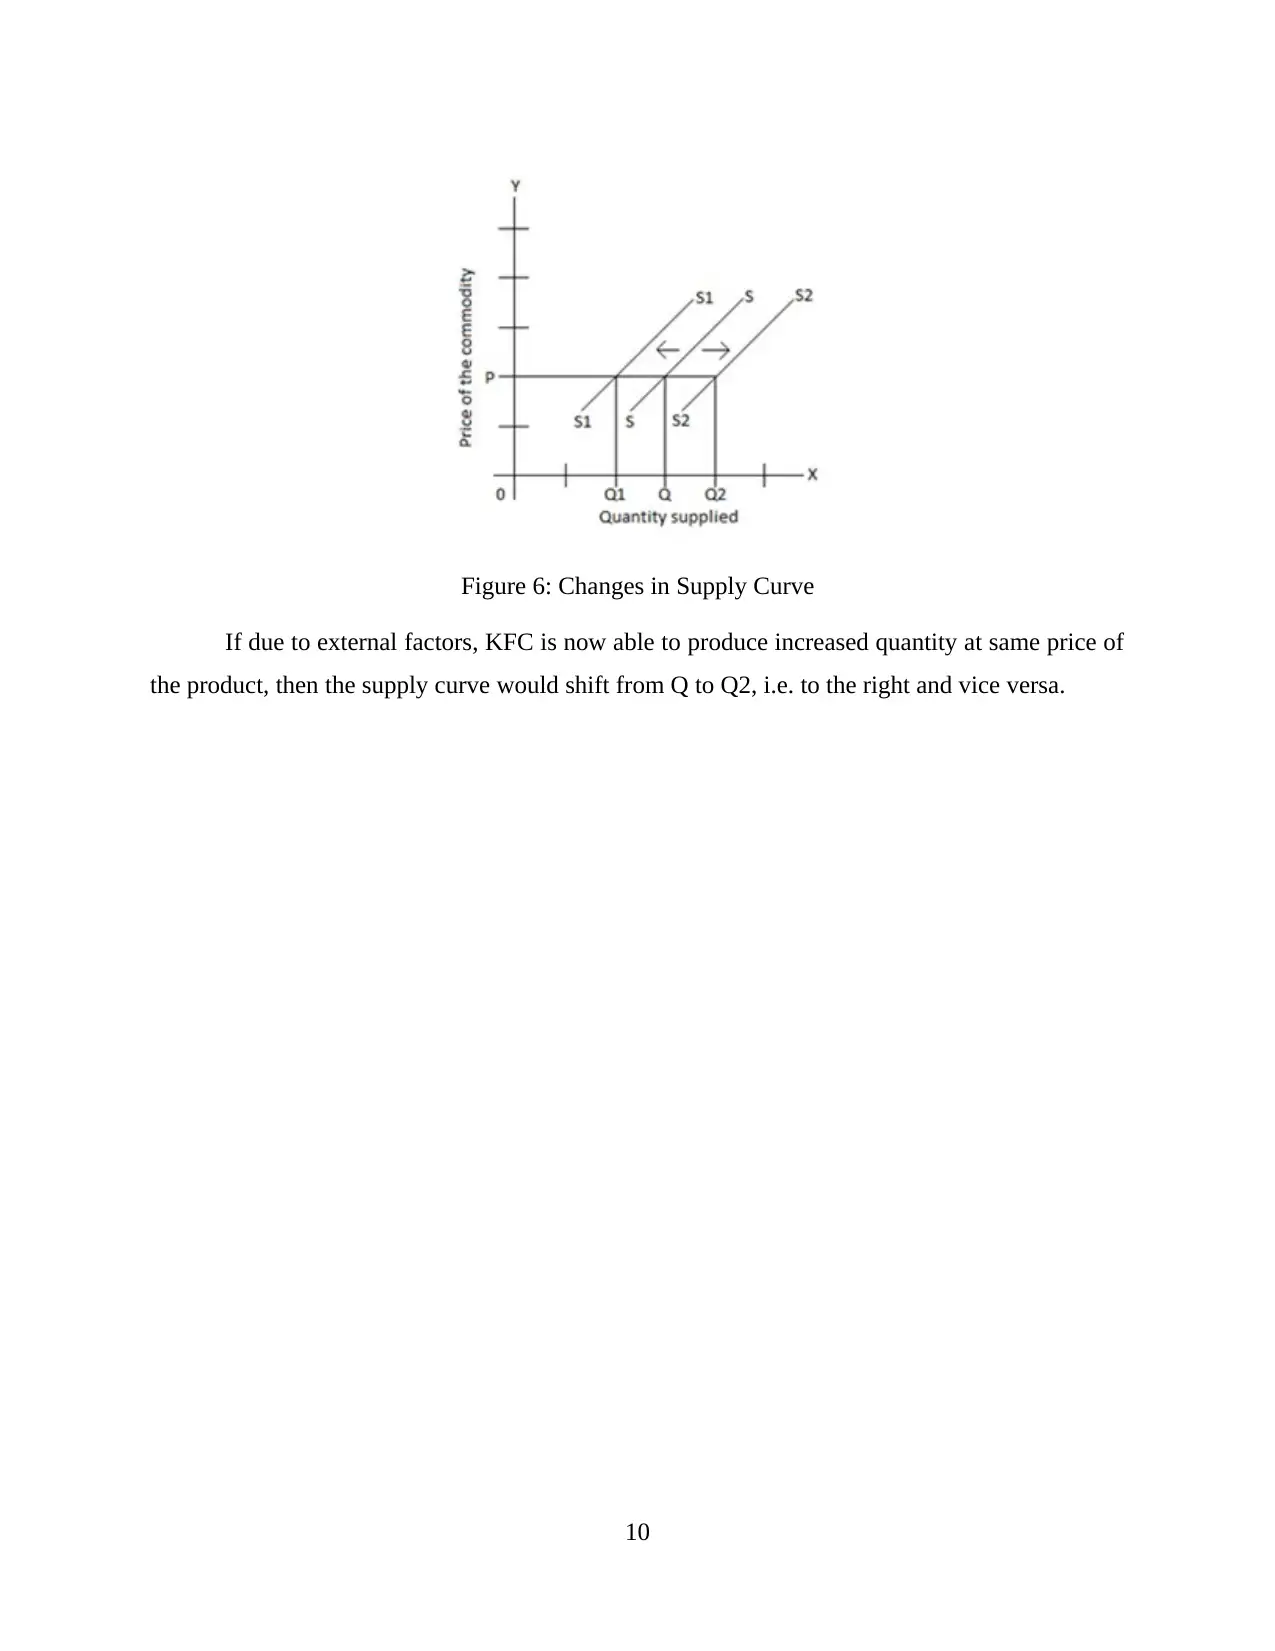
Figure 6: Changes in Supply Curve
If due to external factors, KFC is now able to produce increased quantity at same price of
the product, then the supply curve would shift from Q to Q2, i.e. to the right and vice versa.
10
If due to external factors, KFC is now able to produce increased quantity at same price of
the product, then the supply curve would shift from Q to Q2, i.e. to the right and vice versa.
10
Paraphrase This Document
Need a fresh take? Get an instant paraphrase of this document with our AI Paraphraser
TASK 2
Critical evaluation of macroeconomic theories issues
Macroeconomic theory has raised the following issues that can be projected in following
points.
Inflation: Inflation is among the key issue projected by the macro economic theory. Inflation
directly restricts the purchasing power of the customers. Due to inflation the prices of products
constantly receives hike in the market. Inflation plays the devil role in economy.
Economic growth: Economic growth is also the issue involve in macroeconomic. This involve
growth rate of the GDP of the country (Jamaludin, Ismail and Manaf, 2017). Macroeconomic
involve the growth rate of the gross domestic product of the country. Ig the country has a
sustainable growth rate it positively affect the country growth and development.
Unemployment: Unemployment is also the huge issue part of the macroeconomic. This is the
huge challenge that restricts the growth potential of country. Unemployment reduces the income
structure of the people in society.
The above mentioned issues are among the key issues associated with macroeconomic.
Compare and contrast between emerging theories and model of 21 century of contemporary
economic
There are various contemporary economic theory such as Keynesian economic theory
that states government of country should takes steps to increase demand of products in order to
boost economic growth of particular country. Therefore government spending is one of the main
tools that is used to increase demand of products and economic growth. Increase inflation is one
of the drawbacks of Keynesian economic theory (Zweifel, Praktiknjo and Erdmann, 2017 ).
Government through making more infrastructure and investments in technology able to enhance
living standard of people so that they are willing to prefer products of KFC as compared to other
companies. Investment in various areas helped in generating more employment opportunities and
increase level of income of customers so that they can easily purchase products of KFC to satisfy
their needs and wants.
11
Another theory of contemporary environment is Friedmanite economic theory that included free
market theory that state buyer and seller are free to decide prices of products and services thus
government have no or less control over prices of products. It also have criticism that in real life
no such economy is found that have limited or no intervention in prices of products and services
(Karabag and Berggren, 2016). KFC has set prices of its products and services as per demand
and supply of raw material so that firm can earn maximum profitability and market share.
Therefore both seller and buyer themselves set prices of products and services rather within
intervention of government in decision making.
Fisher equation is economic theory that explains about relationship between real interest
rates and nominal under effect of inflation. Therefore as per this theory it can be stated that if
expected inflation rates is minus with nominal interest rate than it will be equal to real rates. It is
further extended to evaluates and analysis international currencies trading and money supply
within particular country (Ortiz‐de‐Mandojana and Bansal, 2016). Real rates refers to
purchasing power of customers on the other hand nominal interest rate refers to financial return
that individual get through depositing money in any financial institution. Therefore the more real
rates are equal to nominal rates individual are able to purchase more and more products and
services in order to satisfied their needs and demand (Nowiński and Kozma, 2017). Thus, it can
be stated that equal of real rates to nominal rates helps in increasing sales of KFC as customers
have more money to purchase particular products and services.
Behavioural Economics
According to Lavecchia, Liu and Oreopoulos, (2016) behavioural economics is the study
of different behaviours of people which includes social factors like, attitude, beliefs, cultural
values which helps them to make decisions and improve their standard of living effectively. All
these decision also impacted the economic activities in the business environment to achieve their
objectives. Nudge theory is the economic and political behavioural theory which analyses all
factors which influence decision making of people and impact the demand and supply of market.
This theory helps to provide positive impact of changes in behaviours of people which can
increase the potential of politics. It also has improved the diplomacy in the world and helps to
lead people effectively. Nudge theory provides optimistic approach to survive in the environment
12
⊘ This is a preview!⊘
Do you want full access?
Subscribe today to unlock all pages.
Trusted by 1+ million students worldwide
1 out of 15
Related Documents


Your All-in-One AI-Powered Toolkit for Academic Success.
+13062052269
info@desklib.com
Available 24*7 on WhatsApp / Email
![[object Object]](/_next/static/media/star-bottom.7253800d.svg)
Unlock your academic potential
Copyright © 2020–2026 A2Z Services. All Rights Reserved. Developed and managed by ZUCOL.