BM533: Demand, Supply, and Behavioural Economics in Business Report
VerifiedAdded on 2023/01/05
|12
|3227
|72
Report
AI Summary
This report, prepared for the BM533 Contemporary Business Economics module, offers a comprehensive analysis of microeconomic principles. It begins with an introduction to economics, highlighting the importance of demand and supply in business operations, using the ice cream business as a case study. Task 1 delves into demand analysis, explaining the law of demand, movements along the demand curve, and shifts in the demand curve, along with factors influencing demand changes. It then explores supply analysis, detailing the law of supply, movements along the supply curve, and factors causing shifts in the supply curve. Equilibrium analysis is then discussed, explaining the interaction of demand and supply to determine equilibrium price and quantity, including scenarios of surplus and shortage. Task 2 examines emerging theories in behavioural economics, contrasting them with 20th-century theories such as prospect theory and bounded rationality, and relates these theories to modern business practices. The report concludes by summarizing the key findings and providing references.

Assignment
1
1
Paraphrase This Document
Need a fresh take? Get an instant paraphrase of this document with our AI Paraphraser
Contents
Introduction......................................................................................................................................3
Task 1...............................................................................................................................................3
Demand analysis..........................................................................................................................3
Supply analysis............................................................................................................................6
Equilibrium analysis....................................................................................................................7
Task 2...............................................................................................................................................8
Emerging theories and models of behavioural economics in 21st century in contrast with 20th
century theories............................................................................................................................8
Conclusion.....................................................................................................................................10
References......................................................................................................................................12
2
Introduction
Economics is concerned with production, distribution and consumption of resources, which
is also basic for business. A business activity is concerned with producing goods and services to
be distributed among consumers. A business organisation operates under various types of forces
which influences its activities, one of which is economic environment (Mirica, 2019). It is
concerned with interaction of market forces. For the sake of easy and coherent presentation of
this report, ice cream business is taken as context. First of all, demand and supply analysis has
been made for the business. Both of them are market forces that are fundamentally important for
any business to understand their course of action. An equilibrium analysis has also been drawn
for the business with regard to the demand and supply. In the next part, behavioural economics
has been discussed. Comparison has been drawn between theories related to behavioural
economics propounded in 20th century with 21st century applications.
Task 1
Microeconomics assumes that in a market economy, decisions about production and
consumption are made by individual producers and consumers and their decisions are taken with
equilibrium attained with the help of free interactions of market forces of demand and supply.
Aggregate demand of all customers of commodities and services in microeconomic environment
forms the total demand in the macroeconomic environment, so is supply.
Demand analysis
Demand, in economics, refers to desire of a customer to buy a product or service at a
specific price backed by willingness and ability to purchase. It is very important for businesses to
understand the factors that induce customers to spend their money on some product or service, so
that they can predict volume of their sale. Incorrect estimations of demand and consumer
spending on the part of business organisations can lead to loss in opportunities and profits
(Browning and Zupan, 2020). It is demand, that fuels economic environment and pumps
producers to bring their products on table.
As per law of demand, with other factors being constant, an increase in price of goods or
services results in reduction in quantity demanded of that commodity. This means that quantity
demanded and price has an inverse relationship. This inverse relationship is characterised by a
negative slope in demand curve. Demand curve is a graphical representation of demand schedule
3
⊘ This is a preview!⊘
Do you want full access?
Subscribe today to unlock all pages.
Trusted by 1+ million students worldwide
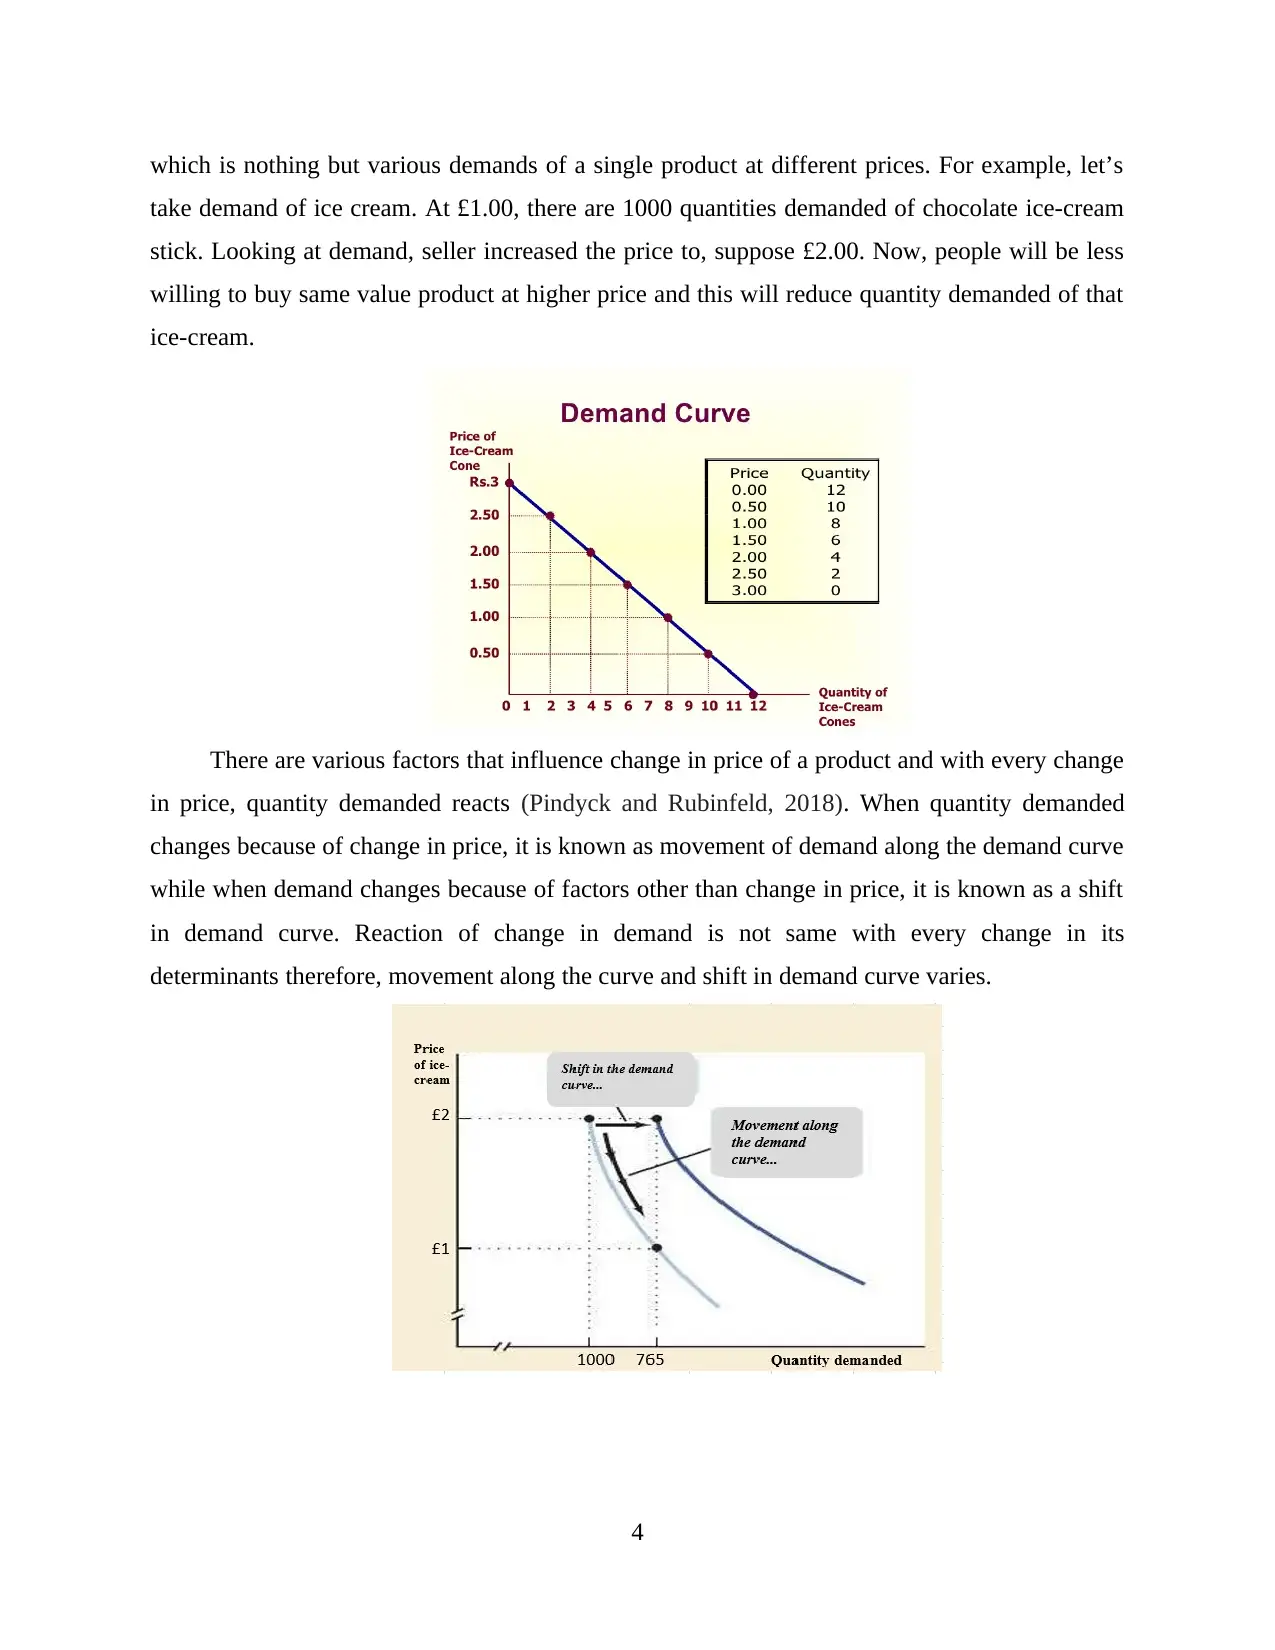
which is nothing but various demands of a single product at different prices. For example, let’s
take demand of ice cream. At £1.00, there are 1000 quantities demanded of chocolate ice-cream
stick. Looking at demand, seller increased the price to, suppose £2.00. Now, people will be less
willing to buy same value product at higher price and this will reduce quantity demanded of that
ice-cream.
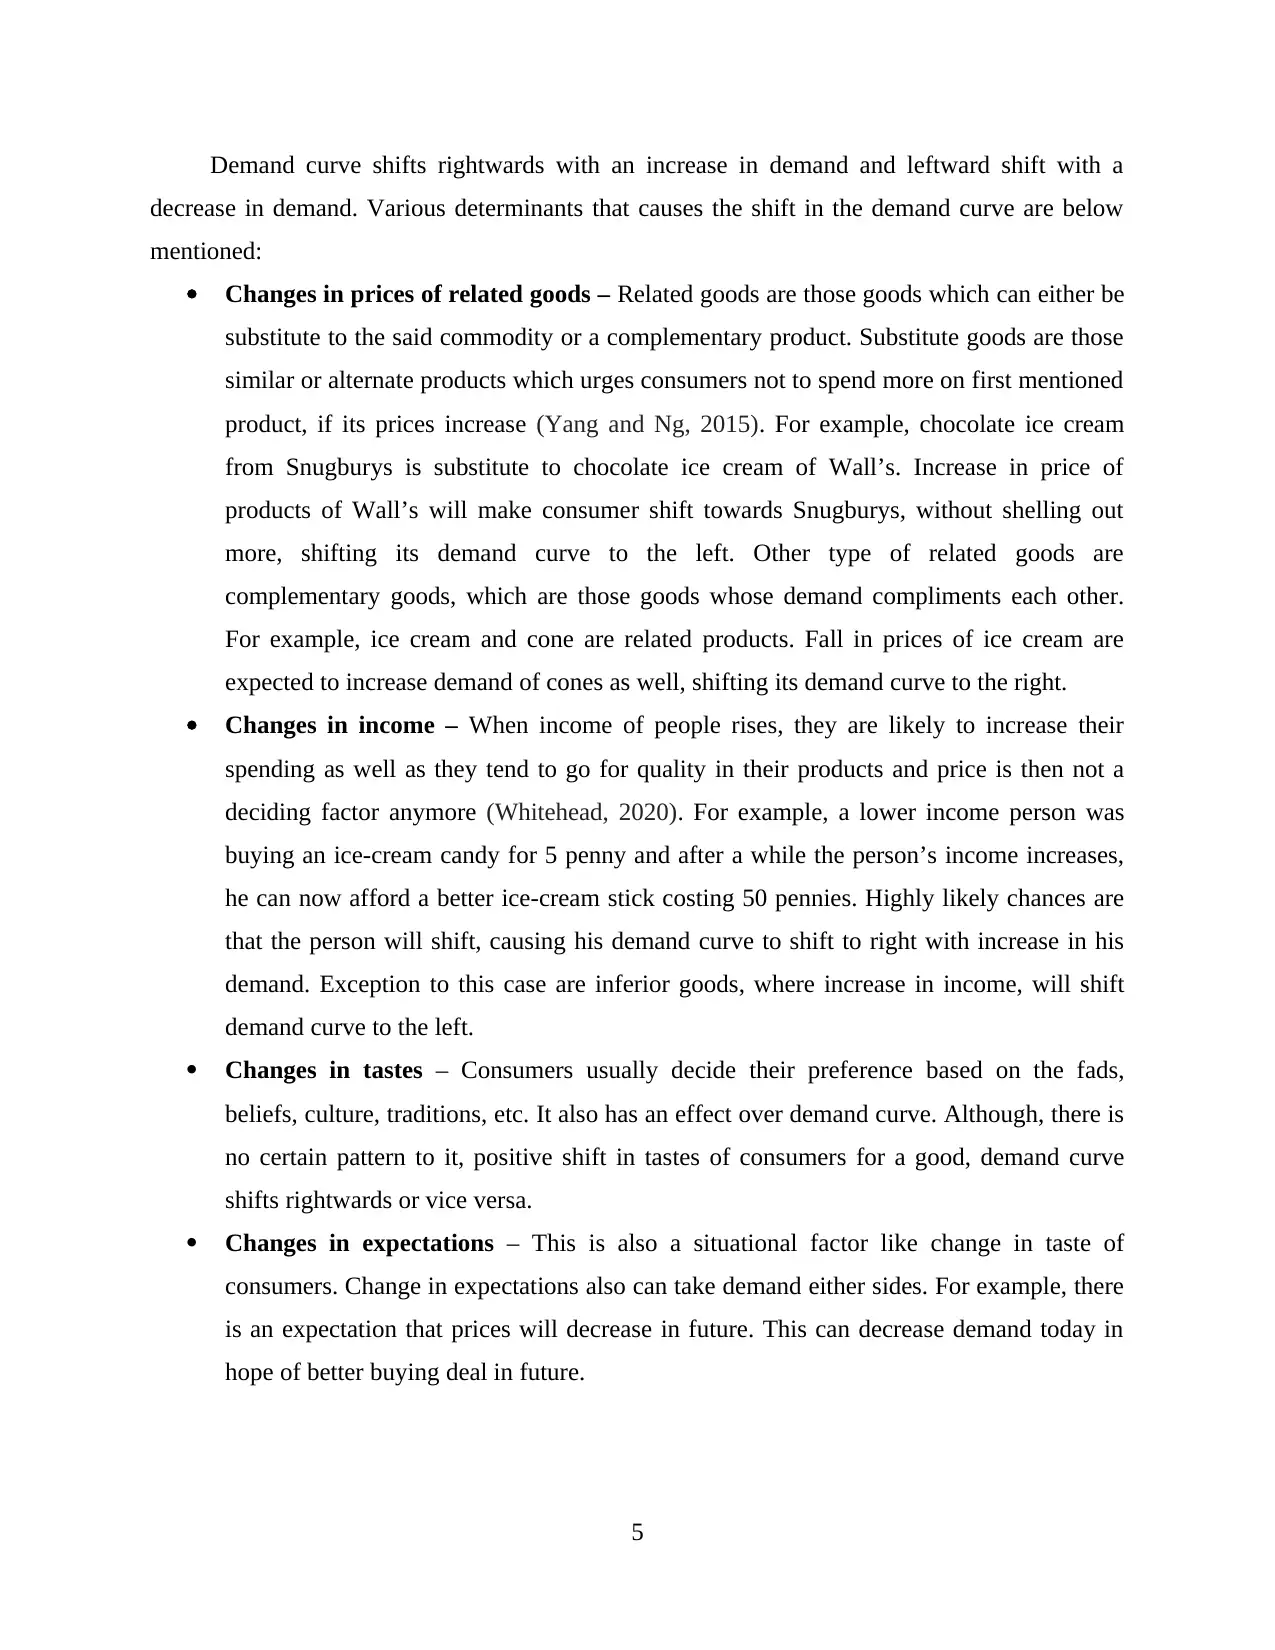
There are various factors that influence change in price of a product and with every change
in price, quantity demanded reacts (Pindyck and Rubinfeld, 2018). When quantity demanded
changes because of change in price, it is known as movement of demand along the demand curve
while when demand changes because of factors other than change in price, it is known as a shift
in demand curve. Reaction of change in demand is not same with every change in its
determinants therefore, movement along the curve and shift in demand curve varies.
4
take demand of ice cream. At £1.00, there are 1000 quantities demanded of chocolate ice-cream
stick. Looking at demand, seller increased the price to, suppose £2.00. Now, people will be less
willing to buy same value product at higher price and this will reduce quantity demanded of that
ice-cream.
There are various factors that influence change in price of a product and with every change
in price, quantity demanded reacts (Pindyck and Rubinfeld, 2018). When quantity demanded
changes because of change in price, it is known as movement of demand along the demand curve
while when demand changes because of factors other than change in price, it is known as a shift
in demand curve. Reaction of change in demand is not same with every change in its
determinants therefore, movement along the curve and shift in demand curve varies.
4
Paraphrase This Document
Need a fresh take? Get an instant paraphrase of this document with our AI Paraphraser
Demand curve shifts rightwards with an increase in demand and leftward shift with a
decrease in demand. Various determinants that causes the shift in the demand curve are below
mentioned:
Changes in prices of related goods – Related goods are those goods which can either be
substitute to the said commodity or a complementary product. Substitute goods are those
similar or alternate products which urges consumers not to spend more on first mentioned
product, if its prices increase (Yang and Ng, 2015). For example, chocolate ice cream
from Snugburys is substitute to chocolate ice cream of Wall’s. Increase in price of
products of Wall’s will make consumer shift towards Snugburys, without shelling out
more, shifting its demand curve to the left. Other type of related goods are
complementary goods, which are those goods whose demand compliments each other.
For example, ice cream and cone are related products. Fall in prices of ice cream are
expected to increase demand of cones as well, shifting its demand curve to the right.
Changes in income – When income of people rises, they are likely to increase their
spending as well as they tend to go for quality in their products and price is then not a
deciding factor anymore (Whitehead, 2020). For example, a lower income person was
buying an ice-cream candy for 5 penny and after a while the person’s income increases,
he can now afford a better ice-cream stick costing 50 pennies. Highly likely chances are
that the person will shift, causing his demand curve to shift to right with increase in his
demand. Exception to this case are inferior goods, where increase in income, will shift
demand curve to the left.
Changes in tastes – Consumers usually decide their preference based on the fads,
beliefs, culture, traditions, etc. It also has an effect over demand curve. Although, there is
no certain pattern to it, positive shift in tastes of consumers for a good, demand curve
shifts rightwards or vice versa.
Changes in expectations – This is also a situational factor like change in taste of
consumers. Change in expectations also can take demand either sides. For example, there
is an expectation that prices will decrease in future. This can decrease demand today in
hope of better buying deal in future.
5
Supply analysis
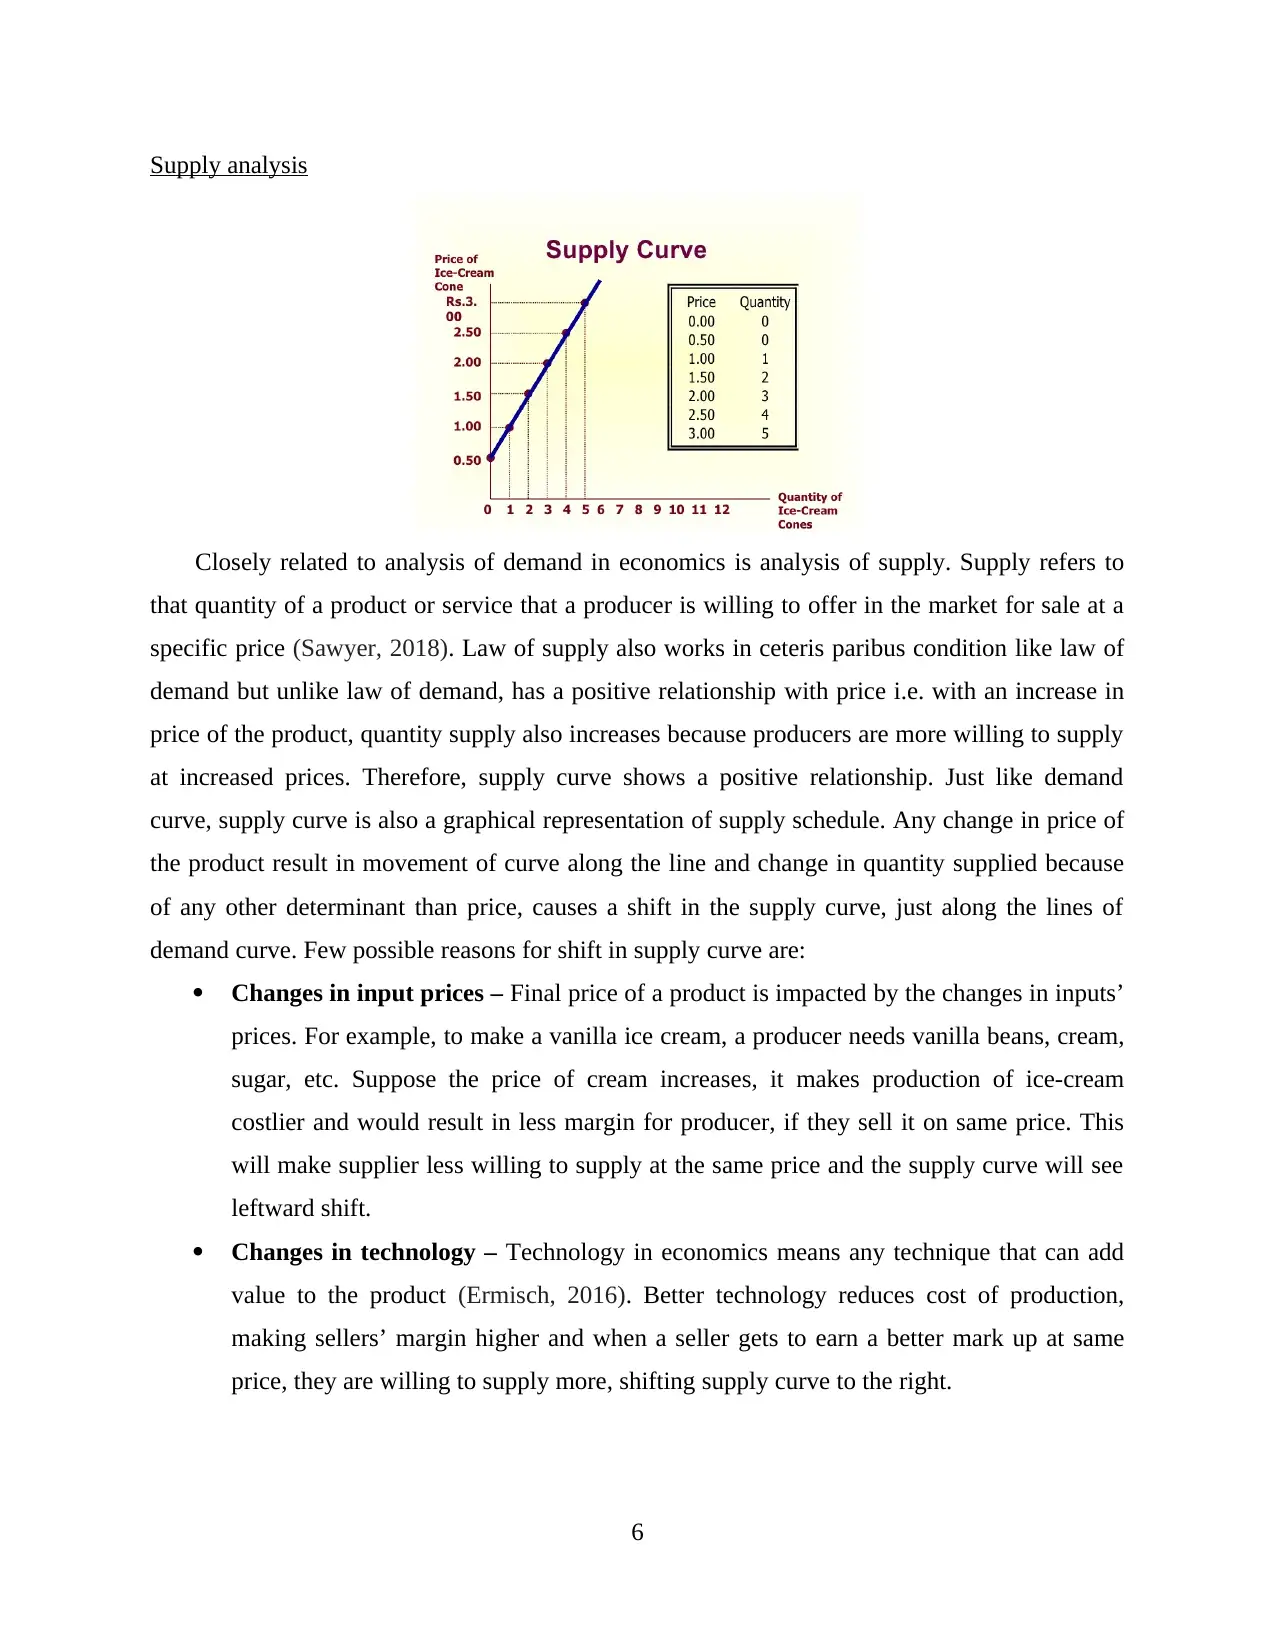
Closely related to analysis of demand in economics is analysis of supply. Supply refers to
that quantity of a product or service that a producer is willing to offer in the market for sale at a
specific price (Sawyer, 2018). Law of supply also works in ceteris paribus condition like law of
demand but unlike law of demand, has a positive relationship with price i.e. with an increase in
price of the product, quantity supply also increases because producers are more willing to supply
at increased prices. Therefore, supply curve shows a positive relationship. Just like demand
curve, supply curve is also a graphical representation of supply schedule. Any change in price of
the product result in movement of curve along the line and change in quantity supplied because
of any other determinant than price, causes a shift in the supply curve, just along the lines of
demand curve. Few possible reasons for shift in supply curve are:
Changes in input prices – Final price of a product is impacted by the changes in inputs’
prices. For example, to make a vanilla ice cream, a producer needs vanilla beans, cream,
sugar, etc. Suppose the price of cream increases, it makes production of ice-cream
costlier and would result in less margin for producer, if they sell it on same price. This
will make supplier less willing to supply at the same price and the supply curve will see
leftward shift.
Changes in technology – Technology in economics means any technique that can add
value to the product (Ermisch, 2016). Better technology reduces cost of production,
making sellers’ margin higher and when a seller gets to earn a better mark up at same
price, they are willing to supply more, shifting supply curve to the right.
6
⊘ This is a preview!⊘
Do you want full access?
Subscribe today to unlock all pages.
Trusted by 1+ million students worldwide
Changes in expectations – This works same like demand determinant. If supplier has an
expectation that prices are going to rise in future, they might decrease the supply in hope
to sell at higher prices in future and vice versa. Supply curves shifts accordingly.
Equilibrium analysis
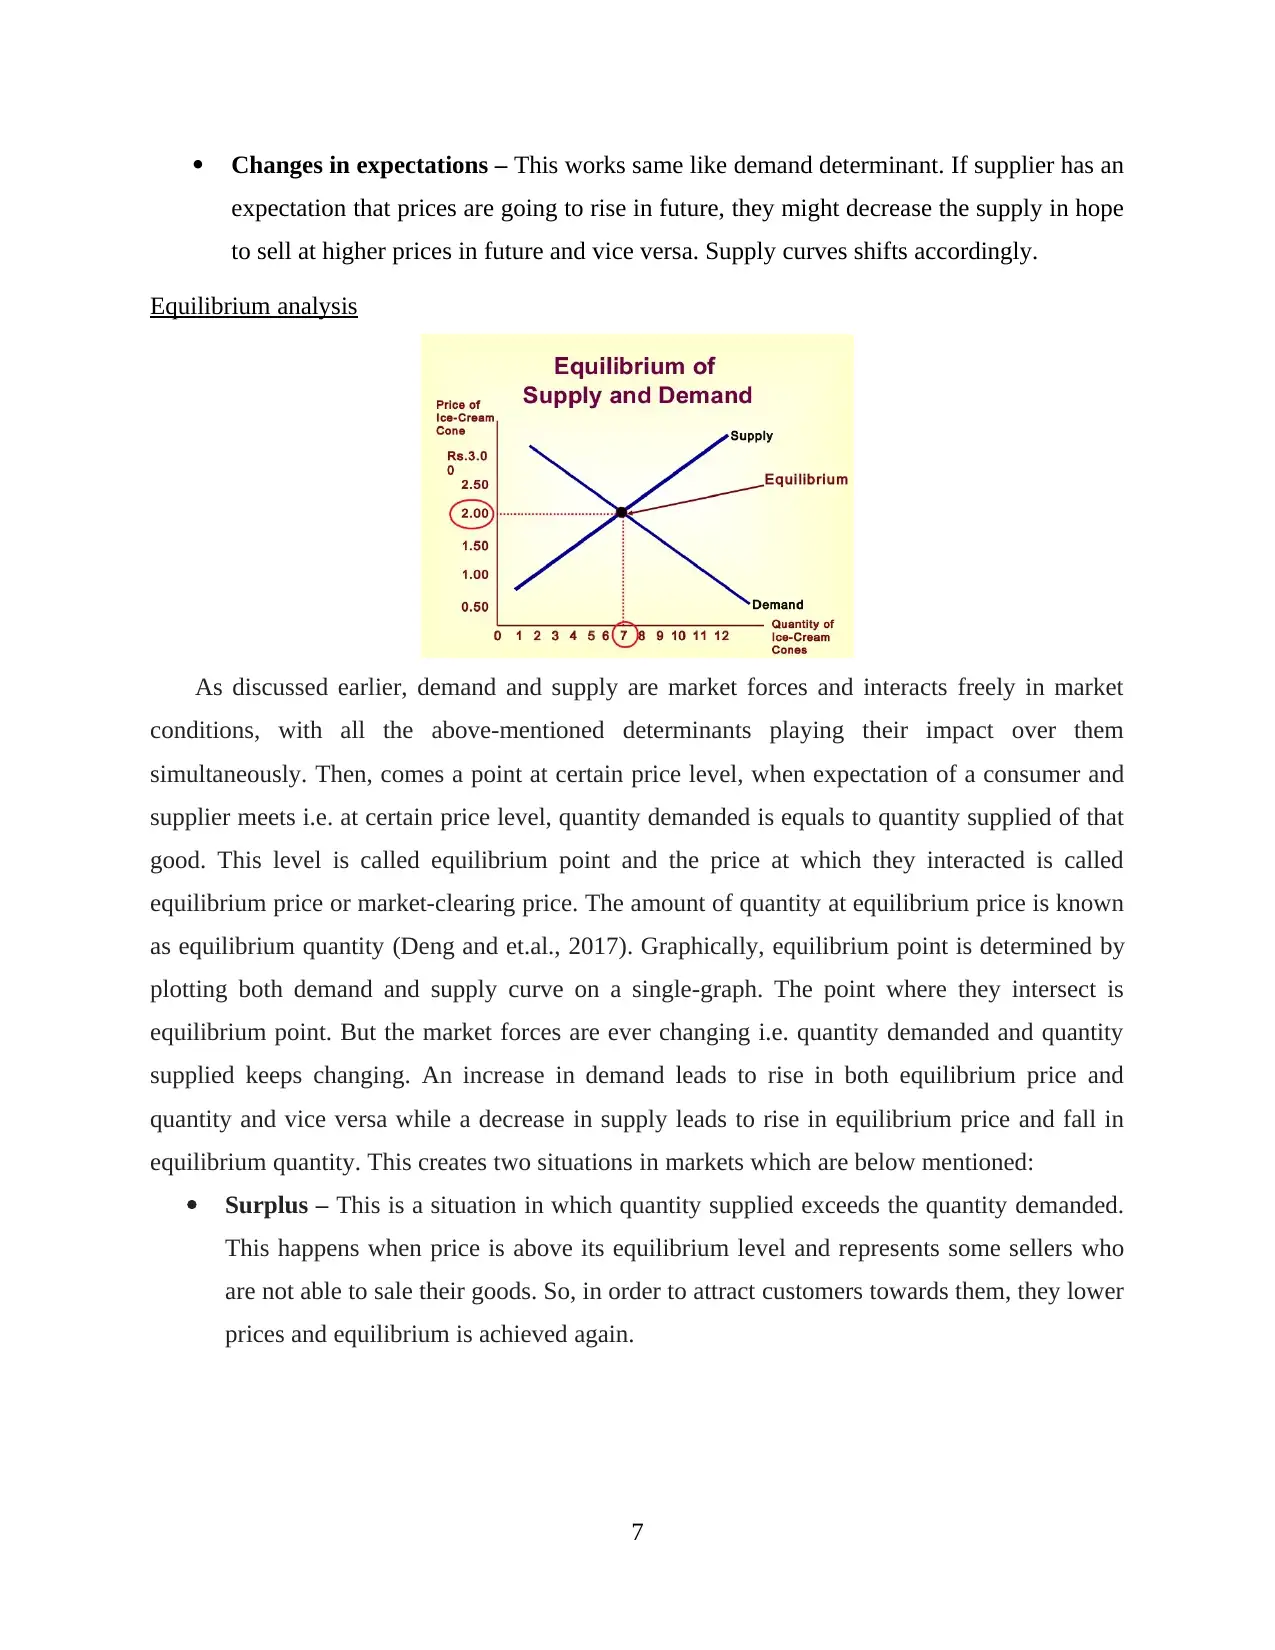
As discussed earlier, demand and supply are market forces and interacts freely in market
conditions, with all the above-mentioned determinants playing their impact over them
simultaneously. Then, comes a point at certain price level, when expectation of a consumer and
supplier meets i.e. at certain price level, quantity demanded is equals to quantity supplied of that
good. This level is called equilibrium point and the price at which they interacted is called
equilibrium price or market-clearing price. The amount of quantity at equilibrium price is known
as equilibrium quantity (Deng and et.al., 2017). Graphically, equilibrium point is determined by
plotting both demand and supply curve on a single-graph. The point where they intersect is
equilibrium point. But the market forces are ever changing i.e. quantity demanded and quantity
supplied keeps changing. An increase in demand leads to rise in both equilibrium price and
quantity and vice versa while a decrease in supply leads to rise in equilibrium price and fall in
equilibrium quantity. This creates two situations in markets which are below mentioned:
Surplus – This is a situation in which quantity supplied exceeds the quantity demanded.
This happens when price is above its equilibrium level and represents some sellers who
are not able to sale their goods. So, in order to attract customers towards them, they lower
prices and equilibrium is achieved again.
7
expectation that prices are going to rise in future, they might decrease the supply in hope
to sell at higher prices in future and vice versa. Supply curves shifts accordingly.
Equilibrium analysis
As discussed earlier, demand and supply are market forces and interacts freely in market
conditions, with all the above-mentioned determinants playing their impact over them
simultaneously. Then, comes a point at certain price level, when expectation of a consumer and
supplier meets i.e. at certain price level, quantity demanded is equals to quantity supplied of that
good. This level is called equilibrium point and the price at which they interacted is called
equilibrium price or market-clearing price. The amount of quantity at equilibrium price is known
as equilibrium quantity (Deng and et.al., 2017). Graphically, equilibrium point is determined by
plotting both demand and supply curve on a single-graph. The point where they intersect is
equilibrium point. But the market forces are ever changing i.e. quantity demanded and quantity
supplied keeps changing. An increase in demand leads to rise in both equilibrium price and
quantity and vice versa while a decrease in supply leads to rise in equilibrium price and fall in
equilibrium quantity. This creates two situations in markets which are below mentioned:
Surplus – This is a situation in which quantity supplied exceeds the quantity demanded.
This happens when price is above its equilibrium level and represents some sellers who
are not able to sale their goods. So, in order to attract customers towards them, they lower
prices and equilibrium is achieved again.
7
Paraphrase This Document
Need a fresh take? Get an instant paraphrase of this document with our AI Paraphraser
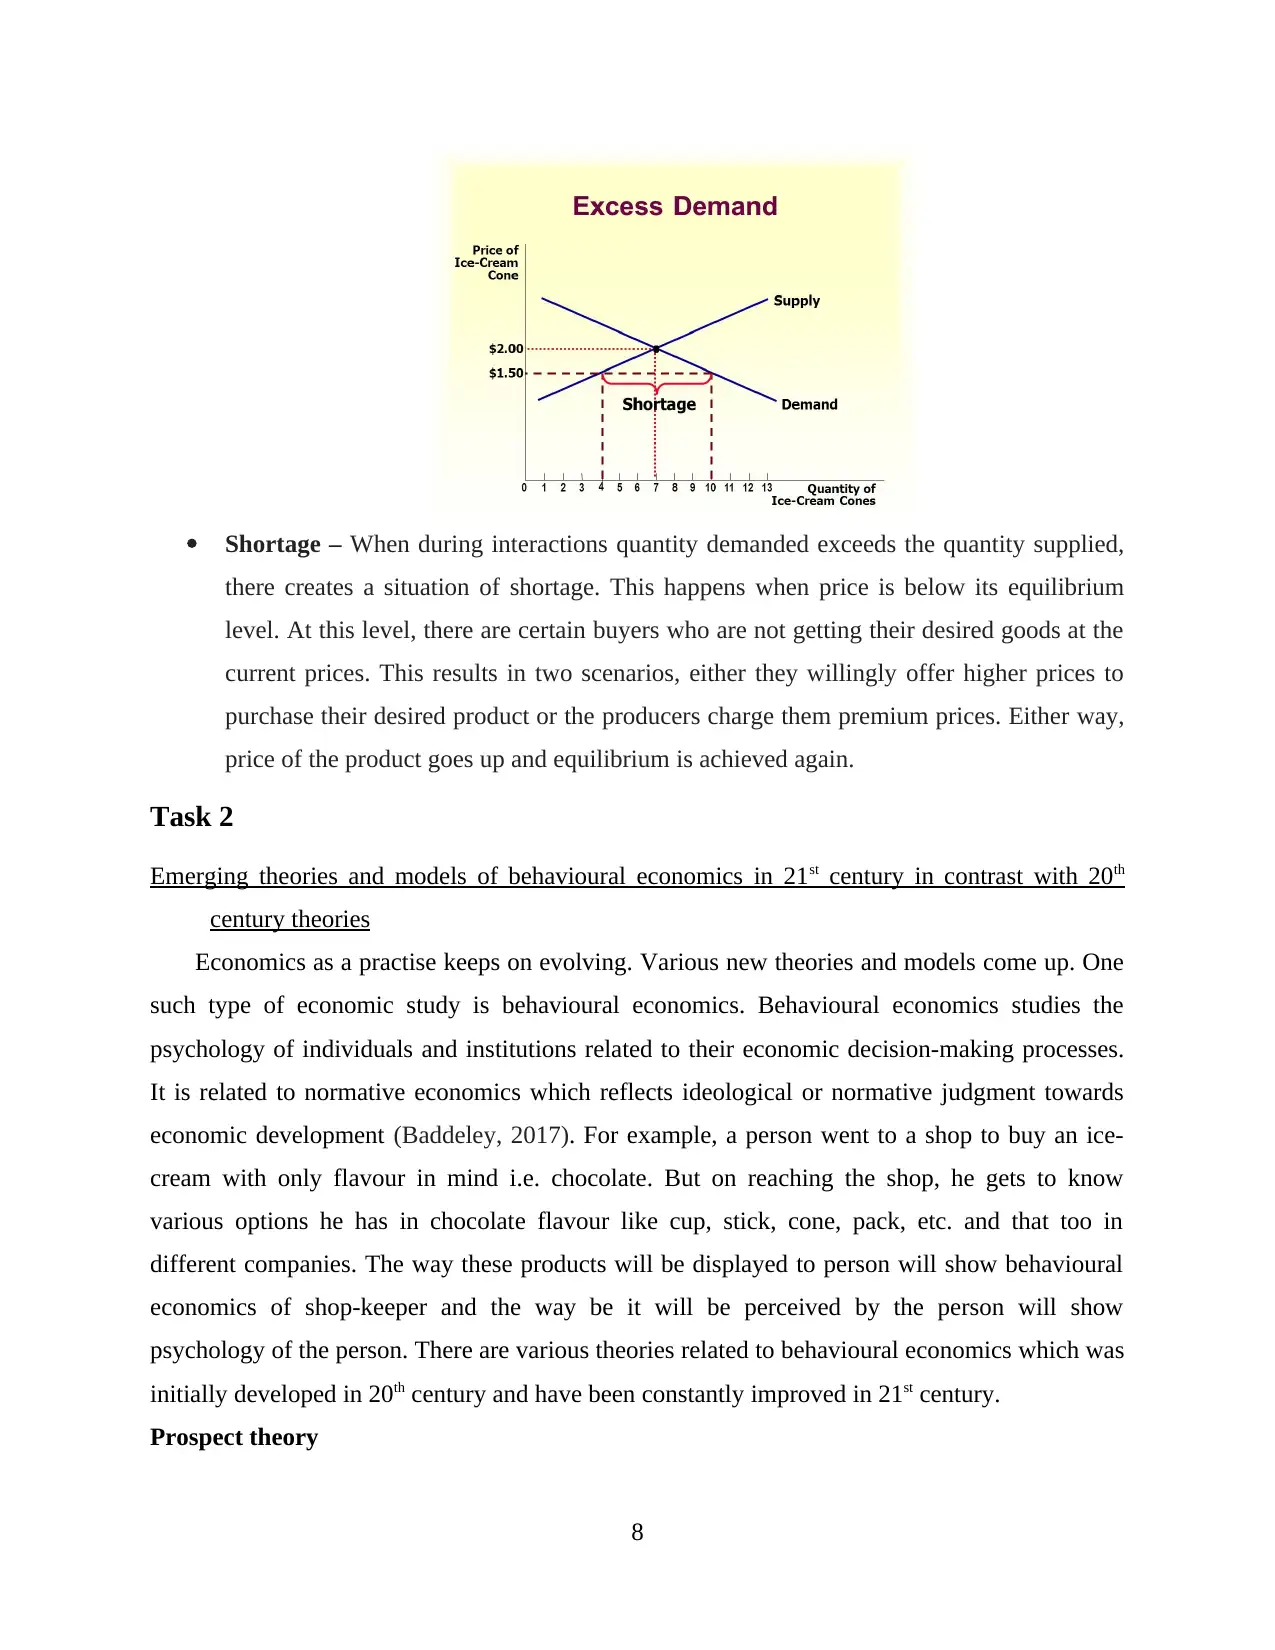
Shortage – When during interactions quantity demanded exceeds the quantity supplied,
there creates a situation of shortage. This happens when price is below its equilibrium
level. At this level, there are certain buyers who are not getting their desired goods at the
current prices. This results in two scenarios, either they willingly offer higher prices to
purchase their desired product or the producers charge them premium prices. Either way,
price of the product goes up and equilibrium is achieved again.
Task 2
Emerging theories and models of behavioural economics in 21st century in contrast with 20th
century theories
Economics as a practise keeps on evolving. Various new theories and models come up. One
such type of economic study is behavioural economics. Behavioural economics studies the
psychology of individuals and institutions related to their economic decision-making processes.
It is related to normative economics which reflects ideological or normative judgment towards
economic development (Baddeley, 2017). For example, a person went to a shop to buy an ice-
cream with only flavour in mind i.e. chocolate. But on reaching the shop, he gets to know
various options he has in chocolate flavour like cup, stick, cone, pack, etc. and that too in
different companies. The way these products will be displayed to person will show behavioural
economics of shop-keeper and the way be it will be perceived by the person will show
psychology of the person. There are various theories related to behavioural economics which was
initially developed in 20th century and have been constantly improved in 21st century.
Prospect theory
8
Earlier economic theories were based on ideal world and assumed that consumers would
always make the optimal and rational decision as they have stable preferences and they engage in
maximising behaviour (Kao and Velupillai, 2015). Prospect theory was developed by Amos
Tversky and Daniel Kahneman. This theory opposes ideal theory to show that consumer
decisions are not always optimal. They are rather context-dependent i.e. their willingness to take
risks depends upon the choices framed in front of them for pain of giving something up is more
than pleasure derived from receiving it.
Bounded rationality
This concept was given by Herbert Simon who was of the view that decisions are not always
optimal or rational as human mind evolves relative to their environment (An Introduction to
Behavioural Economics, 2020) and has restrictions like limited knowledge and computational
capacities. This theory implicates that when people take shortcuts in decision-making, they often
take suboptimal decision-making (Mallard, 2015). Behavioural economists in 21st century tried
to cover this decision shortcut like ideas from Cass Sunstein and Richard Thaler’s Nudge. But
Simon’s ideas were carried forward by Gerd Gigerenzer in his work on heuristics proposed that
rationality of human mind depends upon their environment and people are ecologically rational
when they make best possible use of their limited information-processing abilities.
Nudge theory
This theory was put forward by Cass Sunstein and Richard Thaler. According to it, a
nudge is any factor that alters behaviour of the people in a predictable way without forbidding
any alternative available or changing their economic incentives. Nudges are not mandate and the
intervention must be easy and cheap to avoid. It is a noteworthy point for businesses that most
frequently used nudge can be setting of defaults i.e. setting up of pre-set course of action that
makes the decision for consumers in the cases where nothing special or customised is specified
by the decision-maker. This type of nudge can work successfully for businesses in case of those
consumers who have a tendency for inaction and stick with same choice for years. Such nudges
are not only cost-effective but effective for whole business.
Other than theories, there are various economic concepts related to behavioural
economics as well, which are below mentioned:
Mental Accounting
9
⊘ This is a preview!⊘
Do you want full access?
Subscribe today to unlock all pages.
Trusted by 1+ million students worldwide
This concept was developed by Richard Thaler. He believed that value is considered by
people in relative terms rather than absolute terms. This theory suggests to create a behavioural
bias that one must bifurcate money into varied categories which are known as mental accounts
on the basis of source of money or intention to put to use that money (Hursh and Roma, 2016).
So, in other words, this concept is concerned with allocation of resources for various specific
purposes. One important term which is underlying this theory is fungibility. It is referred to the
fact that money can be used interchangeably and has no specific labels. In various domains of
applied behavioural science, consumers’ natural tendency to work with mental accounts can be
seen reflected such as in financial services industry. For example, banks offer varied accounts
with different names and saving goals, just to gauge varied customers with varied mental
accounting.
Search Heuristics
Heuristics are cognitive shortcuts or thumb rules that helps in simplifying decision-making
especially when conditions are uncertain. They can be taken as a process that aims to substitute
difficult question with an easier one and can lead to disagreements between biasness and
rationality. A decision is needed to be taken from available alternatives. Search heuristics is that
concept of behavioural economics that assesses the psychology behind choosing a particular
option from the alternatives available (Heidl, 2016). This concept proposes that to gain
information about all options available is a costly process but is necessary to maximise the utility
that one might derive because of the information they searched. There are three primary search
heuristics – satisficing, directed cognition and elimination by aspects. Satisficing is the concept
which says that once the minimum criteria for the beginning search has been met, one should
stop searching. Directed cognition asks to treat each search opportunity as the last research
information. Elimination by aspects asks to set quality standards first then begin search to get
more refined research result.
Conclusion
From the above report, it can be concluded that it is very important for a business to
understand the dynamics of market forces of demand and supply and the impact they have in
relation with price over the choices of a consumer. Various amounts of quantity demanded and
supplied at various price level can be plotted on a graph to find out their curve. When they are
simultaneously put together on a same graph, equilibrium level of quantity and price can be
10
Paraphrase This Document
Need a fresh take? Get an instant paraphrase of this document with our AI Paraphraser
determined. Various factors that affect consumer decision-making psychologically are studied in
behavioural economics and various theoretical development in it over two centuries are
discussed in it.
11
behavioural economics and various theoretical development in it over two centuries are
discussed in it.
11
References
Books and Journal
Baddeley, M., 2017. Behavioural economics: a very short introduction (Vol. 505). Oxford
University Press.
Browning, E.K. and Zupan, M.A., 2020. Microeconomics: Theory and applications. John Wiley
& Sons.
Deng, J. and et.al., 2017. A novel power market clearing model based on the equilibrium
principle in microeconomics. Journal of Cleaner Production. 142. pp.1021-1027.
Ermisch, J.F., 2016. An economic analysis of the family. Princeton University Press.
Heidl, S., 2016. Philosophical problems of behavioural economics. Routledge.
Hursh, S.R. and Roma, P.G., 2016. Behavioral economics and the analysis of consumption and
choice. Managerial and Decision Economics, 37(4-5), pp.224-238.
Kao, Y.F. and Velupillai, K.V., 2015. Behavioural economics: Classical and modern. The
European Journal of the History of Economic Thought, 22(2), pp.236-271.
Mallard, G., 2015. Bounded rationality and behavioural economics. Routledge.
Mirica, C.O., 2019. The behavioral economics of decision making: Explaining consumer choice
in terms of neural events. Economics, Management, and Financial Markets. 14(1).
pp.16-22.
Pindyck, R.S. and Rubinfeld, D.L., 2018. Microeconomics.
Sawyer, M., 2018. Microeconomics, Mesoeconomics and Macroeconomics. In Alternative
Approaches in Macroeconomics (pp. 105-126). Palgrave Macmillan, Cham.
Whitehead, J., 2020. Microeconomics: a global text. Routledge.
Yang, X. and Ng, Y.K., 2015. Specialization and economic organization: A new classical
microeconomic framework. Elsevier.
Online
An Introduction to Behavioural Economics. 2020. [Online]. Available through:<
https://www.behavioraleconomics.com/resources/introduction-behavioral-economics/>
12
⊘ This is a preview!⊘
Do you want full access?
Subscribe today to unlock all pages.
Trusted by 1+ million students worldwide
1 out of 12
Related Documents


Your All-in-One AI-Powered Toolkit for Academic Success.
+13062052269
info@desklib.com
Available 24*7 on WhatsApp / Email
![[object Object]](/_next/static/media/star-bottom.7253800d.svg)
Unlock your academic potential
Copyright © 2020–2026 A2Z Services. All Rights Reserved. Developed and managed by ZUCOL.