Contemporary Economic Analysis: Demand, Supply and Economic Theories
VerifiedAdded on 2023/01/16
|14
|3329
|94
Report
AI Summary
This report delves into the core principles of contemporary economic analysis, focusing on the laws of demand and supply, movements and shifts in the respective curves, and a comparison of various economic theories. The analysis begins with an examination of the law of demand, illustrating its relationship with price changes and the concept of diminishing marginal utility, using Morrisons as a practical example. It then explores the movement along the demand curve and shifts in the demand curve caused by factors like income, the price of related goods, and taste preferences. The report proceeds to analyze the law of supply, highlighting the positive relationship between price and quantity supplied, again using Morrisons to illustrate the concepts. It further examines the movement along the supply curve and shifts in the supply curve influenced by input prices, the number of sellers, technology, and other factors. Finally, the report compares and contrasts different economic theories, including Keynesian theory, monetarism, and classical economics, providing a comprehensive overview of their core tenets and applicability.
CONTEMPORARY
ECONOMIC ANALYSIS
ECONOMIC ANALYSIS
Paraphrase This Document
Need a fresh take? Get an instant paraphrase of this document with our AI Paraphraser
Table of Contents
INTRODUCTION...........................................................................................................................3
MAIN BODY...................................................................................................................................3
TASK 1............................................................................................................................................3
Law of Demand, Movement and change in the demand curve....................................................3
Law of Supply, Movement and Change in Supply Curve...........................................................6
TASK 2..........................................................................................................................................10
Comparison and contrast of different theories...........................................................................10
CONCLUSION..............................................................................................................................11
REFERENCES................................................................................................................................1
INTRODUCTION
Economics is that branch or field where the concept of the productions, its consumption
and its distribution in the form of wealth of an economy is identified and analysed. Economics
can be studied at an individual or micro level and at the national or macro level (Cerreia and
et.al., 2016). In the current report, a study will be undertaken on demand and supply, two of the
major forces of market and the different concepts related to them will be identified. This will be
done in context of Morrisons which is a major retail and grocery brand in UK owning a chain of
stores. The report will also identify the different economic theories that are prevalent and
compare these theories thus summing up the key points.
MAIN BODY
TASK 1
Law of Demand, Movement and change in the demand curve
The law of demand can be defined as the graph or schedule depicting the relationship
between the price of the goods and the quantity demanded of that good in a particular market. It
shows that when the price of a particular product increases, the demand for that product
automatically decreases and vice-e-versa when the price decreases. This can be automatically
inferred from the negative relationship that exist between the prices of goods at Morrisons, and
the associated demand. When the prices of the products at Morrisons increase, the demand for
them automatically decrease and the consumers tend to shift to other brands. This negative
relationship exists because of the concept of diminishing marginal utility (Robinson, 2017). This
concept states that the first priority of customers is to satisfy those requirements that are more
urgent and necessary. This is followed by those requirements that are of lower value.
The demand curve which depicts the total demand of all the consumers in the market is
consistently downward sloping and this exists due t the negative relationship that is shared
between the price and demand factor.
⊘ This is a preview!⊘
Do you want full access?
Subscribe today to unlock all pages.
Trusted by 1+ million students worldwide
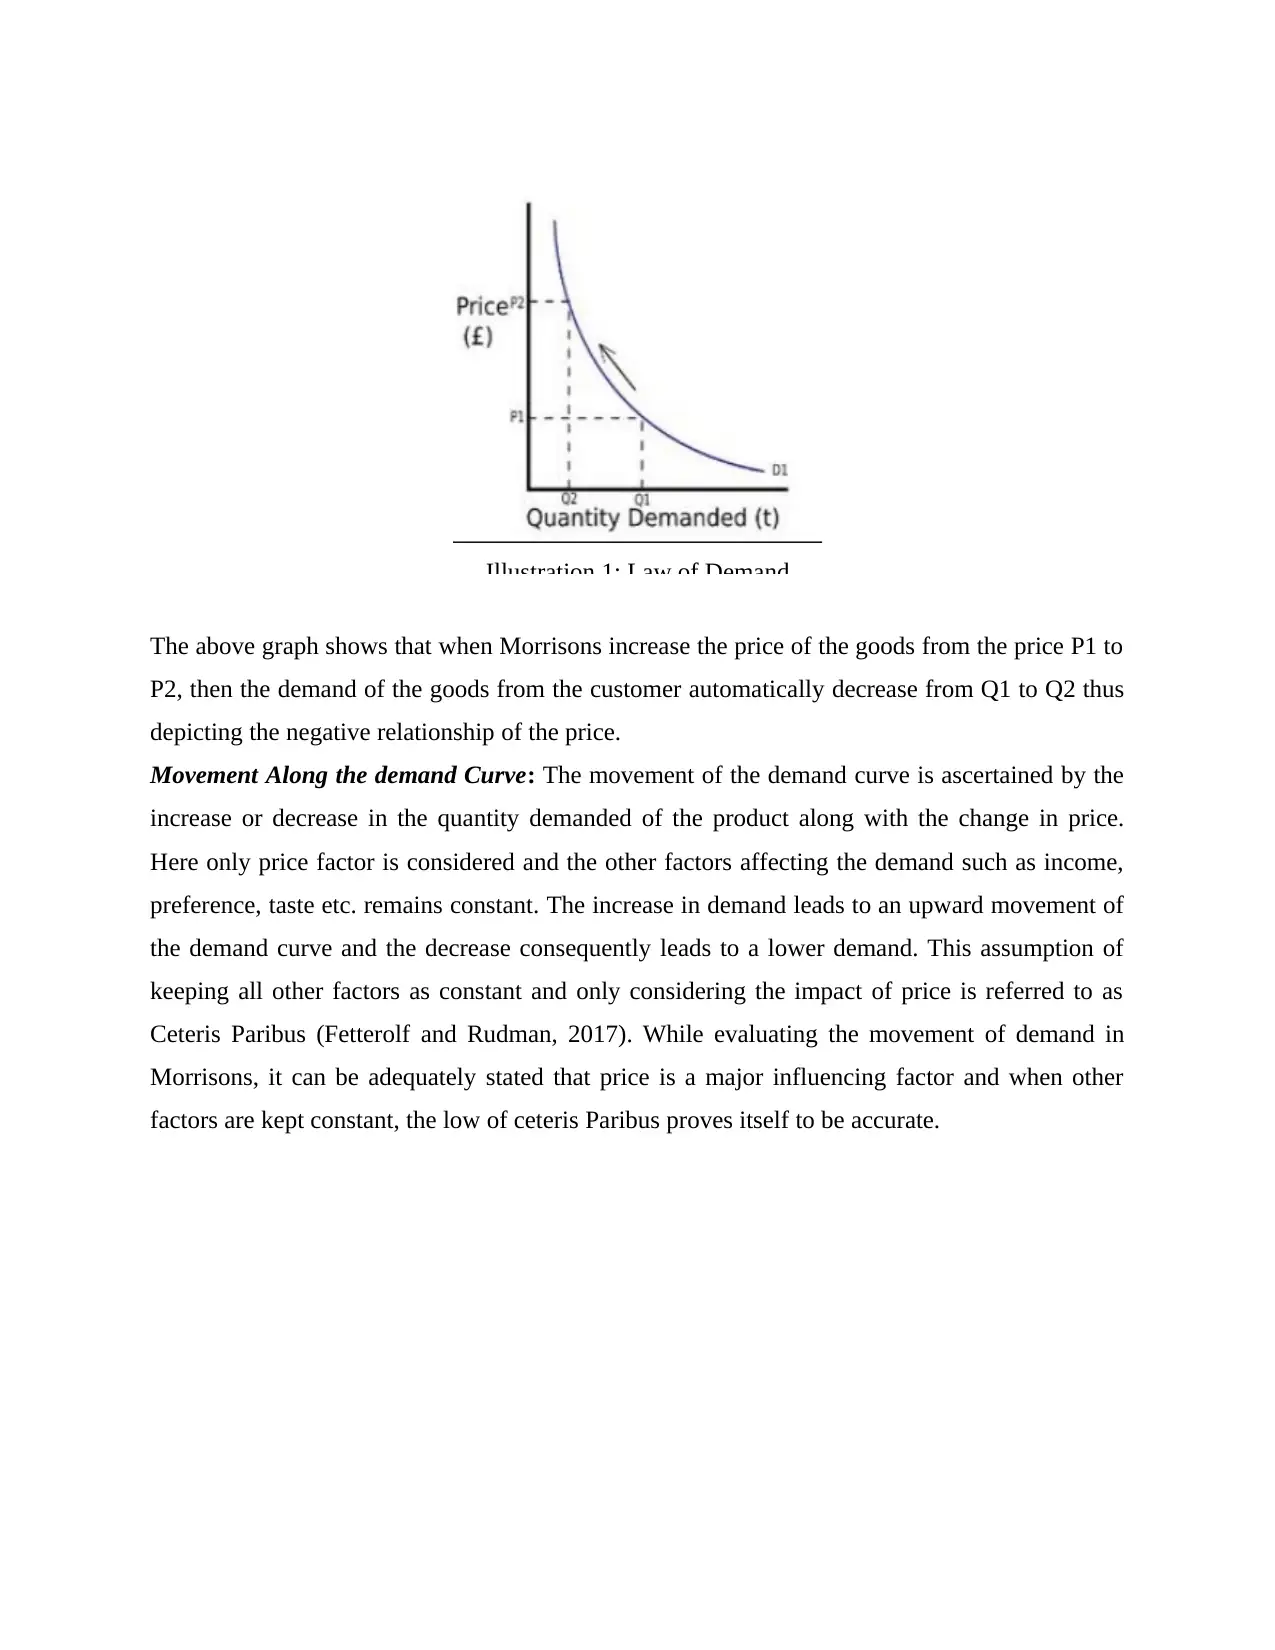
The above graph shows that when Morrisons increase the price of the goods from the price P1 to
P2, then the demand of the goods from the customer automatically decrease from Q1 to Q2 thus
depicting the negative relationship of the price.
Movement Along the demand Curve: The movement of the demand curve is ascertained by the
increase or decrease in the quantity demanded of the product along with the change in price.
Here only price factor is considered and the other factors affecting the demand such as income,
preference, taste etc. remains constant. The increase in demand leads to an upward movement of
the demand curve and the decrease consequently leads to a lower demand. This assumption of
keeping all other factors as constant and only considering the impact of price is referred to as
Ceteris Paribus (Fetterolf and Rudman, 2017). While evaluating the movement of demand in
Morrisons, it can be adequately stated that price is a major influencing factor and when other
factors are kept constant, the low of ceteris Paribus proves itself to be accurate.
Illustration 1: Law of Demand
Paraphrase This Document
Need a fresh take? Get an instant paraphrase of this document with our AI Paraphraser
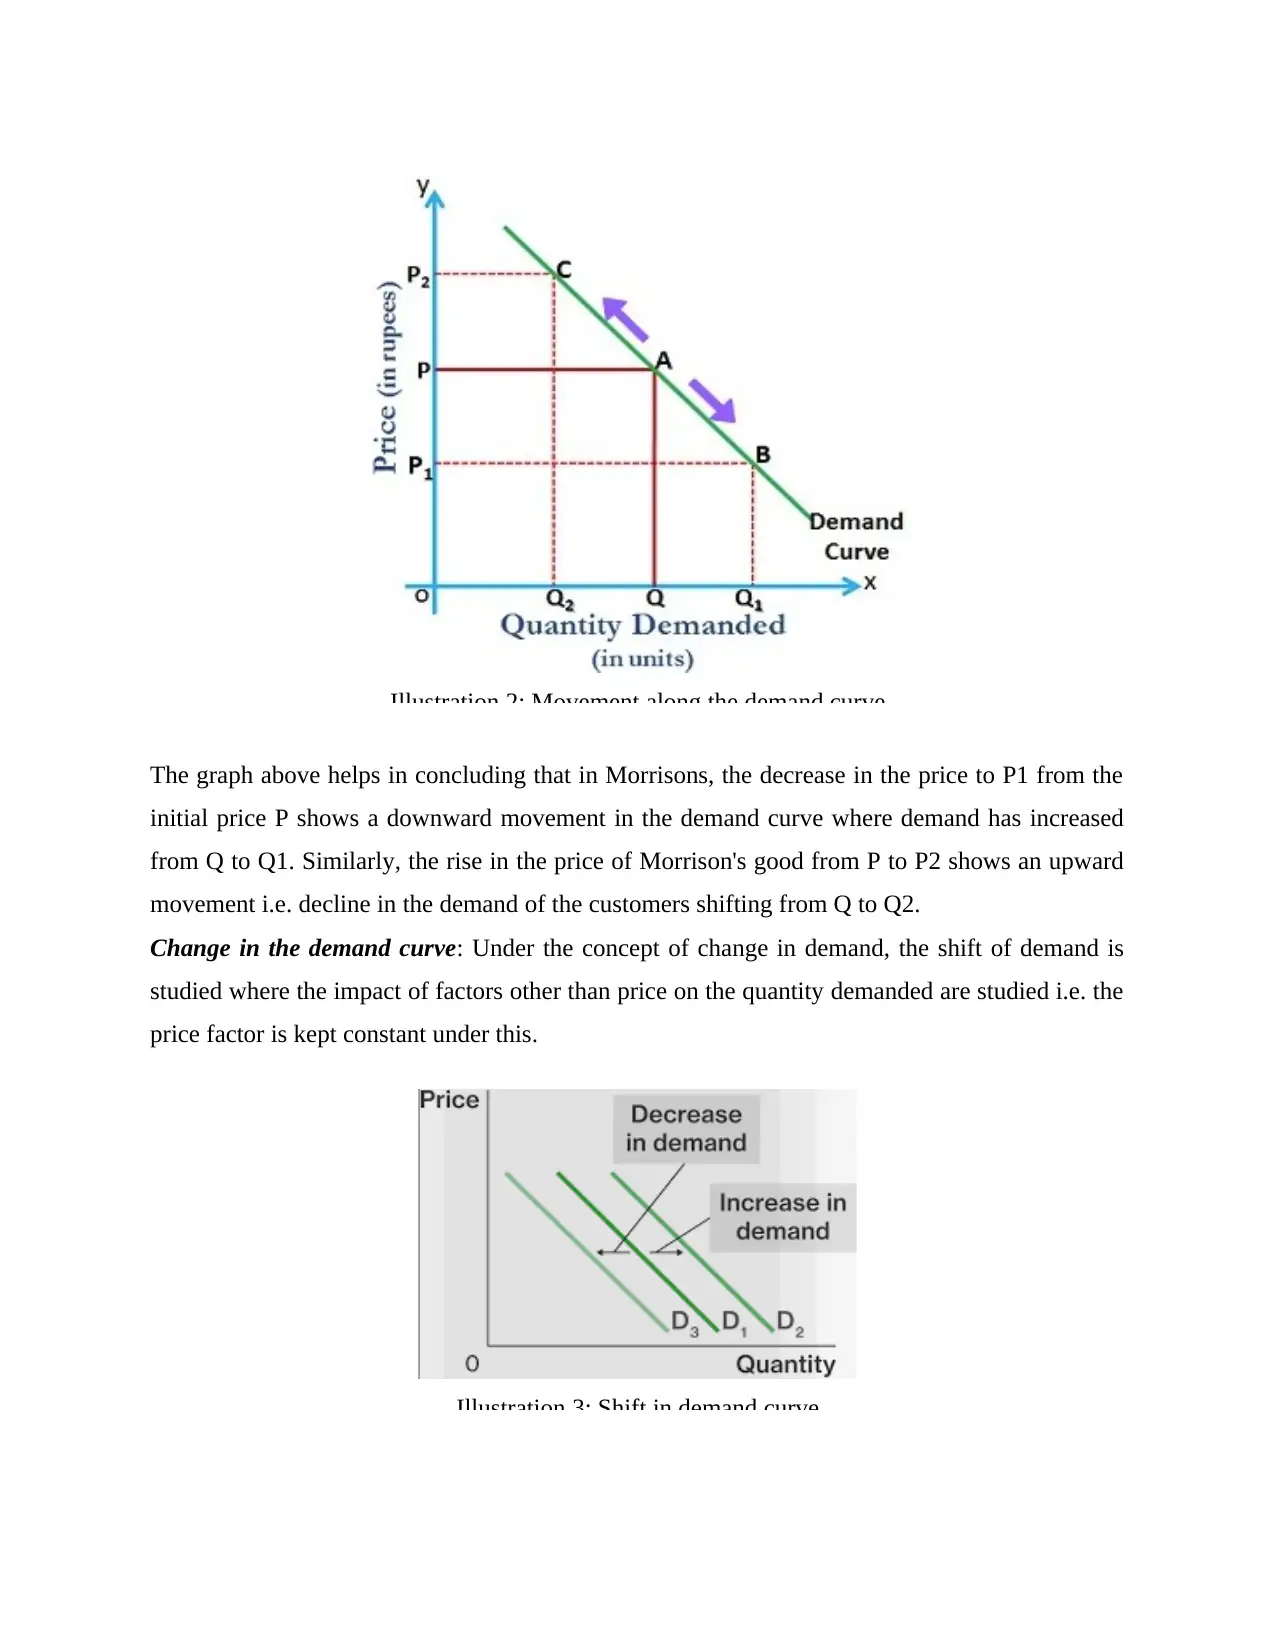
The graph above helps in concluding that in Morrisons, the decrease in the price to P1 from the
initial price P shows a downward movement in the demand curve where demand has increased
from Q to Q1. Similarly, the rise in the price of Morrison's good from P to P2 shows an upward
movement i.e. decline in the demand of the customers shifting from Q to Q2.
Change in the demand curve: Under the concept of change in demand, the shift of demand is
studied where the impact of factors other than price on the quantity demanded are studied i.e. the
price factor is kept constant under this.
Illustration 2: Movement along the demand curve
Illustration 3: Shift in demand curve
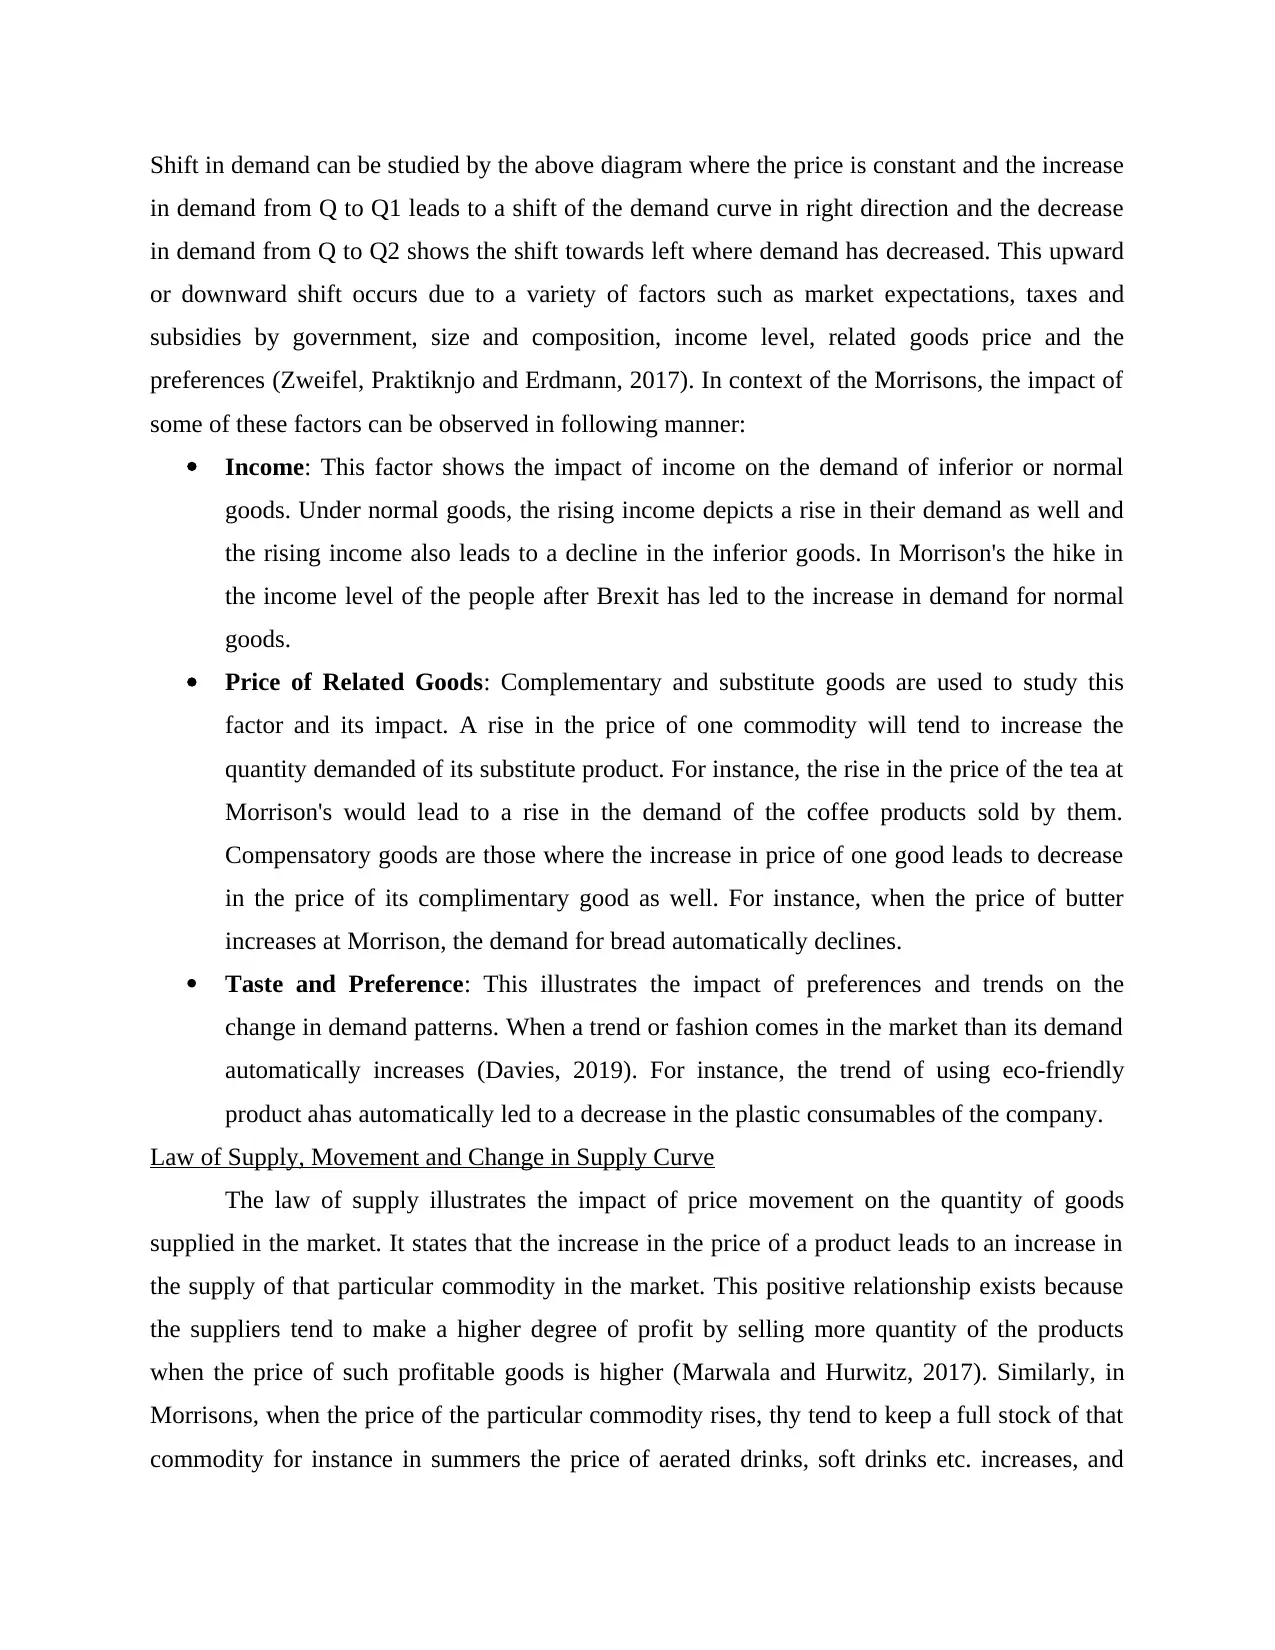
Shift in demand can be studied by the above diagram where the price is constant and the increase
in demand from Q to Q1 leads to a shift of the demand curve in right direction and the decrease
in demand from Q to Q2 shows the shift towards left where demand has decreased. This upward
or downward shift occurs due to a variety of factors such as market expectations, taxes and
subsidies by government, size and composition, income level, related goods price and the
preferences (Zweifel, Praktiknjo and Erdmann, 2017). In context of the Morrisons, the impact of
some of these factors can be observed in following manner:
Income: This factor shows the impact of income on the demand of inferior or normal
goods. Under normal goods, the rising income depicts a rise in their demand as well and
the rising income also leads to a decline in the inferior goods. In Morrison's the hike in
the income level of the people after Brexit has led to the increase in demand for normal
goods.
Price of Related Goods: Complementary and substitute goods are used to study this
factor and its impact. A rise in the price of one commodity will tend to increase the
quantity demanded of its substitute product. For instance, the rise in the price of the tea at
Morrison's would lead to a rise in the demand of the coffee products sold by them.
Compensatory goods are those where the increase in price of one good leads to decrease
in the price of its complimentary good as well. For instance, when the price of butter
increases at Morrison, the demand for bread automatically declines.
Taste and Preference: This illustrates the impact of preferences and trends on the
change in demand patterns. When a trend or fashion comes in the market than its demand
automatically increases (Davies, 2019). For instance, the trend of using eco-friendly
product ahas automatically led to a decrease in the plastic consumables of the company.
Law of Supply, Movement and Change in Supply Curve
The law of supply illustrates the impact of price movement on the quantity of goods
supplied in the market. It states that the increase in the price of a product leads to an increase in
the supply of that particular commodity in the market. This positive relationship exists because
the suppliers tend to make a higher degree of profit by selling more quantity of the products
when the price of such profitable goods is higher (Marwala and Hurwitz, 2017). Similarly, in
Morrisons, when the price of the particular commodity rises, thy tend to keep a full stock of that
commodity for instance in summers the price of aerated drinks, soft drinks etc. increases, and
⊘ This is a preview!⊘
Do you want full access?
Subscribe today to unlock all pages.
Trusted by 1+ million students worldwide
they too maintain full stocks in the company stores so that customer does not return empty-
handed and profit ration increases.
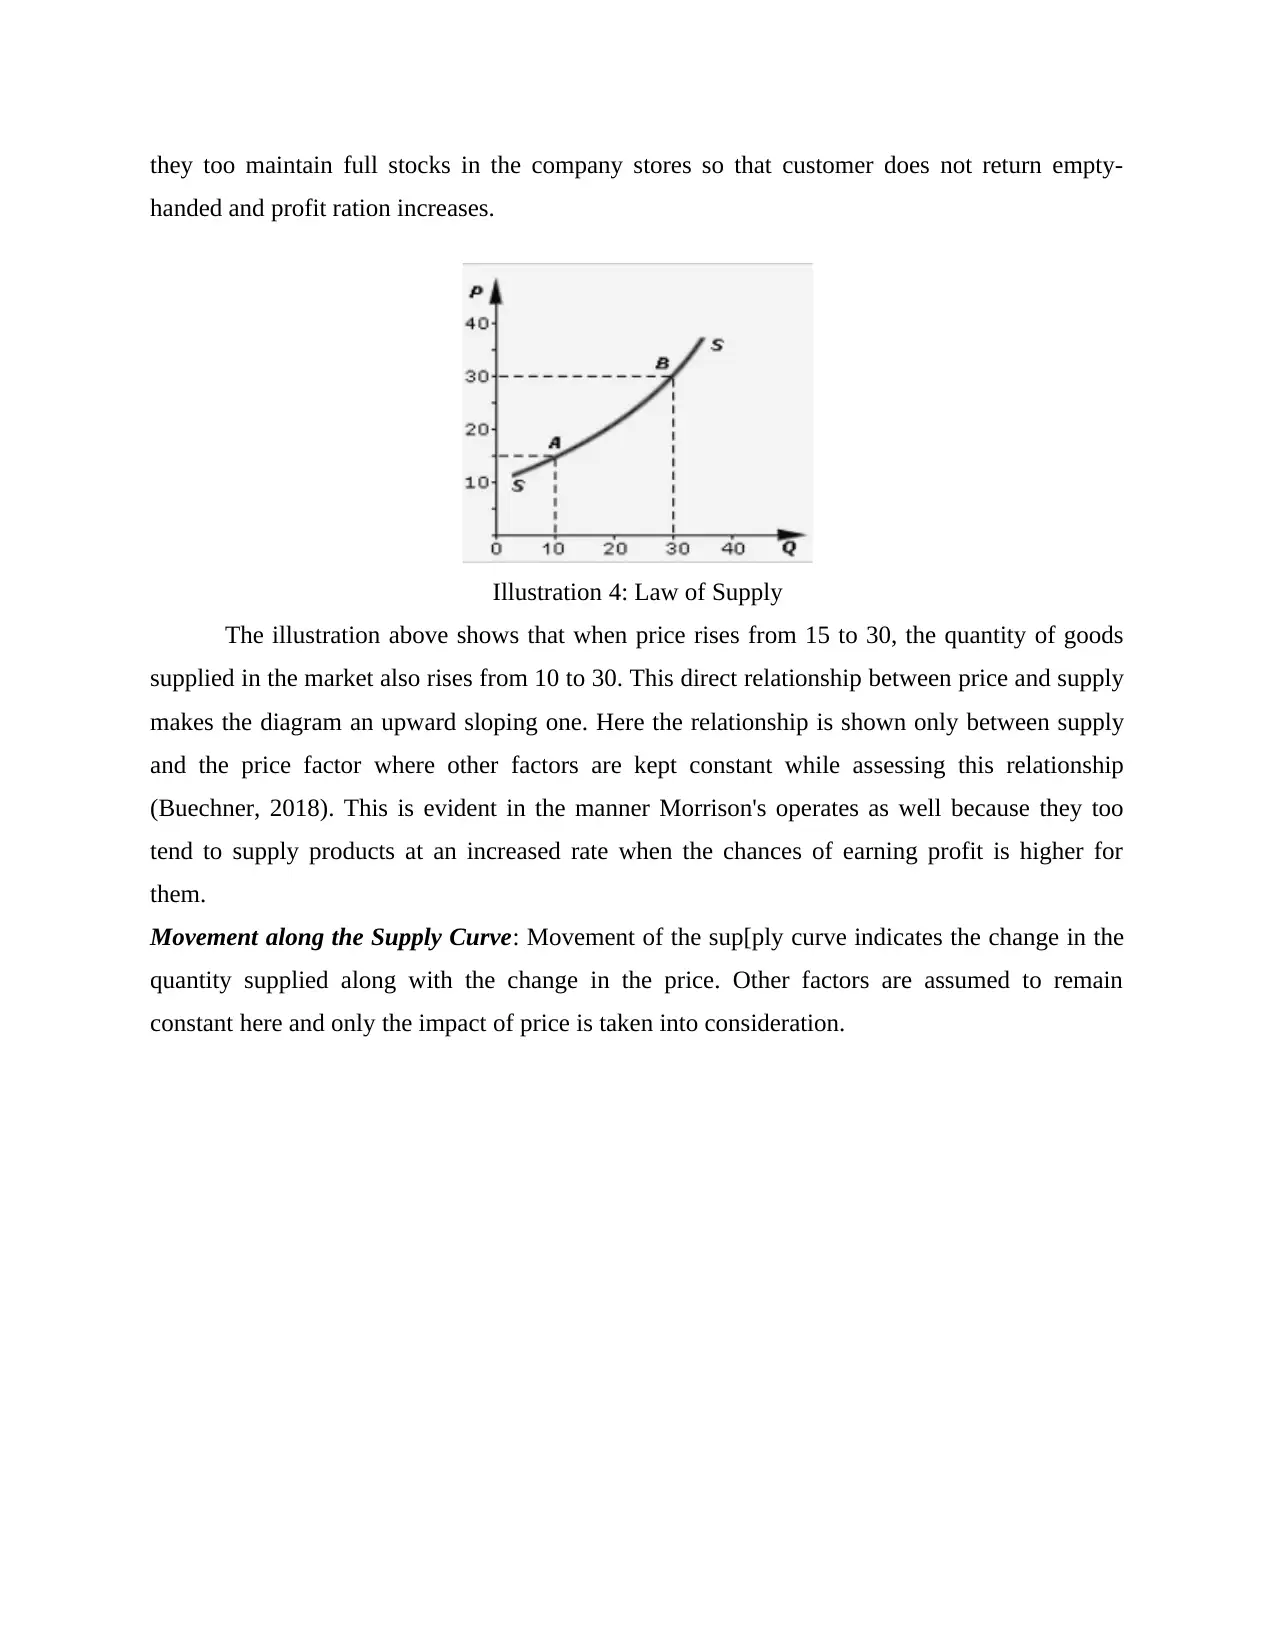
The illustration above shows that when price rises from 15 to 30, the quantity of goods
supplied in the market also rises from 10 to 30. This direct relationship between price and supply
makes the diagram an upward sloping one. Here the relationship is shown only between supply
and the price factor where other factors are kept constant while assessing this relationship
(Buechner, 2018). This is evident in the manner Morrison's operates as well because they too
tend to supply products at an increased rate when the chances of earning profit is higher for
them.
Movement along the Supply Curve: Movement of the sup[ply curve indicates the change in the
quantity supplied along with the change in the price. Other factors are assumed to remain
constant here and only the impact of price is taken into consideration.
Illustration 4: Law of Supply
handed and profit ration increases.
The illustration above shows that when price rises from 15 to 30, the quantity of goods
supplied in the market also rises from 10 to 30. This direct relationship between price and supply
makes the diagram an upward sloping one. Here the relationship is shown only between supply
and the price factor where other factors are kept constant while assessing this relationship
(Buechner, 2018). This is evident in the manner Morrison's operates as well because they too
tend to supply products at an increased rate when the chances of earning profit is higher for
them.
Movement along the Supply Curve: Movement of the sup[ply curve indicates the change in the
quantity supplied along with the change in the price. Other factors are assumed to remain
constant here and only the impact of price is taken into consideration.
Illustration 4: Law of Supply
Paraphrase This Document
Need a fresh take? Get an instant paraphrase of this document with our AI Paraphraser
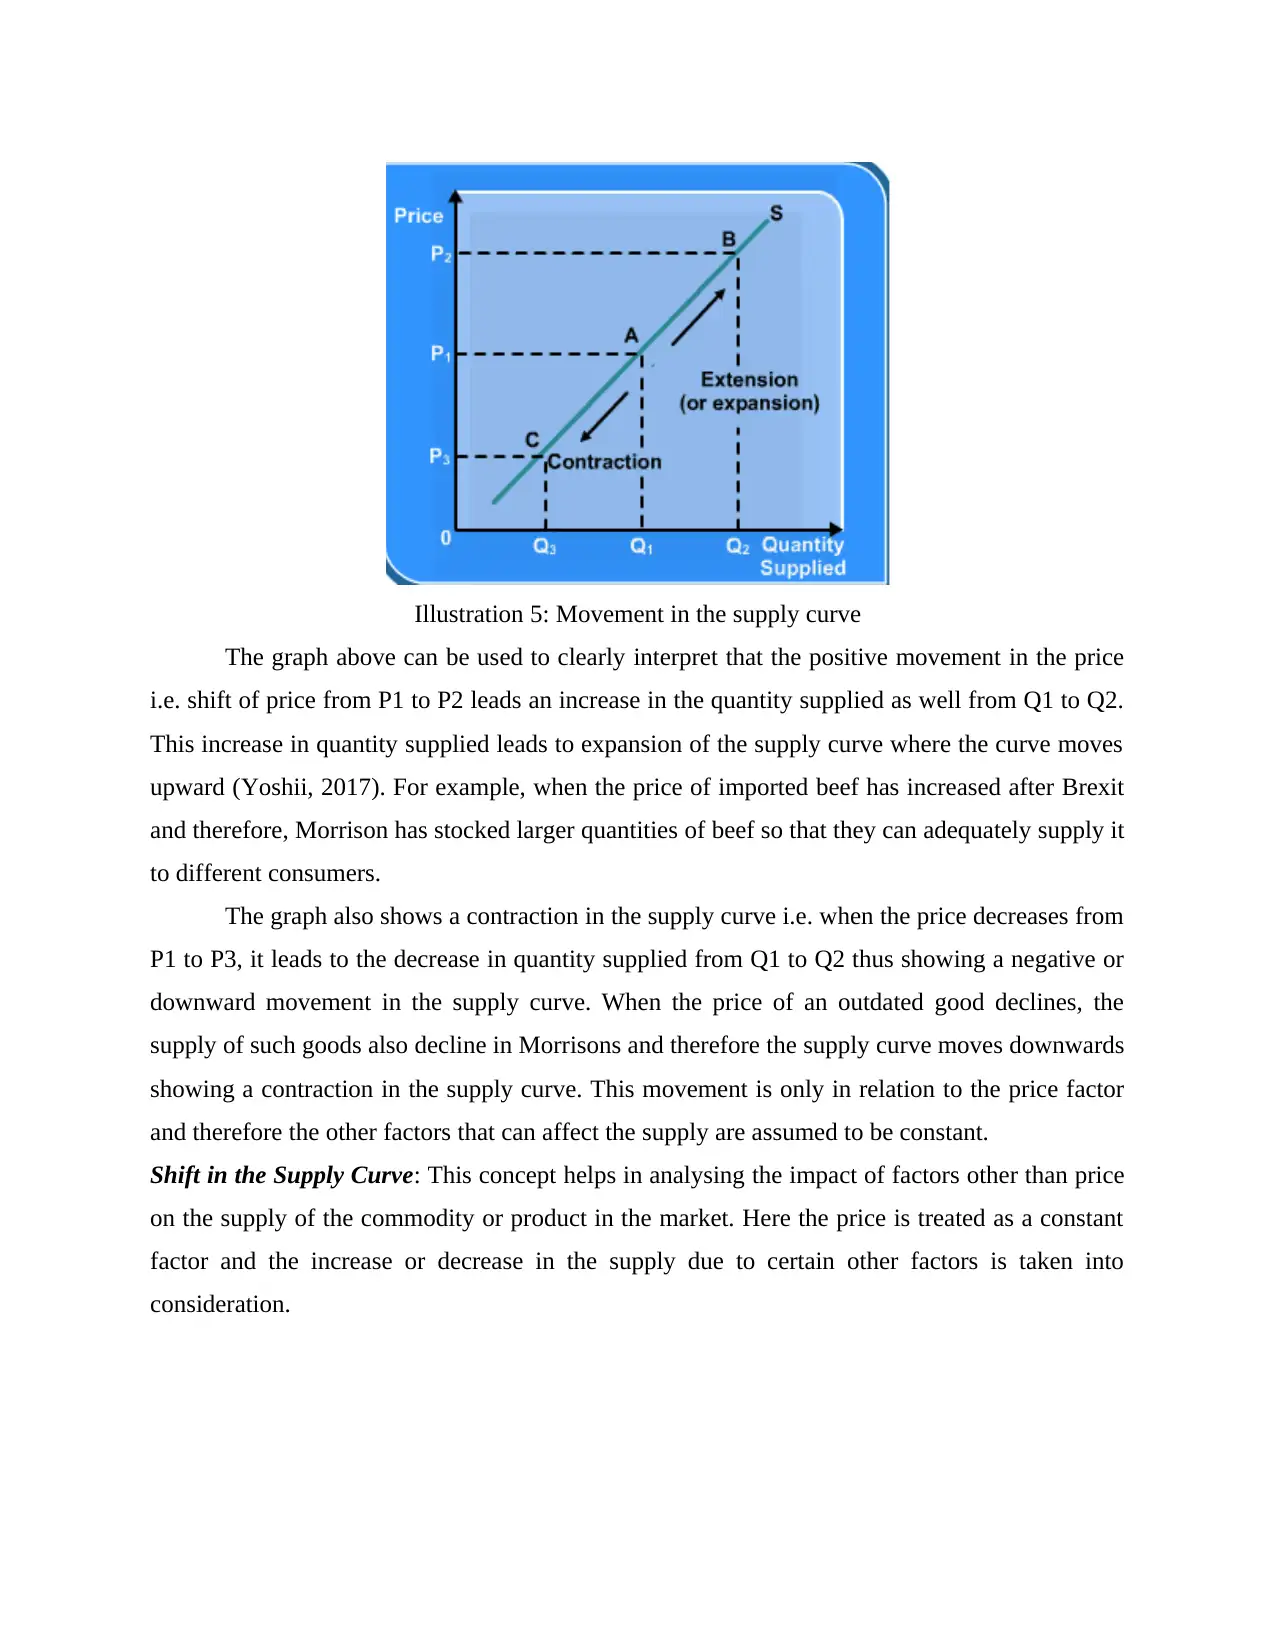
The graph above can be used to clearly interpret that the positive movement in the price
i.e. shift of price from P1 to P2 leads an increase in the quantity supplied as well from Q1 to Q2.
This increase in quantity supplied leads to expansion of the supply curve where the curve moves
upward (Yoshii, 2017). For example, when the price of imported beef has increased after Brexit
and therefore, Morrison has stocked larger quantities of beef so that they can adequately supply it
to different consumers.
The graph also shows a contraction in the supply curve i.e. when the price decreases from
P1 to P3, it leads to the decrease in quantity supplied from Q1 to Q2 thus showing a negative or
downward movement in the supply curve. When the price of an outdated good declines, the
supply of such goods also decline in Morrisons and therefore the supply curve moves downwards
showing a contraction in the supply curve. This movement is only in relation to the price factor
and therefore the other factors that can affect the supply are assumed to be constant.
Shift in the Supply Curve: This concept helps in analysing the impact of factors other than price
on the supply of the commodity or product in the market. Here the price is treated as a constant
factor and the increase or decrease in the supply due to certain other factors is taken into
consideration.
Illustration 5: Movement in the supply curve
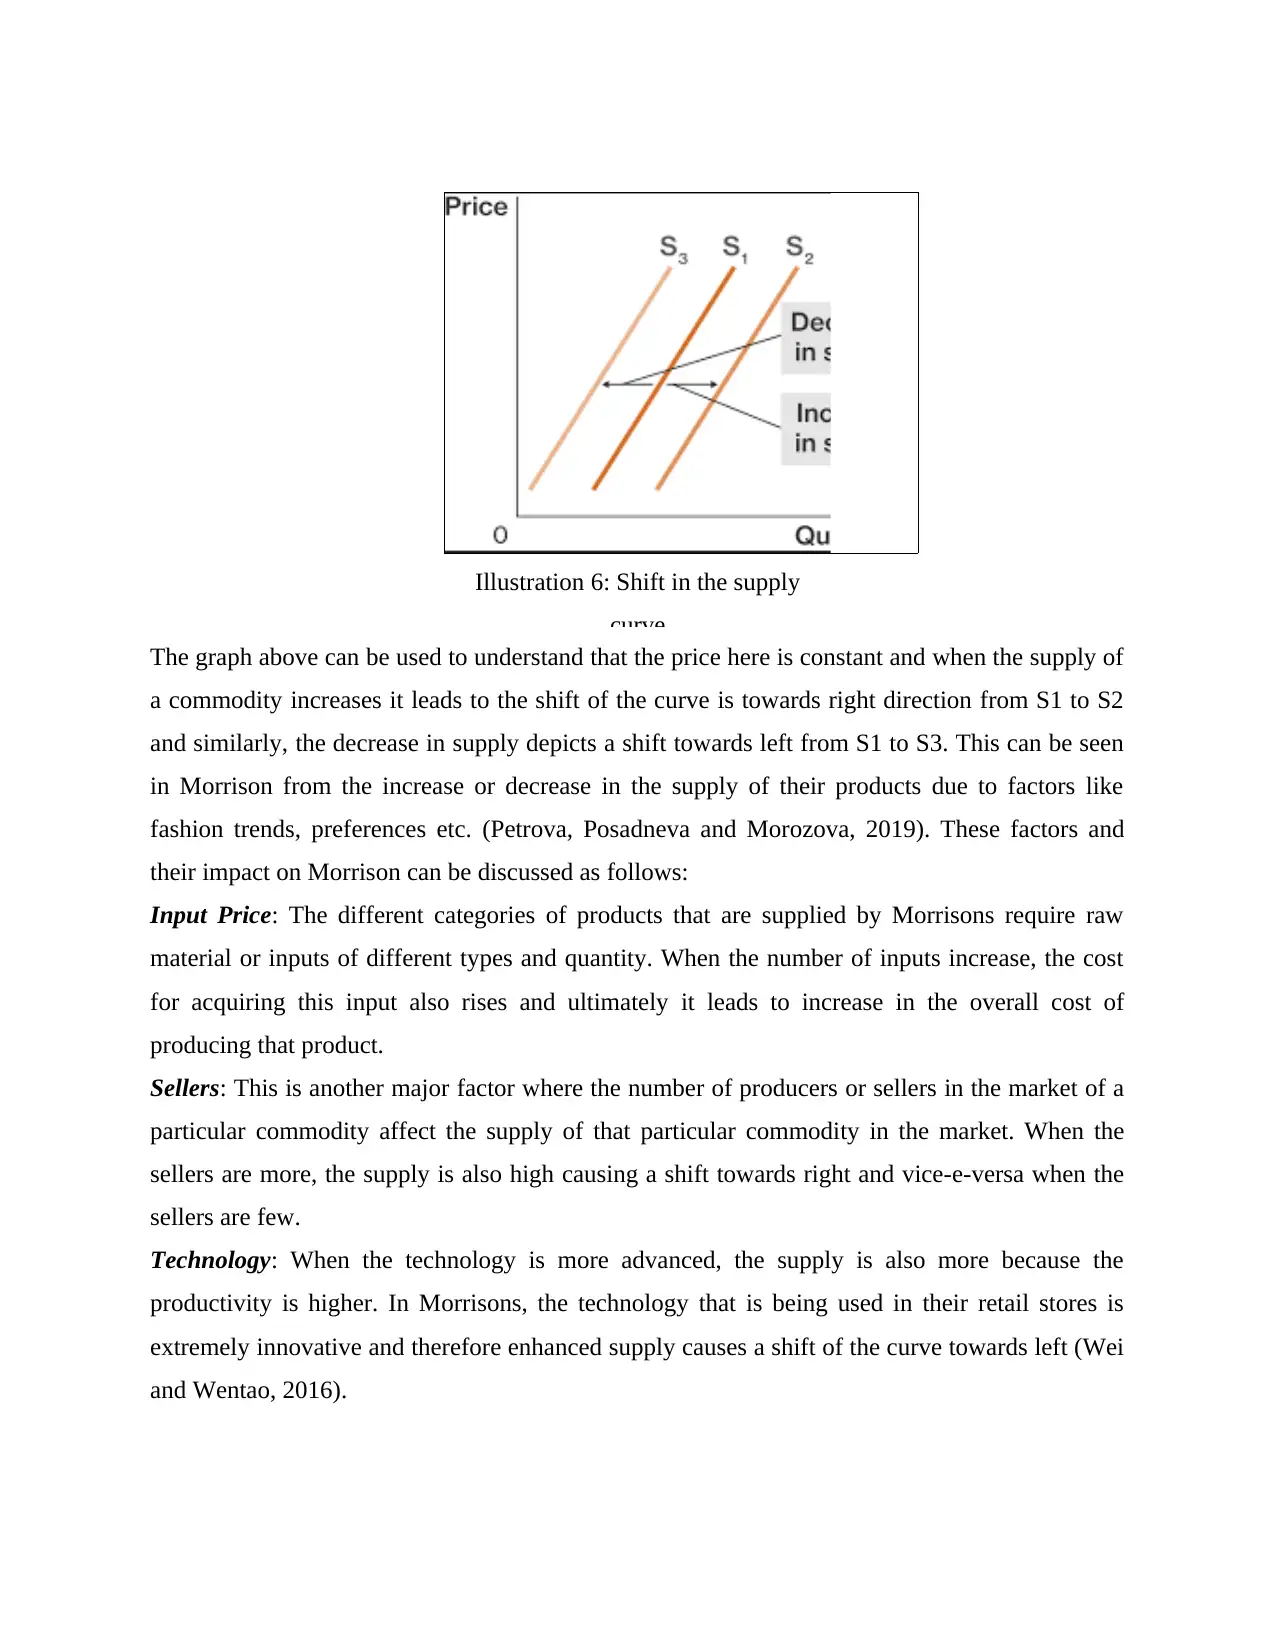
The graph above can be used to understand that the price here is constant and when the supply of
a commodity increases it leads to the shift of the curve is towards right direction from S1 to S2
and similarly, the decrease in supply depicts a shift towards left from S1 to S3. This can be seen
in Morrison from the increase or decrease in the supply of their products due to factors like
fashion trends, preferences etc. (Petrova, Posadneva and Morozova, 2019). These factors and
their impact on Morrison can be discussed as follows:
Input Price: The different categories of products that are supplied by Morrisons require raw
material or inputs of different types and quantity. When the number of inputs increase, the cost
for acquiring this input also rises and ultimately it leads to increase in the overall cost of
producing that product.
Sellers: This is another major factor where the number of producers or sellers in the market of a
particular commodity affect the supply of that particular commodity in the market. When the
sellers are more, the supply is also high causing a shift towards right and vice-e-versa when the
sellers are few.
Technology: When the technology is more advanced, the supply is also more because the
productivity is higher. In Morrisons, the technology that is being used in their retail stores is
extremely innovative and therefore enhanced supply causes a shift of the curve towards left (Wei
and Wentao, 2016).
Illustration 6: Shift in the supply
curve
⊘ This is a preview!⊘
Do you want full access?
Subscribe today to unlock all pages.
Trusted by 1+ million students worldwide
Natural factors or social factors: Natural factors consist of the natural phenomenon such as
floods, rains etc. and the social factors involve traditions, cultures etc. this can cause the supply
to either fall leading to a shift towards left or it can also cause it to move towards right.
Expectations: The market expectation of the sellers can be either bullish or bearish and
therefore, accordingly sellers can either increase or decrease the supply causing a shift in the
supply curve.
TASK 2
Comparison and contrast of different theories
The field of economics is regularly evolving and modifying and therefore from time to
time, some new theories or concepts related to the fields of economics keep emerging. They are
regularly emerging new trends and policies and therefore, their applicability also keeps getting
modified and updated. The three major theories that can be used to study economics are:
Keynesian Theory: This theory, termed by John Maynard Keynes in the 20th century was
developed to understand and ascertain the impact that Great Depression had over different levels
of an economy at macro and micro level (Franks and Bryant, 2017). The relationship between
the aggregate spending in an economy and its impact on the inflation in the economy has been
discussed in this theory. The government policies that addressed the problem of recession in an
economy were evaluated under this theory and it was recommended that fiscal and monetary
policies could be used to effectively bring in control the market forces. The theorist claimed that
market would never return back to the equilibrium position in its own and therefore, there need
to be appropriate fiscal interventions implemented in the form of government policies so that the
onset and deepening of depression can be controlled in an economy. The theory further
developed the point of deficit spending so that the investments could decline and as a result, the
aggregate demand in the economy could be stabilized thus addressing the problem effectively.
Although, this theory was vastly criticized by free market theorists who claimed that
market forces have always been self-regulating, and they i.e. demand and supply would
ultimately come to the equili8brium point. This will lead to the market returning back to its
original position and regain equilibrium on its own.
Freidman Theory: this theory also referred as Monetarism theory was developed as a counter to
the Keynesian theory (Guan, 2017). Under this theory, emphasis was laid on the monetary levers
operating in an economy such as banks and financial institutions stating that when these financial
Paraphrase This Document
Need a fresh take? Get an instant paraphrase of this document with our AI Paraphraser
institution will have more power, they will be able to control the market forces and therefore the
equilibrium or disequilibrium state of the market can be effectively controlled. This theory gave
the concept of MV=PQ where the M was signified as money supply, V was the velocity of
spending dollar per year, P signifies Price of the goods or services and Q referred to the quantity
of those goods and services that were demanded.
However, when the recession again set n the year 2007-08, the inefficiency of this theory
became prominent and the need for integrating the fiscal policies with the monetary policies was
felt by the economists (Mazurek, García and Rico, 2019). It was felt that the monetary supply
must be regulated by the fiscal policies and therefore, despite this theory being widely accepted,
faced criticism from practical economists and theorists thus paving way for the Fisherian Theory.
Fisherian Theory: Irving Fisher gave this modern economic theory in the 21st century claiming
that the real or the nominal interest rates currently prevalent in the market can be used to control
the inflation levels in the economy. Real interest rate can be calculated by subtracting the
expected inflation rate from the nominal interest rate that is prevalent. The theory claimed that
when the increase in the nominal rate of an economy is equivalent of the rate at which inflation is
increasing, then it can be concluded that the real interest rates in the economy are falling along
with the rise of inflation in economy.
This theory further evolved into the International Fisher Effect that is used while trading
in foreign exchange or at an international level (Cerreia and et.al., 2016). The theory garnered
huge support where it was termed as the perfect concept for controlling and monitoring the
movement of market forces and thus regulating the movement of economy.
CONCLUSION
The facts illustrated in the report above can be used to conclude hat the demand and
supply are the two major drivers or the market forces determining market situation. It was
identified in the report that how law of demand and supply are made applicable in the Morrisons
and the different factors causing movement or shift in these two curves of the market forces was
also analysed. Further, in this report a critical analysis was made between the past theories and
the emerging theories related to economics where three leading theories i.e. Keynesian Theory,
Monetarism theory and Fisherian Theory were taken into consideration to contrast the economic
concepts for the 20th and the 21st century. This helped in analysing the economic norms and
trends and the evolution in the market of UK.

⊘ This is a preview!⊘
Do you want full access?
Subscribe today to unlock all pages.
Trusted by 1+ million students worldwide
1 out of 14
Related Documents


Your All-in-One AI-Powered Toolkit for Academic Success.
+13062052269
info@desklib.com
Available 24*7 on WhatsApp / Email
![[object Object]](/_next/static/media/star-bottom.7253800d.svg)
Unlock your academic potential
Copyright © 2020–2026 A2Z Services. All Rights Reserved. Developed and managed by ZUCOL.