The Continued Influence Effect: A PSYC206 Research Report Analysis
VerifiedAdded on 2023/01/17
|15
|2531
|63
Report
AI Summary
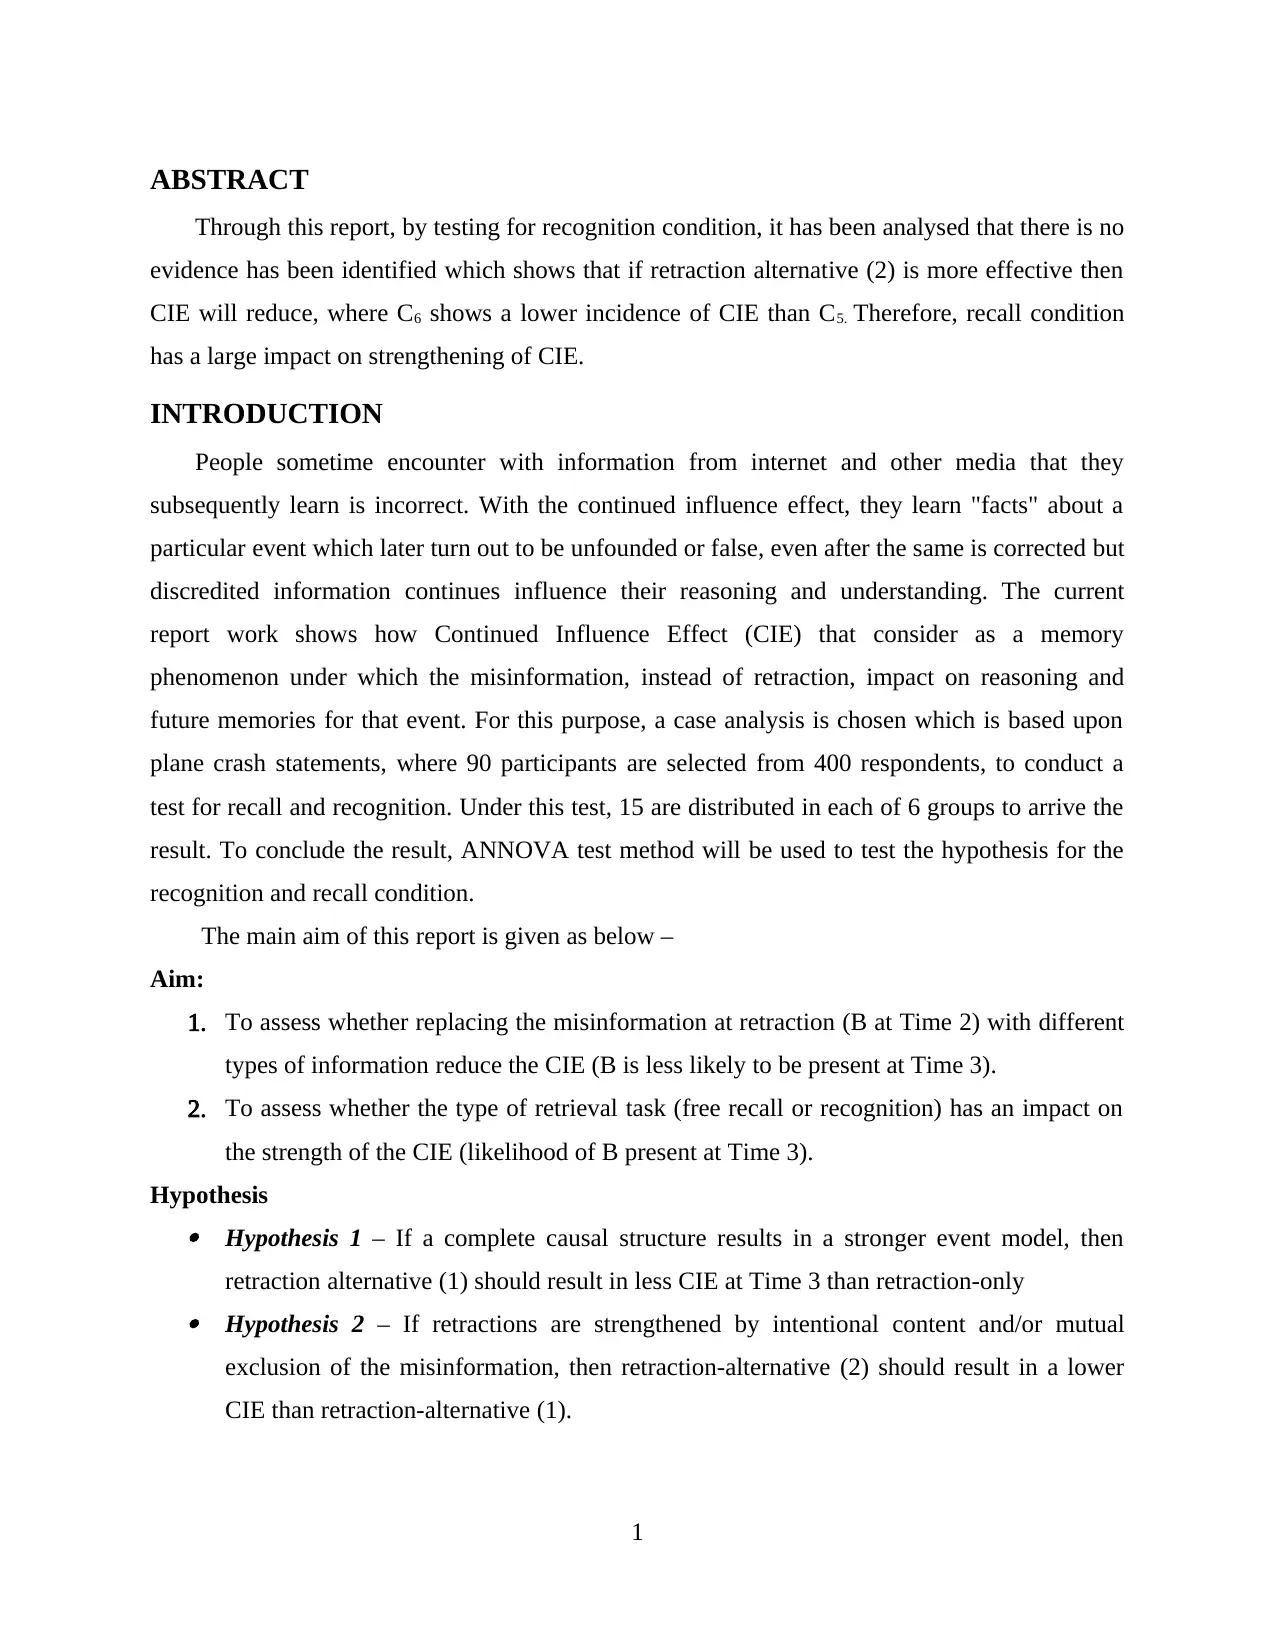
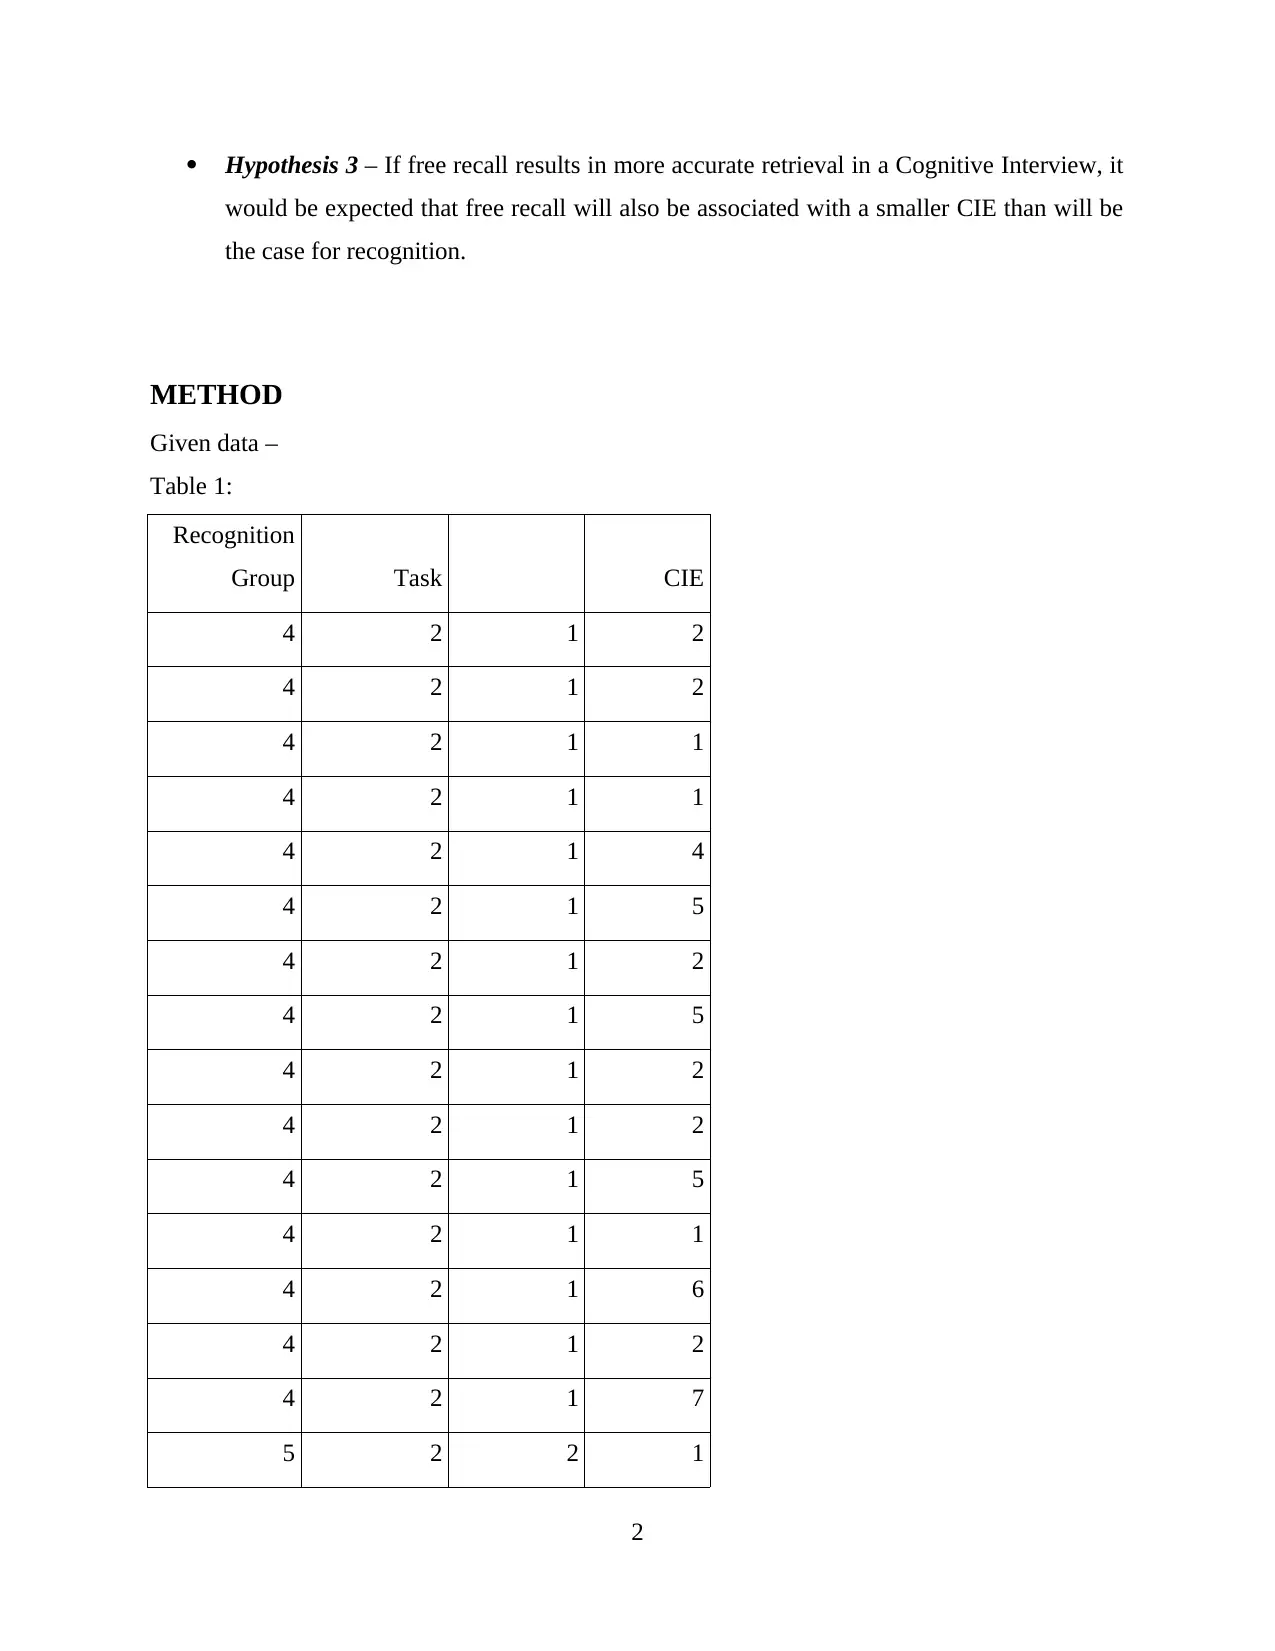
This report investigates the continued influence effect (CIE), a cognitive phenomenon where discredited information continues to influence reasoning and memory. The study, involving 90 participants across recall and recognition conditions, examines the impact of retraction alternatives and retrieval tasks on the CIE. The report presents the methodology, including ANOVA and t-tests, to assess the hypotheses. The results indicate significant differences between certain conditions in the recognition task, leading to the rejection of some null hypotheses. The analysis highlights the importance of retrieval tasks in strengthening the CIE and suggests that the type of information provided during retraction affects the persistence of misinformation. The findings contribute to a deeper understanding of how misinformation impacts memory and the effectiveness of different retraction strategies.

Nature and determinants of the
continued influence effect
Paraphrase This Document
Need a fresh take? Get an instant paraphrase of this document with our AI Paraphraser

Table of Contents
ABSTRACT.....................................................................................................................................1
INTRODUCTION...........................................................................................................................1
METHOD........................................................................................................................................2
Result.............................................................................................................................................11
Discussion......................................................................................................................................11
REFERENCES..............................................................................................................................12

⊘ This is a preview!⊘
Do you want full access?
Subscribe today to unlock all pages.

Trusted by 1+ million students worldwide

ABSTRACT
Through this report, by testing for recognition condition, it has been analysed that there is no
evidence has been identified which shows that if retraction alternative (2) is more effective then
CIE will reduce, where C6 shows a lower incidence of CIE than C5. Therefore, recall condition
has a large impact on strengthening of CIE.
INTRODUCTION
People sometime encounter with information from internet and other media that they
subsequently learn is incorrect. With the continued influence effect, they learn "facts" about a
particular event which later turn out to be unfounded or false, even after the same is corrected but
discredited information continues influence their reasoning and understanding. The current
report work shows how Continued Influence Effect (CIE) that consider as a memory
phenomenon under which the misinformation, instead of retraction, impact on reasoning and
future memories for that event. For this purpose, a case analysis is chosen which is based upon
plane crash statements, where 90 participants are selected from 400 respondents, to conduct a
test for recall and recognition. Under this test, 15 are distributed in each of 6 groups to arrive the
result. To conclude the result, ANNOVA test method will be used to test the hypothesis for the
recognition and recall condition.
The main aim of this report is given as below –
Aim:
1. To assess whether replacing the misinformation at retraction (B at Time 2) with different
types of information reduce the CIE (B is less likely to be present at Time 3).
2. To assess whether the type of retrieval task (free recall or recognition) has an impact on
the strength of the CIE (likelihood of B present at Time 3).
Hypothesis Hypothesis 1 – If a complete causal structure results in a stronger event model, then
retraction alternative (1) should result in less CIE at Time 3 than retraction-only Hypothesis 2 – If retractions are strengthened by intentional content and/or mutual
exclusion of the misinformation, then retraction-alternative (2) should result in a lower
CIE than retraction-alternative (1).
1
Paraphrase This Document
Need a fresh take? Get an instant paraphrase of this document with our AI Paraphraser

Hypothesis 3 – If free recall results in more accurate retrieval in a Cognitive Interview, it
would be expected that free recall will also be associated with a smaller CIE than will be
the case for recognition.
METHOD
Given data –
Table 1:
Recognition
Group Task CIE
4 2 1 2
4 2 1 2
4 2 1 1
4 2 1 1
4 2 1 4
4 2 1 5
4 2 1 2
4 2 1 5
4 2 1 2
4 2 1 2
4 2 1 5
4 2 1 1
4 2 1 6
4 2 1 2
4 2 1 7
5 2 2 1
2

5 2 2 1
5 2 2 1
5 2 2 2
5 2 2 1
5 2 2 2
5 2 2 1
5 2 2 2
5 2 2 1
5 2 2 1
5 2 2 1
5 2 2 2
5 2 2 1
5 2 2 2
5 2 2 2
6 2 3 0
6 2 3 1
6 2 3 2
6 2 3 1
6 2 3 1
6 2 3 1
6 2 3 0
6 2 3 2
6 2 3 1
6 2 3 0
3
5 2 2 1
5 2 2 2
5 2 2 1
5 2 2 2
5 2 2 1
5 2 2 2
5 2 2 1
5 2 2 1
5 2 2 1
5 2 2 2
5 2 2 1
5 2 2 2
5 2 2 2
6 2 3 0
6 2 3 1
6 2 3 2
6 2 3 1
6 2 3 1
6 2 3 1
6 2 3 0
6 2 3 2
6 2 3 1
6 2 3 0
3
⊘ This is a preview!⊘
Do you want full access?
Subscribe today to unlock all pages.

Trusted by 1+ million students worldwide

6 2 3 2
6 2 3 0
6 2 3 1
6 2 3 0
6 2 3 2
Calculation required for independent t-test -
One Way - ANNOVA test for Recognition condition –
Table 2:
C4 Recognition only C5 Recognition alternative (1)
CIE Score Squared CIE Score Squared
2 4 1 1
2 4 1 1
1 1 1 1
1 1 2 4
4 16 1 1
5 25 2 4
2 4 1 1
5 25 2 4
2 4 1 1
2 4 1 1
5 25 1 1
1 1 2 4
6 36 1 1
2 4 2 4
7 49 2 4
Sum X1 = 47 Sum X12 = 203 Sum X2 = 21 Sum X22 = 33
Mean (X1) = 3.11 Mean (X2) = 1.4
Now, after identifying the mean (𝑋̅ ) for each condition of recognition, next step is to calculate
Sums of Squares (SS) for each condition, by using following formula :-
𝑆𝑆1 = ∑X12 − (∑ 𝑋1)2 / 𝑁
= 203 − (47)2 / 15
= 203 – 147.26
= 55.74
4
6 2 3 0
6 2 3 1
6 2 3 0
6 2 3 2
Calculation required for independent t-test -
One Way - ANNOVA test for Recognition condition –
Table 2:
C4 Recognition only C5 Recognition alternative (1)
CIE Score Squared CIE Score Squared
2 4 1 1
2 4 1 1
1 1 1 1
1 1 2 4
4 16 1 1
5 25 2 4
2 4 1 1
5 25 2 4
2 4 1 1
2 4 1 1
5 25 1 1
1 1 2 4
6 36 1 1
2 4 2 4
7 49 2 4
Sum X1 = 47 Sum X12 = 203 Sum X2 = 21 Sum X22 = 33
Mean (X1) = 3.11 Mean (X2) = 1.4
Now, after identifying the mean (𝑋̅ ) for each condition of recognition, next step is to calculate
Sums of Squares (SS) for each condition, by using following formula :-
𝑆𝑆1 = ∑X12 − (∑ 𝑋1)2 / 𝑁
= 203 − (47)2 / 15
= 203 – 147.26
= 55.74
4
Paraphrase This Document
Need a fresh take? Get an instant paraphrase of this document with our AI Paraphraser

𝑆𝑆2 = ∑X22 − (∑ 𝑋2)2 / 𝑁
= 33 − (21)2 / 15
= 33 – 29.4
= 3.6
Now, the combined variance at n-1 degrees of freedom i.e. (15-1 = 14) can be calculated by
using following formula –
𝑠𝑝2 = 𝑆𝑆1 + 𝑆𝑆2
𝑑𝑓1 + 𝑑𝑓2
= 55.74 + 3.6
14 + 14
= 59.34 / 28 = 2.11
This combined variance is further used for calculating the sampling error, that provides
an estimate of non-systematic or error variance in following way –
S𝑋̅ - 𝑋̅ = √ 𝑠𝑝2 + 𝑠𝑝2
n1 n2
= √ 2.11 + 2.11
15 15
= √0.28 = 0.53
At last, independent measures i.e. t-test which can be defined as a ratio can be calculated
by dividing the mean difference from estimate of error variance, in following way –
𝑡 = (𝑋̅1 - 𝑋̅2)
S𝑋̅ - 𝑋̅
= 3.11 – 1.4
0.53
= 1.71 / 0.53 = 3.22
at, t28 (t critical) = 2.048, and mean difference between C4 and C5 is 1.71 which is greater than p
value (p > 0.05) but as calculated value of t is greater than critical value, so, under this case, null
hypothesis is rejected.
5

Turning now, towards second recognition condition, t-test can be measured in following way-
Table 3:
C5 Recognition only C6 Recognition alternative (1)
CIE
Score
Squared CIE
Score
Squared
1 1 0 0
1 1 1 1
1 1 2 4
2 4 1 1
1 1 1 1
2 4 1 1
1 1 0 0
2 4 2 4
1 1 1 1
1 1 0 0
1 1 2 4
2 4 0 0
1 1 1 1
2 4 0 0
2 4 2 4
Sum X1 = 21 Sum X12 = 33 Sum X2 =14 Sum X22 = 22
Mean (X1) = 1.4 Mean (X2) = 0.93
Sums of Squares (SS) for each condition can be calculated -
𝑆𝑆1 = ∑X12 − (∑ 𝑋1)2 / 𝑁
= 33 − (21)2 / 15
= 33 – 29.4
= 3.6
𝑆𝑆2 = ∑X22 − (∑ 𝑋2)2 / 𝑁
= 22 − (14)2 / 15
= 22 – 13.06
= 8.94
6
⊘ This is a preview!⊘
Do you want full access?
Subscribe today to unlock all pages.

Trusted by 1+ million students worldwide

Now, the pooled or combined variance with n-1 degrees of freedom i.e. (15-1 = 14) is calculated
as -
𝑠𝑝2 = 𝑆𝑆1 + 𝑆𝑆2
𝑑𝑓1 + 𝑑𝑓2
= 3.6 + 8.94
14 + 14
= 12.54 / 28 = 0.45
Now, using this combined variance to calculate sampling error as –
S𝑋̅ - 𝑋̅ = √ 𝑠𝑝2 + 𝑠𝑝2
n1 n2
= √ 0.45 + 0.45
15 15
= √0.06 = 0.25
Then, value of t will be -
𝑡 = (𝑋̅1 - 𝑋̅2)
S𝑋̅ - 𝑋̅
= 1.4 – 0.93
0.25
= 0.47 / 0.25 = 1.88
Now, mean difference between C5 and C6 is 0.47 therefore, p > 0.05, while at, t28 (t critical) = 2.048
but as calculated value of t is less than critical value, so, under this condition, null hypothesis is
accepted.
Table 4:
Calculation for one-way ANOVA for independent samples –
C4 Recognition only
C5 Recognition
alternative (1) C6 Recognition alternative (2)
CIE
Score
Squared CIE
Score
Squared CIE Score Squared
2 4 1 1 0 0
2 4 1 1 1 1
7
Paraphrase This Document
Need a fresh take? Get an instant paraphrase of this document with our AI Paraphraser

1 1 1 1 2 4
1 1 2 4 1 1
4 16 1 1 1 1
5 25 2 4 1 1
2 4 1 1 0 0
5 25 2 4 2 4
2 4 1 1 1 1
2 4 1 1 0 0
5 25 1 1 2 4
1 1 2 4 0 0
6 36 1 1 1 1
2 4 2 4 0 0
7 49 2 4 2 4
n = 15 n = 15 n = 15
Sum (X1) =
47
Sum (X2)
=21 Sum (X3) = 14
Mean =
3.13
Mean =
1.4 Mean = 0.93
Sum (X12)
= 203
Sum (X22) =
33 Sum (X22) = 22
SS = 55.74 SS = 3.6
SS = 8.94
Total no. of participants at recognition condition is N (15 + 15 +15) = 45, while G i.e. total
number of whether references is 82. Now,
Sum of squares between groups,
SS between = ∑ T2 - G2
n N
then,
SSb = (472 + 212 + 142 ) – 822
15 15 15 45
= (189.73 – 149.42)
= 40.31
Here, degrees of freedom (df) = k – 1 = 3 – 1 = 2
Sum of squares within groups,
SS within = ∑ SS
= (55.74 + 3.6 + 8.94)
= 68.28
8

Here, degrees of freedom (df) = N – k = 45 – 3 = 42
Now, total sum of squares –
SST = ∑X2 – G2 / N
= (203 + 33 + 22) – 822 / 45
= 258 – 149.42
= 108.58
At this level, dftotal = N – 1 = 45 – 1 = 44
Now, F value can be calculated by –
ANOVA Summary Table
Source SS df MS F
Between 40.31 2 SS/df = 40.31/2 = 20.15 MS between = 20.15
MS within 1.62
= 12.40
Within 68.28 42 SS/df = 68.28/42 = 1.62
Total 44
Here, calculated value of F(2,42) is 12.40, p < .05. Considering the Fishers’ table (F table),
at p = .01, critical value at this level is 5.06. So, actual F value as shown in above table is greater
than the critical value, therefore, null hypothesis is rejected at this level.
Again, as unlike t-test, there is a significant effect between more than two groups – C4 and
C5, C5 and C6, or C4 and C6. Therefore, to determine where the significant effects lie, Tukey’s
HSD in following way –
HSD = q √ MSerror
n
= 3.44 √1.62 /15
= 3.44 x 0.33
= 1.1352 = 1.14 (approx.)
Now, C4 (3.13) – C5 (1.40) = 1.73
C5 (1.40) – C6 (0.93) = 0.47
9
⊘ This is a preview!⊘
Do you want full access?
Subscribe today to unlock all pages.

Trusted by 1+ million students worldwide
1 out of 15
Related Documents
Your All-in-One AI-Powered Toolkit for Academic Success.
+13062052269
info@desklib.com
Available 24*7 on WhatsApp / Email
Unlock your academic potential
Copyright © 2020–2025 A2Z Services. All Rights Reserved. Developed and managed by ZUCOL.


