Analyzing Root Causes and Developing Improvement Plans for PEW Project
VerifiedAdded on 2023/06/04
|26
|4231
|348
Project
AI Summary
This project management report focuses on Precision Engineering Works (PEW) and addresses the company's project failures by analyzing their root causes and developing a continuous improvement plan. The project aims to identify the reasons behind declining sales and profitability, exploring the lack of effective marketing tools, inefficient communication systems, and a failure to adapt to market changes. The analysis utilizes various tools and techniques, including control charts, data tables, histograms, cause-and-effect diagrams, Pareto analysis, check sheets, and scatter diagrams, to pinpoint specific issues. The report outlines a five-phase continuous improvement plan based on Lean Six Sigma principles, emphasizing risk management, resource allocation, and performance forecasting. The identified problems, such as employee inefficiency, resistance to change, and technical risks, are addressed with specific actions and resource requirements. The project concludes that the complexities within PEW can be effectively resolved by implementing lean six sigma project methodology, offering a strategic approach to enhancing the company's growth and operational efficiency.

Project Management
Paraphrase This Document
Need a fresh take? Get an instant paraphrase of this document with our AI Paraphraser

Executive summary:
The PEW company is planning for analysing the root cause of the project failure and
developing the continuous improvement plan for emphasising the growth of the company.
Several tools are used for analysing the root cause such as praetor analysis, scatter diagram,
histogram, control charts, checklist, data tables, and others. The proactive identification of the
uncertainties helps in managing the risks effectively. The business strategy for developing
continuous improvement plan is described in five phase processes of Six sigma lean project
management principles. It can be concluded that the complexities of the PEW organization
can be effectively resolved by deploying the principles of lean six sigma project
methodology.
1

Contents
1. Introduction...................................................................................................................................4
2. Project aim.....................................................................................................................................4
3. Project Objectives..........................................................................................................................4
4. Identification of the root cause.....................................................................................................4
Application of tools and technologies...............................................................................................5
Assumptions....................................................................................................................................10
5. Continuous improvement plan....................................................................................................10
Problems Identified.........................................................................................................................11
Actions Taken..................................................................................................................................14
Resources Required.........................................................................................................................16
Follow up action and status.............................................................................................................17
6. Competencies..............................................................................................................................20
Business and strategic management...............................................................................................20
Technical Management...................................................................................................................20
Leadership.......................................................................................................................................22
7. Conclusion...................................................................................................................................22
8. References...................................................................................................................................22
9. Appendix:.....................................................................................................................................24
List of Figure
Figure 1.................................................................................................................................................4
Figure 2.................................................................................................................................................5
Figure 3.................................................................................................................................................6
Figure 4.................................................................................................................................................7
Figure 5.................................................................................................................................................7
Figure 6.................................................................................................................................................8
Figure 7...............................................................................................................................................20
List of Table
Table 1.................................................................................................................................................10
Table 2.................................................................................................................................................11
Table 3.................................................................................................................................................14
2
⊘ This is a preview!⊘
Do you want full access?
Subscribe today to unlock all pages.
Trusted by 1+ million students worldwide

Table 4.................................................................................................................................................16
Table 5.................................................................................................................................................17
Table 6.................................................................................................................................................20
3
Paraphrase This Document
Need a fresh take? Get an instant paraphrase of this document with our AI Paraphraser

1. Introduction
Precision engineering works private limited (PEW) is the manufacturing company which
focuses on developing the plastic parts required for the telecommunication industry. The
increasing rate of new suppliers has affected the profit earned by the enterprise. The company
is not able to manage their existing contracts and developing new contracts because the
market competitors are providing the equipment and tools at lower price than the PEW
organization. The top executives of the organization are looking forward to improve the
business operation plan with the aim of increasing turnover and profitability of the enterprise.
2. Project aim
The aim of this paper is to analyse the root cause of the project failure and developing the
continuous improvement plan for emphasising the growth of the company.
3. Project Objectives
The objectives of the project are as follows:
Identification of the root cause for the decreasing rate of product sale
Development of the continuous improvement plan
Analysis of the risks associated with the project
Management of the required resources
Forecasting the success matrix of the proposed project
4. Identification of the root cause
The identification of root cause helps in developing the effective plan for increasing the
profitability of the enterprise. The evaluation of the case study focuses that the PEW
Company is not having effective marketing tools and technologies to explore the features of
their product in the eyes of the customers. The company is not indulging communication
tools and technologies for managing the good and healthy relationship between the internal
and external stakeholders. The limitation of the communication tools and incorporation of the
social media platform for marketing and managing flow of information is the major cause of
the project failure. The market is changing with the involvement of the new trends and
technologies. The customers get attracted towards the companies which are using new
technologies. The emergence of the new suppliers increases the level of competition for the
4

PEW organization because the newer suppliers make use of advanced technologies to
develop new contracts and attracts customers. The PEW Company is working on the old
platform of communication. The organization has no tools and technologies to know the
changing requirement, feedback and review of the customers. The market analysis is not
conduct by the organization to analyse the difference in the cost which occurred in the price
of the PEW products and the newer supplier products. The price of the product should be
fixed after analysing the quality and market price of the similar equipment. Some of the
major root causes of the project failure are highlighted below:
No means of technologies for promoting the features and quality of the equipment
developed by the organization
Inefficient communication system between the internal and external employees.
No analysis of the market price of the developed equipment
No good and healthy relationship with the customers
No analysis of the feedback and reviews of the customers on the quality of the
equipment (Rabechini, and Carvalho, 2013)
No program for identifying the new technologies and marketing trends incorporated
by the competitors
No tools for promoting the equipment in the eyes of the customers
No development of the recognised brand name for the manufactured equipment
Application of tools and technologies
The tools and technologies which help in identifying the problems, gaps, and issues existed
with the current working structure of the PEW organization are as follows:
Control Charts: The control charts are prepared for analysing the change in process with the
passage of time. The average is drawn from analysing the upper and the lower limit of the
control structure used for developing the process control block (Rauber, 2014). The control
charts are developed for analysing and monitoring of the quality. The behaviour of the
process can be effectively noted down from the developed process chart. The efficiency of
the manufacturing process can be analysed by the control charts.
Figure 1
5
⊘ This is a preview!⊘
Do you want full access?
Subscribe today to unlock all pages.
Trusted by 1+ million students worldwide

(Source: Rabechini, R., and Carvalho, M. (2013). Understanding the impact of project risk
management on project performance: an Empirical study)
Data Tables: The data tables are prepared for division of work between the internal and
external stakeholders to effectively achieved the project goal and objectives.
Histogram: The histogram is used for analysing the numerical data of the process. The
histogram is used for analysing the continuous data to identifying the gaps and flaws in the
process structure.
Figure 2
6
Paraphrase This Document
Need a fresh take? Get an instant paraphrase of this document with our AI Paraphraser

(Kharaiweish, (2013). Project Monitoring and control measures)
Cause and effect Diagram: The cause and effect diagrams are prepared for analysing the
effect on the project goal and objectives by the amalgamative contribution of process, people,
machinery, and technology on the development process cycle.
Figure 3
(Moujib and Aziz. (2017). Lean Project management)
7

Pareto Analysis: The pareto investigation is used for analysing the supply chain management
system undertaken by the organization for managing the flow of inventory.
Figure 4
(Source: Jovanovic, F., Milijic, N., Dimitrova, M., Mihajlovic, I. (2016). Risk management
impact assessment on the success of strategic investment projects.
Check Sheet: The check sheets are prepared by reviewing the requirement specification plan
developed by the project owner for the improvement of the project working operational plan.
It helps in analysing the status of the process control block developed for achieving the
project goal (Andrades, Barco, Serrano, and Oliver, 2016).
Figure 5
8
⊘ This is a preview!⊘
Do you want full access?
Subscribe today to unlock all pages.
Trusted by 1+ million students worldwide

(Otieno, F. (2014). The role of monitoring and evaluation in projects)
Scatter Diagram: The scatter diagram is used for analysing the profit earned by the
organization with the deployment of change management strategy.
Figure 6
(Source: Google Image)
9
Scatter Diagram: The scatter diagram is used for analysing the profit earned by the
organization with the deployment of change management strategy.
Figure 6
(Source: Google Image)
9
Paraphrase This Document
Need a fresh take? Get an instant paraphrase of this document with our AI Paraphraser
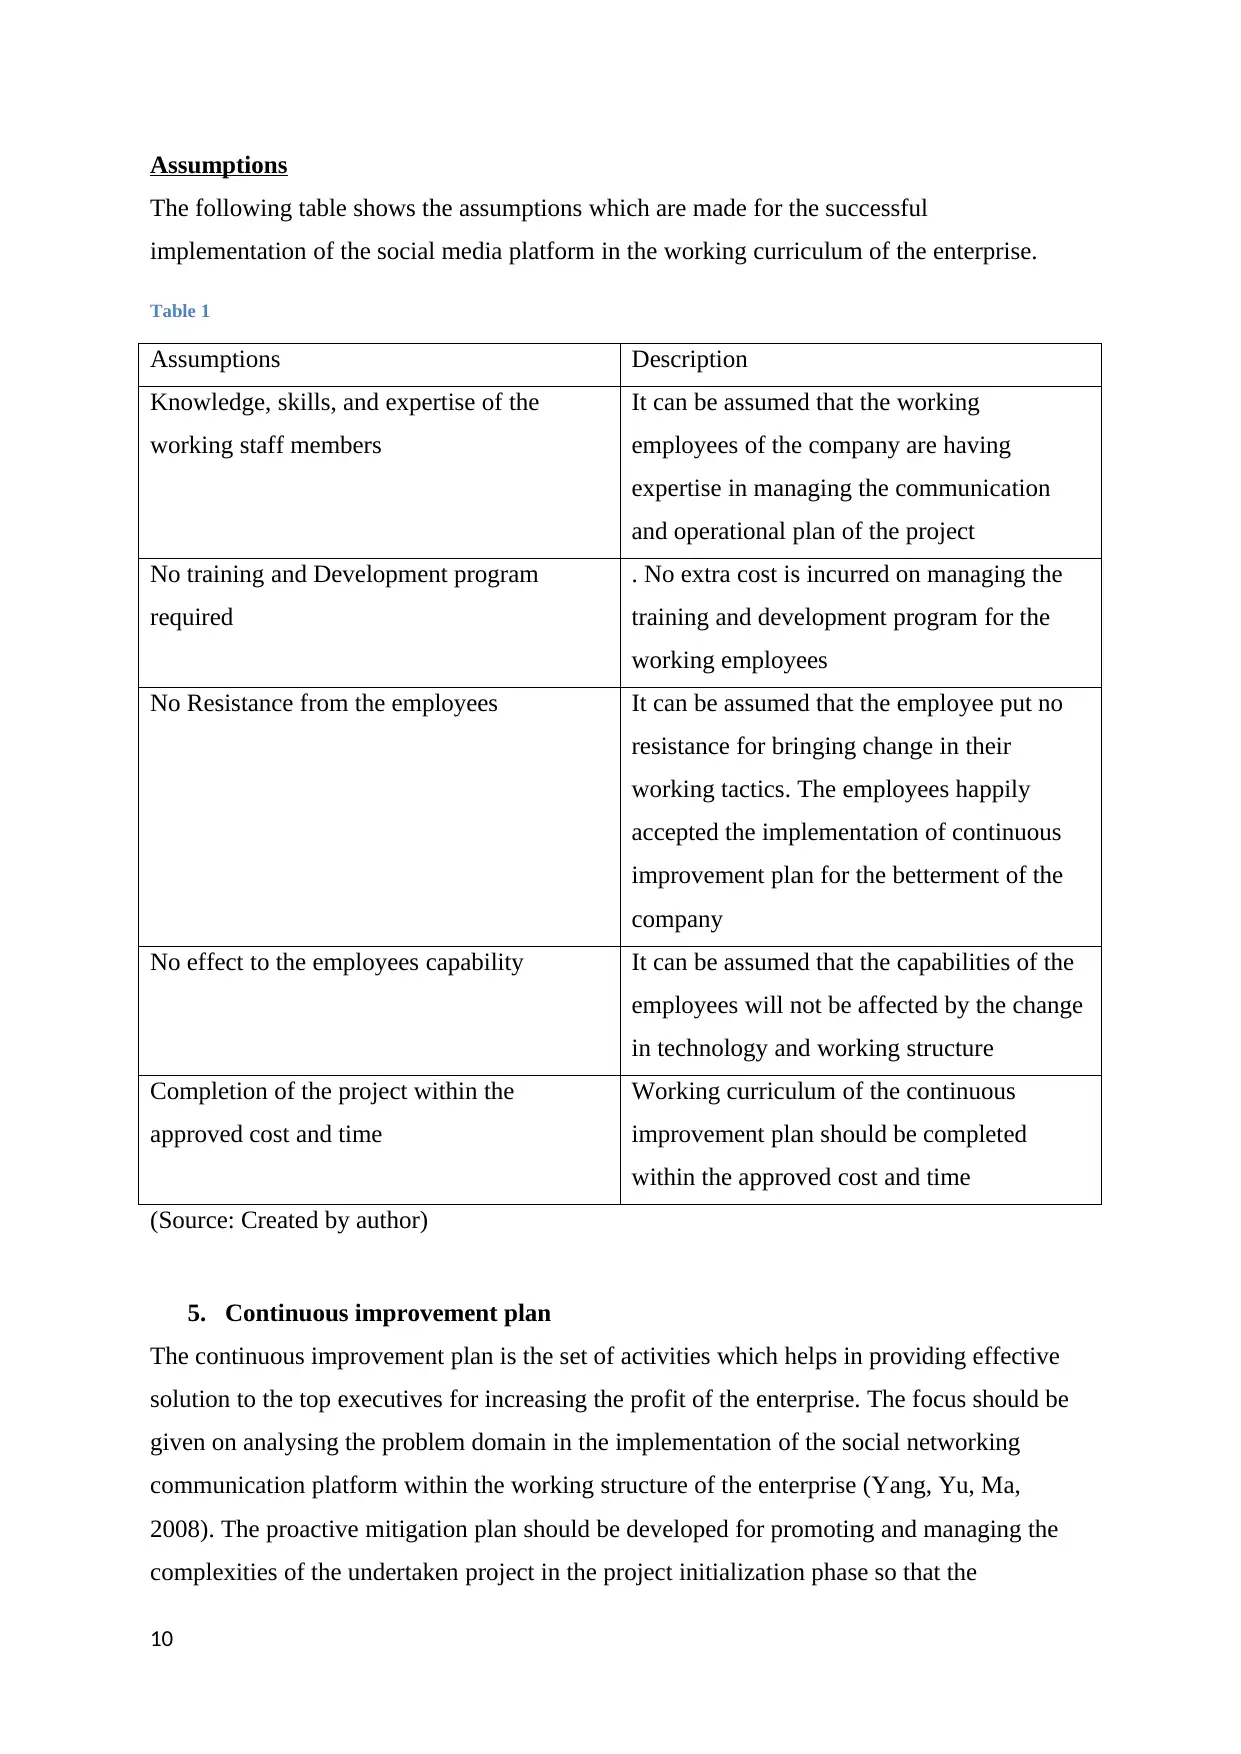
Assumptions
The following table shows the assumptions which are made for the successful
implementation of the social media platform in the working curriculum of the enterprise.
Table 1
Assumptions Description
Knowledge, skills, and expertise of the
working staff members
It can be assumed that the working
employees of the company are having
expertise in managing the communication
and operational plan of the project
No training and Development program
required
. No extra cost is incurred on managing the
training and development program for the
working employees
No Resistance from the employees It can be assumed that the employee put no
resistance for bringing change in their
working tactics. The employees happily
accepted the implementation of continuous
improvement plan for the betterment of the
company
No effect to the employees capability It can be assumed that the capabilities of the
employees will not be affected by the change
in technology and working structure
Completion of the project within the
approved cost and time
Working curriculum of the continuous
improvement plan should be completed
within the approved cost and time
(Source: Created by author)
5. Continuous improvement plan
The continuous improvement plan is the set of activities which helps in providing effective
solution to the top executives for increasing the profit of the enterprise. The focus should be
given on analysing the problem domain in the implementation of the social networking
communication platform within the working structure of the enterprise (Yang, Yu, Ma,
2008). The proactive mitigation plan should be developed for promoting and managing the
complexities of the undertaken project in the project initialization phase so that the
10

uncertainties associated with the project can be significantly minimized and the project can
be successfully completed within the given time and cost framework. The continuous
improvement plan is prepared by undergoing the PDCA cycle which focuses on four tasks
which are classified as plan, do, act, and check (Ren, Ling, Wei, Fan, 2015). The PDCA cycle
development for the project is shown below:
Plan Do Act Check
Identification of
problems
Systematic review of
business problem
Analysis of gaps and
flaws
Development of
business strategy
Management of risks
identified
The follow-up of
action plan should be
developed for
managing the
problems effectively
and resolving the
issues of
complexities
Quality control and
checklist should be
prepared for
monitoring the
project completion
with the expected
outcome
Problems Identified
The implementation of the social networking platform in the working environment of the
enterprise is comprised of various risks, complexities, uncertainties, and issues. The proactive
identification of the uncertainties helps in managing the risks effectively. The focus should be
given on analysing the risks severity and risks likelihood to set priority and associated
ranking of the risks so that the measure of impact on the working process can be analysed and
systematically mitigation plan can be prepared effectively. The table below shows the
identified risks with its related severity, likelihood, ranking, and impact on the business
performance.
Table 2
Problems
Identified
Problems
Severity
Problems
Likelihood
Problems
Rankings
Problems
Impact
Description
Inefficiency of
the employees
in adopting the
social
networking
3 2 5 Medium The employees are not
having required skills,
talents, and expertise
in dealing with the
program of social
11
⊘ This is a preview!⊘
Do you want full access?
Subscribe today to unlock all pages.
Trusted by 1+ million students worldwide
1 out of 26
Related Documents


Your All-in-One AI-Powered Toolkit for Academic Success.
+13062052269
info@desklib.com
Available 24*7 on WhatsApp / Email
![[object Object]](/_next/static/media/star-bottom.7253800d.svg)
Unlock your academic potential
Copyright © 2020–2026 A2Z Services. All Rights Reserved. Developed and managed by ZUCOL.