Convenience Store Financial Performance: 12-Month Sales and Expenses
VerifiedAdded on 2021/01/08
|7
|1664
|76
Report
AI Summary
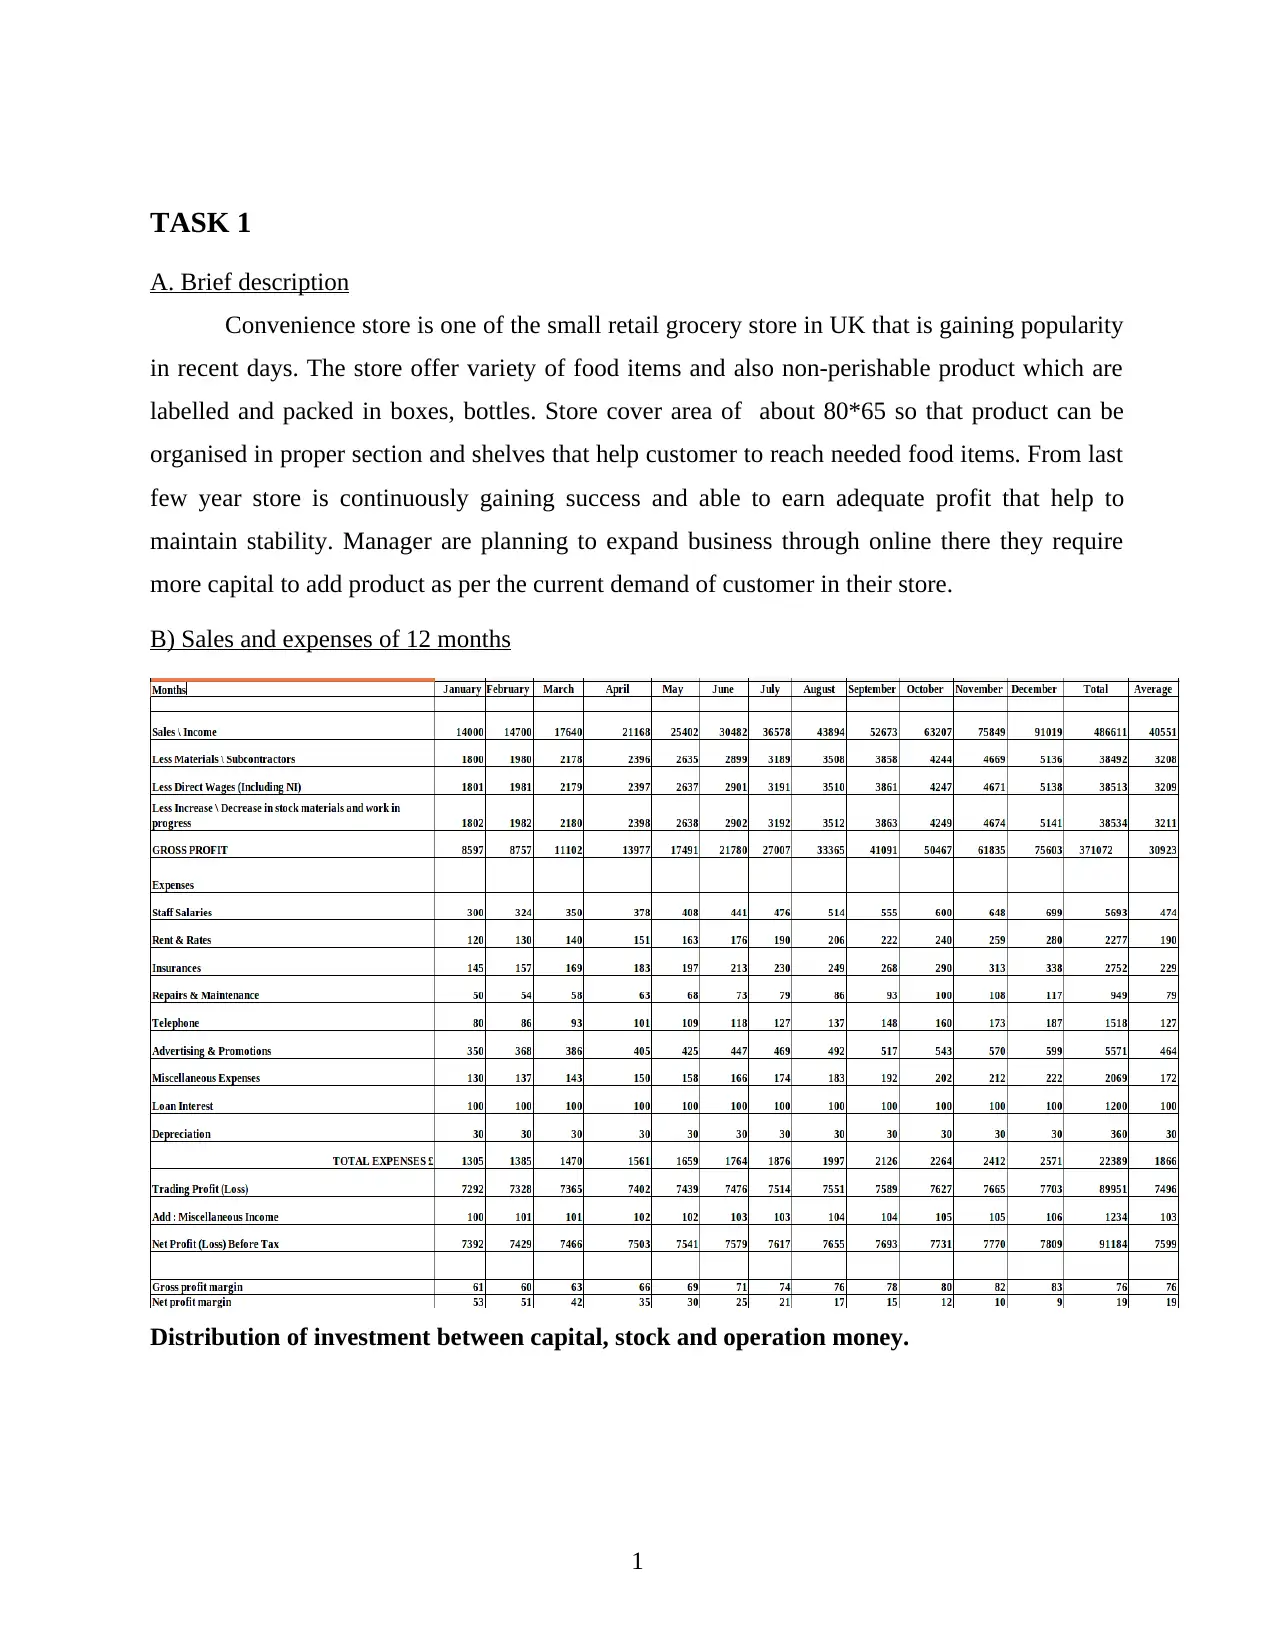
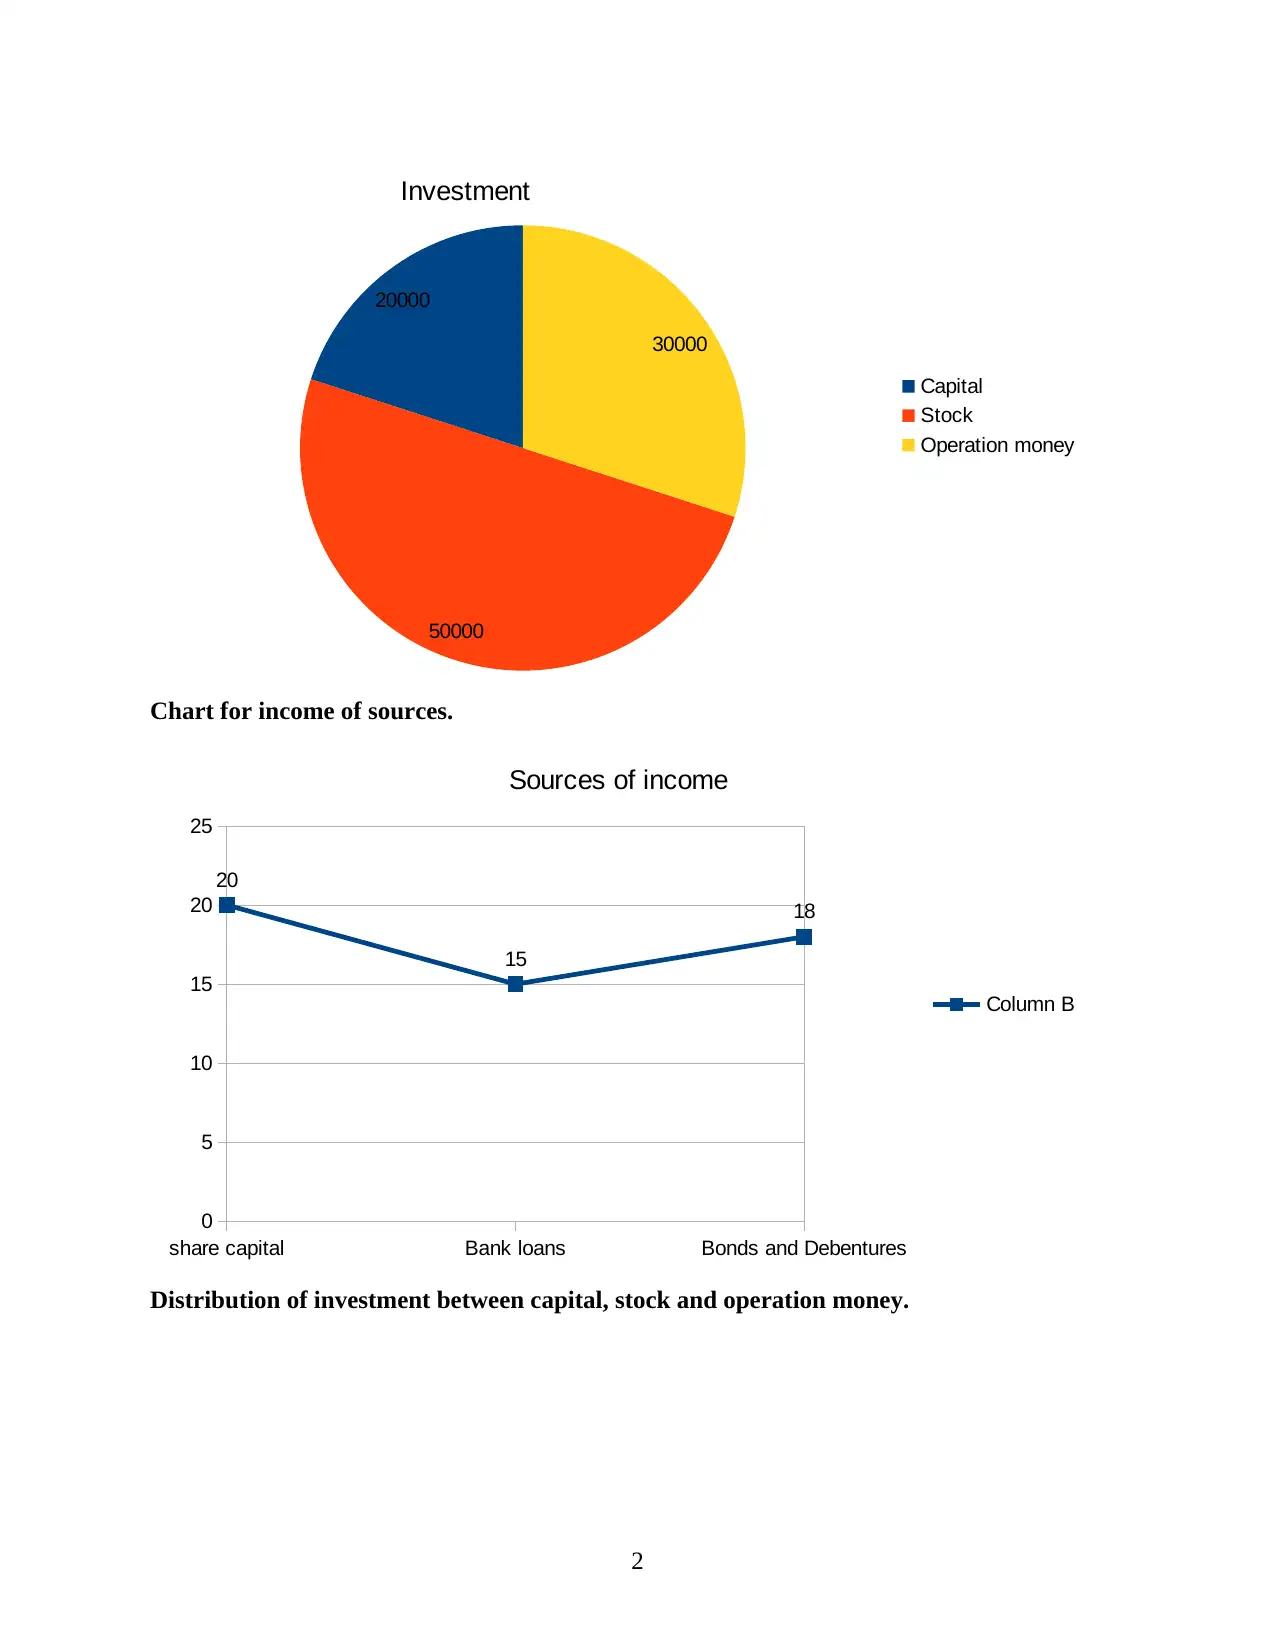
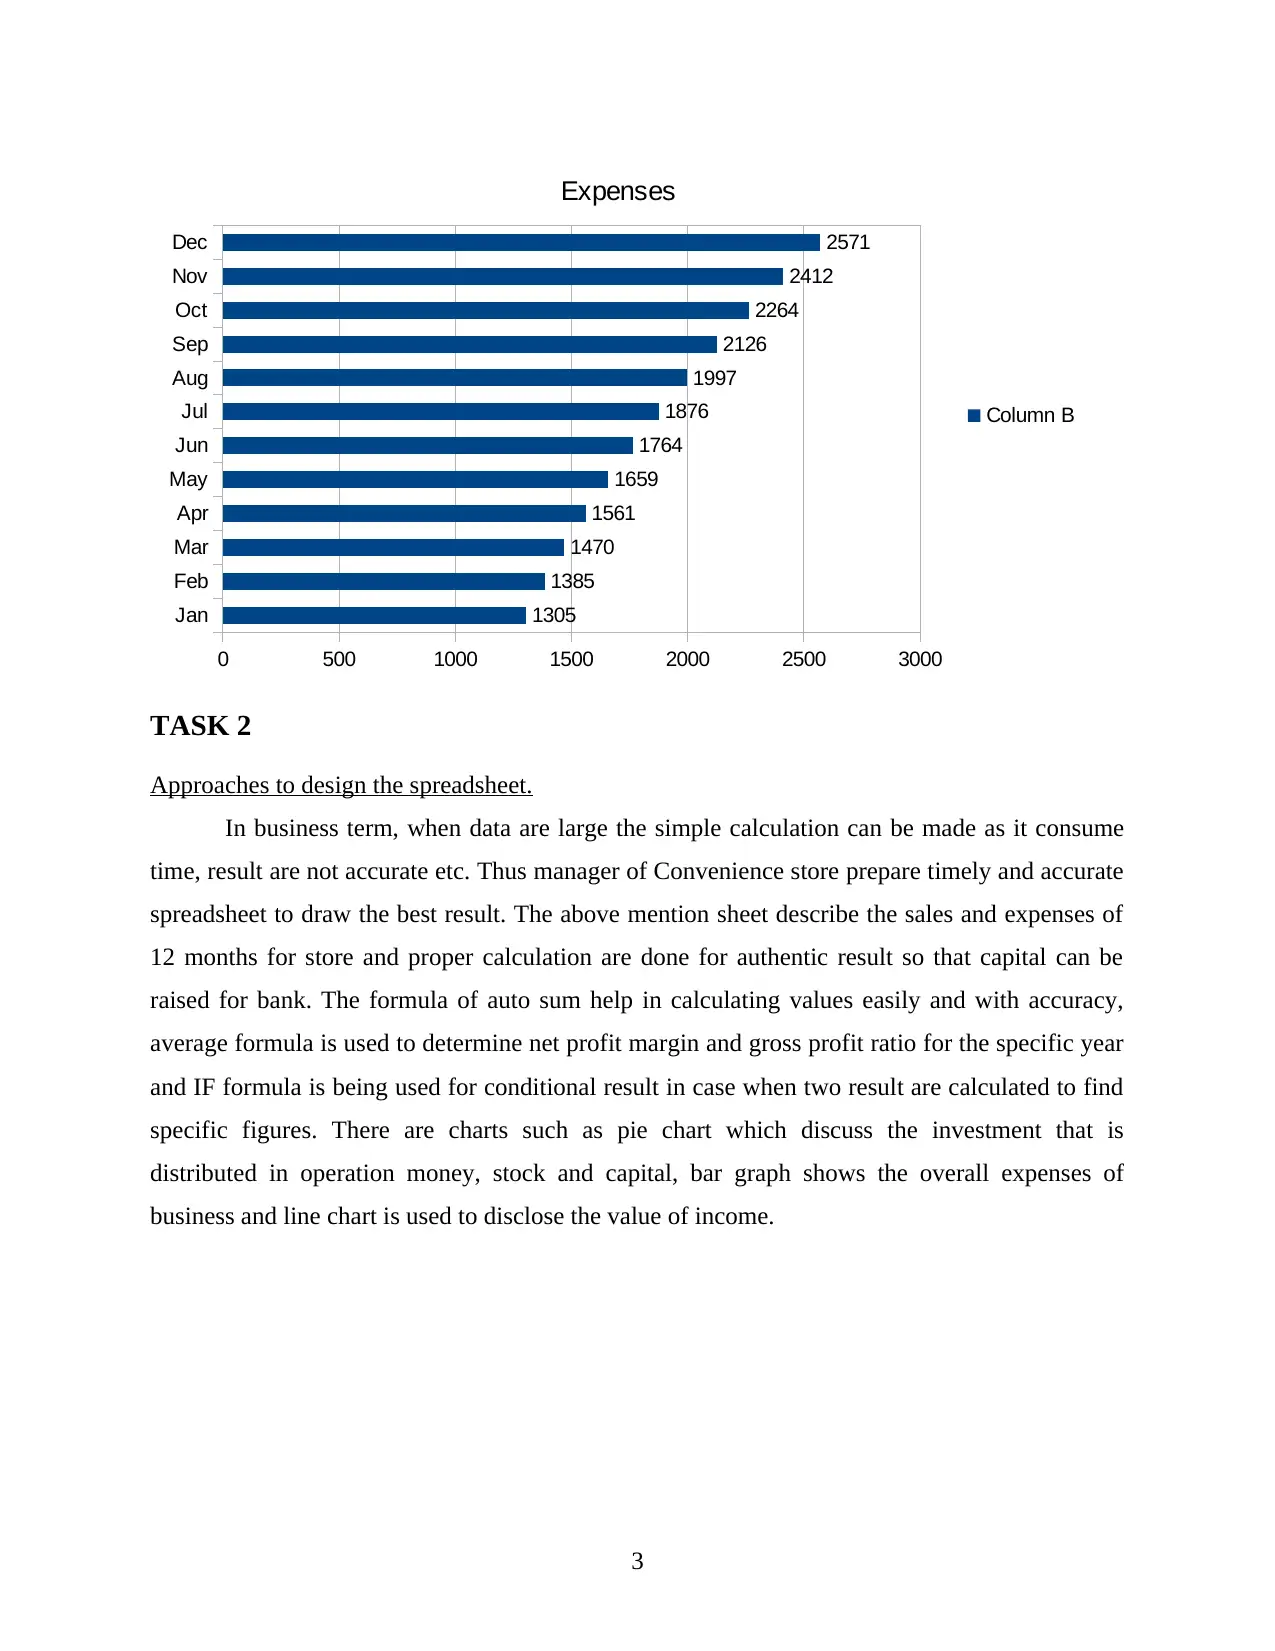
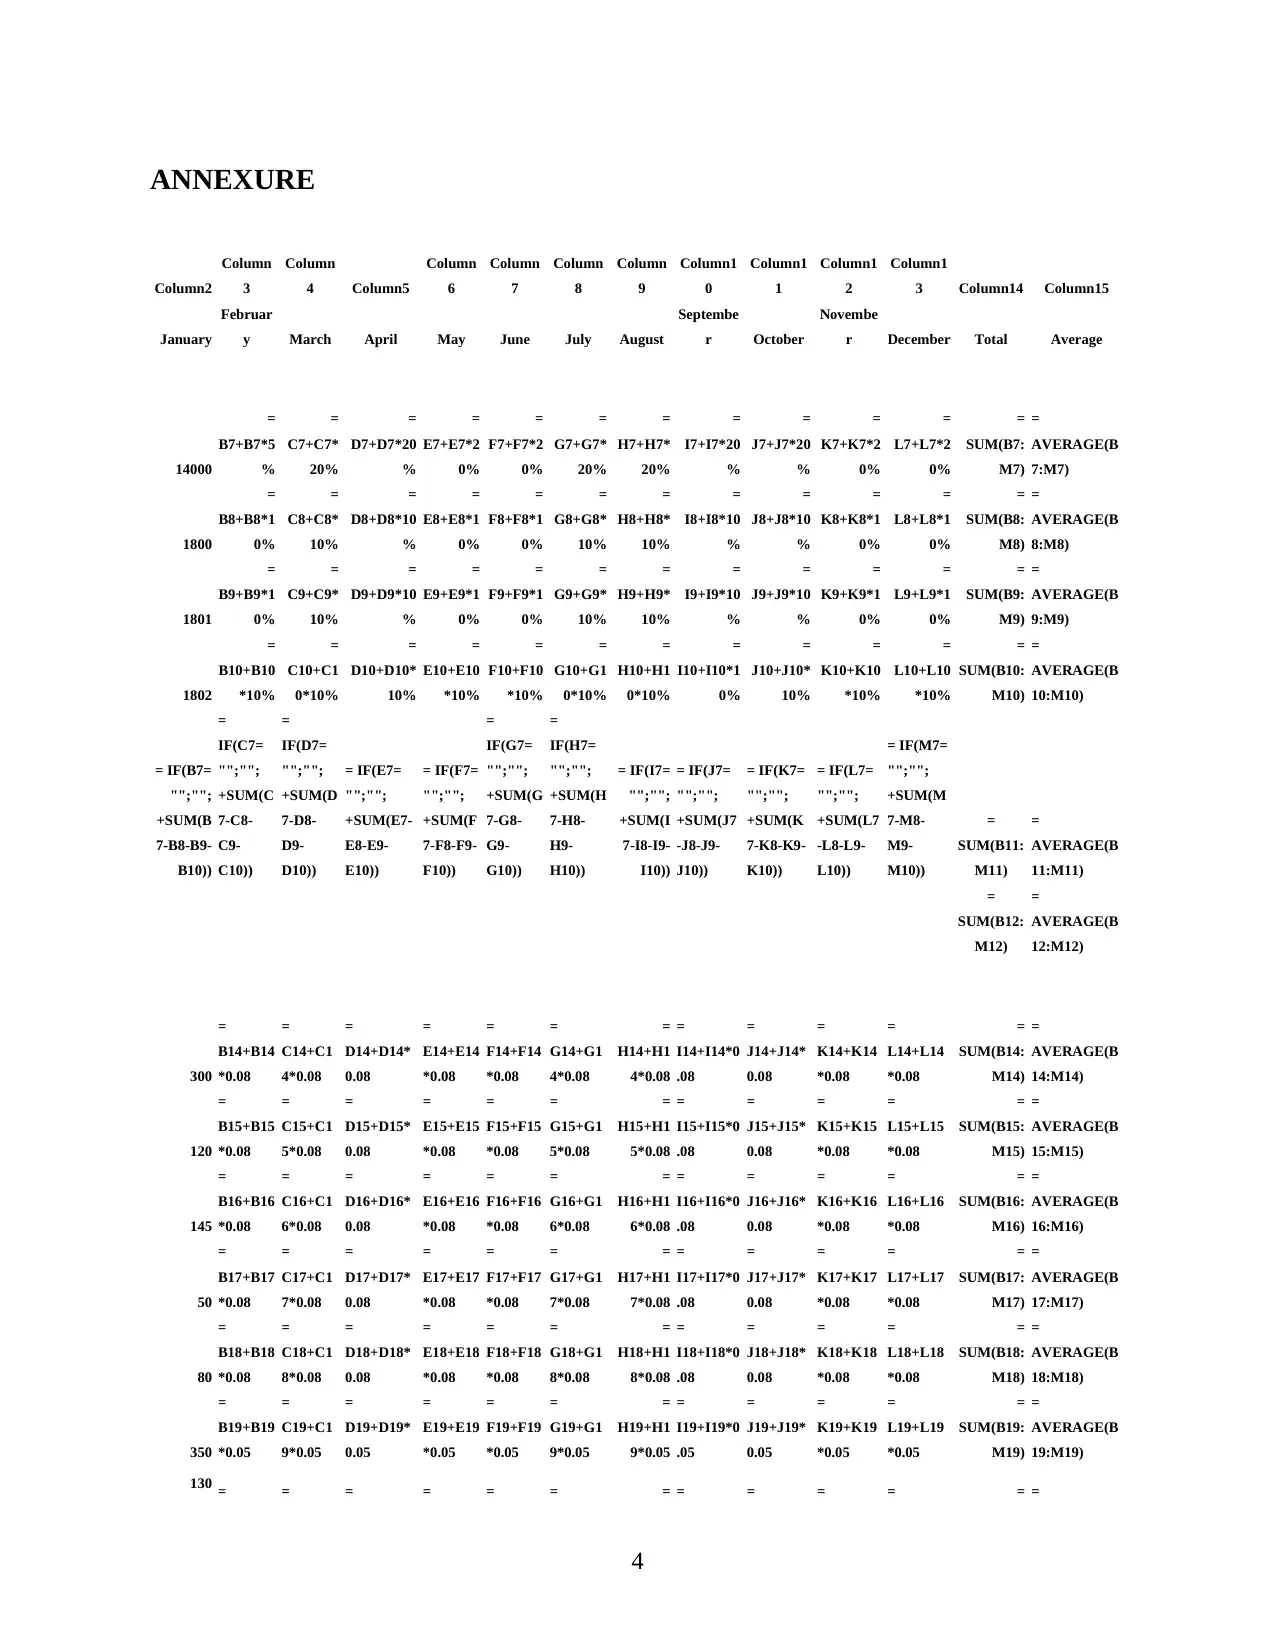
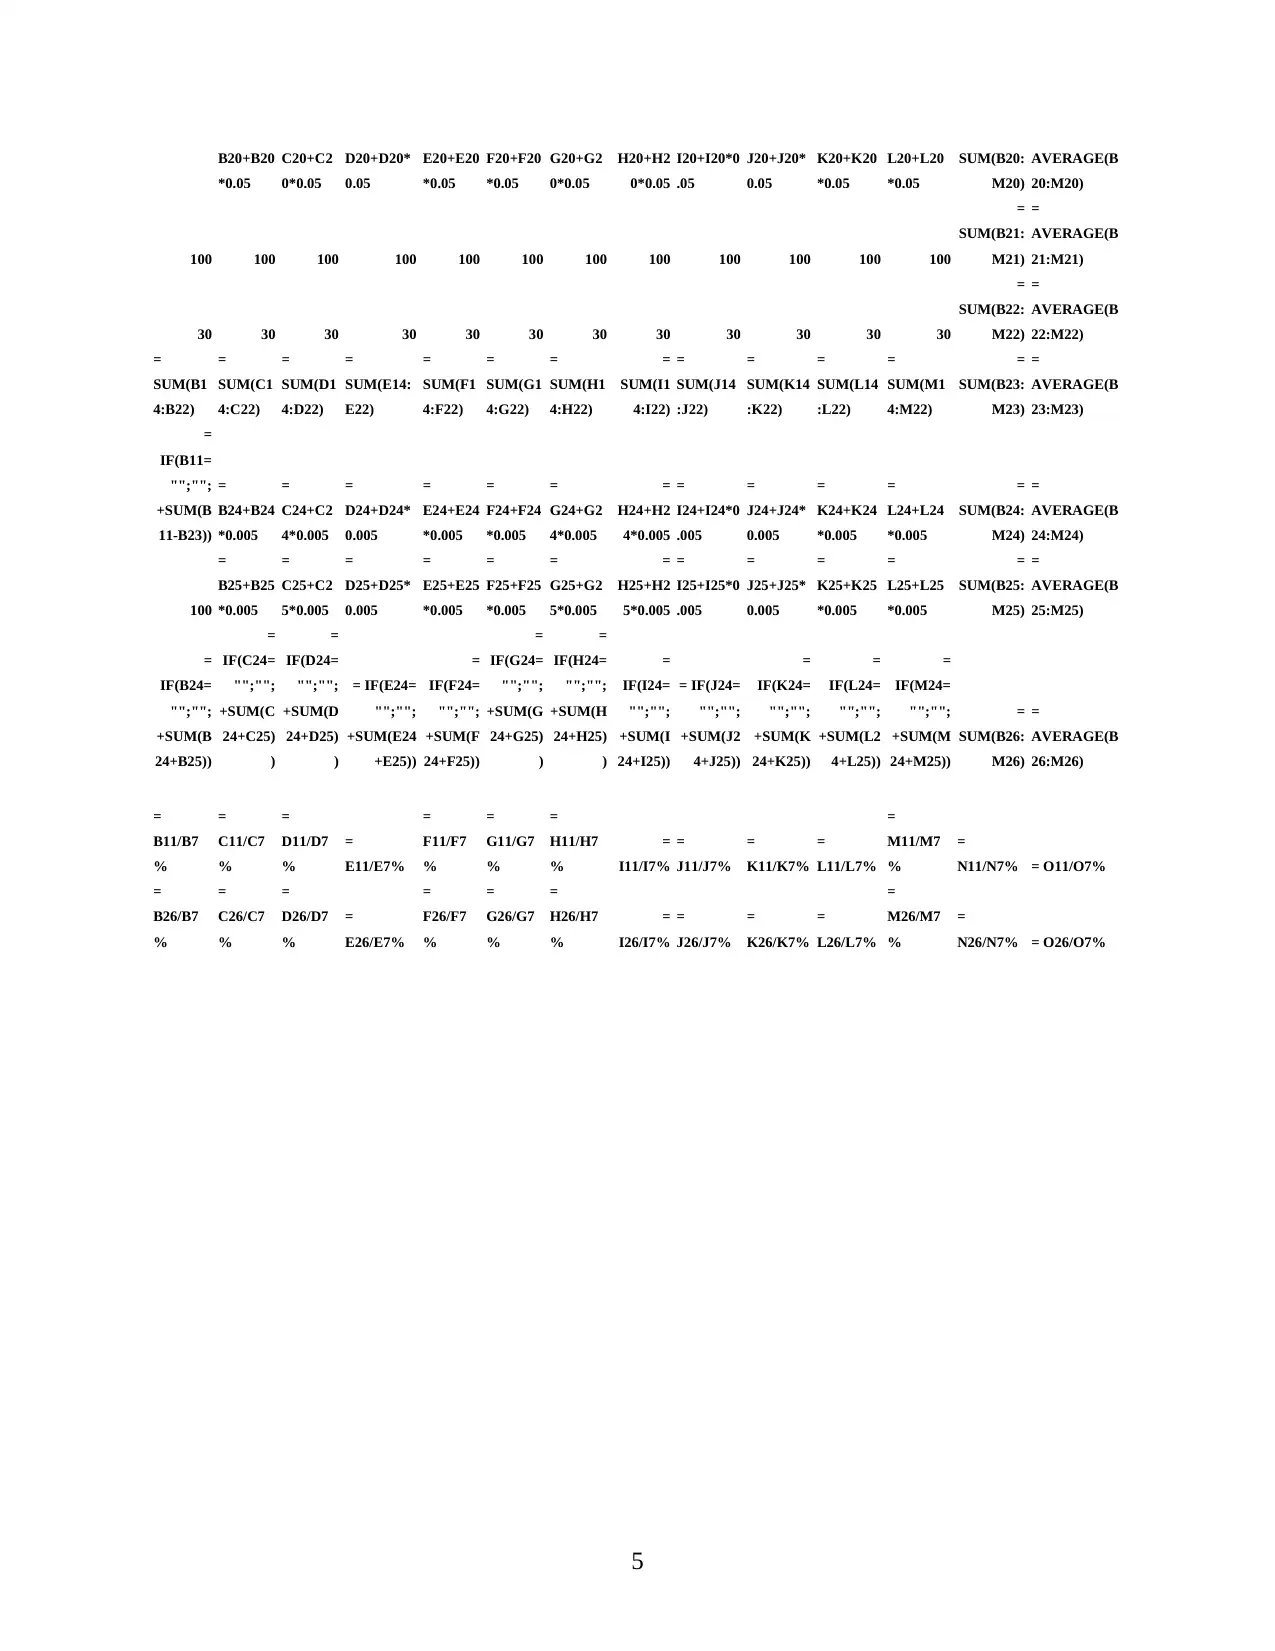
This report provides a detailed financial analysis of a UK convenience store, examining its sales and expenses over a 12-month period. The report begins with a brief description of the store's operations, highlighting its growth and the need for expansion. Task 1 presents the sales and expenses data, including a breakdown of investments in capital, stock, and operations, along with income source distributions. Task 2 delves into the spreadsheet design, explaining the use of formulas like auto-sum, average, and IF functions to ensure accurate calculations. The report includes charts such as pie charts for investment distribution, bar graphs for expenses, and line charts for income. An annexure provides the raw data in a tabular format, detailing monthly figures, totals, and averages for various income and expense categories, including sales, expenses, and profit margins. The report concludes with an analysis of the store's financial health and performance, providing insights into its potential for growth and expansion.
1 out of 7


Your All-in-One AI-Powered Toolkit for Academic Success.
+13062052269
info@desklib.com
Available 24*7 on WhatsApp / Email
![[object Object]](/_next/static/media/star-bottom.7253800d.svg)
Copyright © 2020–2026 A2Z Services. All Rights Reserved. Developed and managed by ZUCOL.