BTK3223: Cooling Water System Experiment Report, Semester II 2020/2021
VerifiedAdded on 2022/02/09
|11
|2987
|32
Practical Assignment
AI Summary
This report details an experiment conducted to investigate the performance of a cooling water system using a SOLTEQ Basic Cooling Tower Unit (Model: HE152). The experiment aimed to determine the relationship between cooling load and cooling range, focusing on the effects of varying cooling loads (0.5kW, 1.0kW, and 1.5kW) on the system's efficiency, range, and wet bulb approach. The methodology involved setting up the cooling tower, recording data such as air and water temperatures, flow rates, and heater power. The results showed that the cooling load is directly proportional to the range and inversely proportional to the approach, with higher cooling loads leading to increased range and efficiency. The report includes data tables, calculations, and a discussion of the findings, emphasizing the practical applications of cooling towers in various industries and their operational characteristics. The report provides a comprehensive analysis of the cooling water system, including data analysis and results.
PLANT UTILITIES
(BTK3223)
Semester II 2020/2021
Title of Experiment : COOLING WATER SYSTEM
Date of Experiment : 11/12/2021
Instructor’s Name : DR. ARMAN BIN ABDULLAH
TITLE
Name ID
1. CHOO CAI YUN KH19024
2. RAVIN RAJ A/L SIVANANDA KH19031
3. SEMBERATHI A/P SATHIA BALA KH18077
4. WAN NUR MURSYIDAH BINTI WAN ZAFRI KH19054
Group No. : 1
Section : 01G
Marks :
FACULTY OF CHEMICAL AND PROCESS ENGINEERING TECHNOLOGY
UNIVERSITI MALAYSIA PAHANG
Please keep for student reference.
Received by;
( )
Submitted by;
CAIYUN
(CHOO CAI YUN KH19024)CHOO CAI YUN KH19024 Date Submitted: 1/1/2022
Paraphrase This Document
Need a fresh take? Get an instant paraphrase of this document with our AI Paraphraser
ABSTRACT
A cooling tower is a specialized heat exchanger in which the air and water are being brought
into direct contact with each other to reduce the water’s temperature. A small volume of water
will be evaporated as this happens. Thus, reducing the temperature of the water being circulated
through the tower. This experiment is used to investigate the effect of colling load on ‘Wet
Bulb Approach’ and to operate the colling water system. Firstly, the cooling tower was started
by setting the temperature of the controller. The heater is then switched on and the water is
then heated up until the set temperature. Next, the reading of the system was set up, where the
reading of water flow rate and air flow was started. Lastly, after the system stabilizes, the
reading of air inlet dry bulb and wet bulb temperature, water outlet temperature, orifice
differential pressure, water flow rate and heater power were recorded. The mean value for the
calculation and analysis was obtained. The results obtained from this experiment is based on
0kW, 0.5kW, 1.0kW and 1.5kW respectively. However, result for 0kW was not used in the
report as this is just for recorded purpose and does not involve in any of the calculations. For
the air inlet dry bulb, T1, the results were 30.4 , 30.6 and 31 respectively. For the air℃ ℃ ℃
inlet wet bulb, T2, the results were 30.2 , 30.6 and 31 respectively. For the water inlet℃ ℃ ℃
temperature, T5, the results were 31.2 , 35.4 and 38.8 respectively. For the water outlet℃ ℃ ℃
temperature, T6, the results were26.7 , 28.4 and 30.2 respectively. The water flow rate,℃ ℃ ℃
FT 2 is 1.5 for 0.5kW, 1.0kW and 1.5kW respectively. For the heater power, Q1, the results
were 0, 0.5, 1.0 and 1.5 respectively. The total cooling load ranges from 1.3kW to 2.3kW. The
approach to wet bulb ranges from 1 to 3.5 . the cooling tower efficiency has the values of℃ ℃
from 56.25%, 76.08% and 89.79%. From the result, the higher the cooling load, the higher the
range. Also, the efficiency is directly proportional to the range and inversely proportional to
the approach. In short, the cold water temperature should theoretically be the same as the wet
bulb temperature, but this is impossible because it requires a very large cooling tower. The
efficiency of the cooling tower varies from 70% to 75% in reality. This may be because the
blades of the fans overcome the system resistance, which is called pressure loss, to move the
air, or the nozzle are slightly blocked or old.
INTRODUCTION
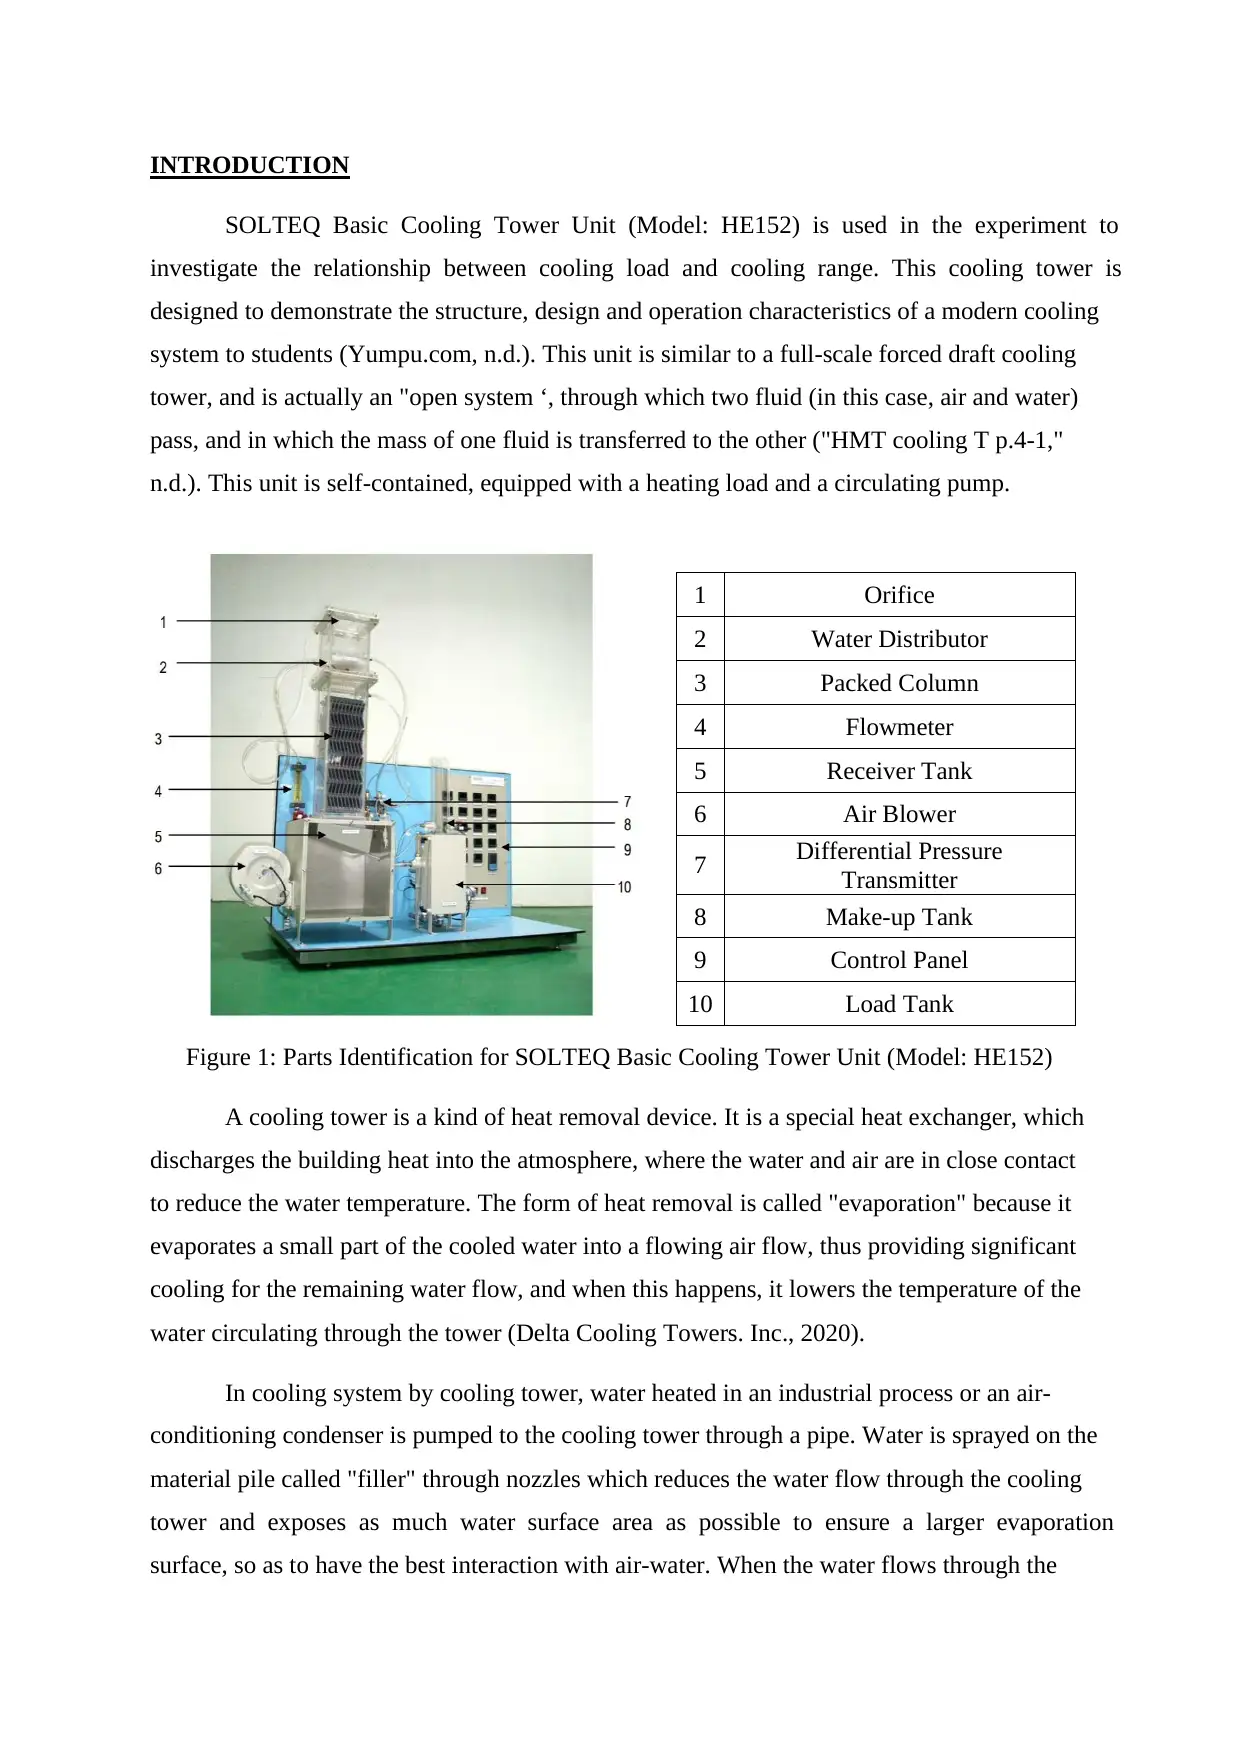
SOLTEQ Basic Cooling Tower Unit (Model: HE152) is used in the experiment to
investigate the relationship between cooling load and cooling range. This cooling tower is
designed to demonstrate the structure, design and operation characteristics of a modern cooling
system to students (Yumpu.com, n.d.). This unit is similar to a full-scale forced draft cooling
tower, and is actually an "open system ‘, through which two fluid (in this case, air and water)
pass, and in which the mass of one fluid is transferred to the other ("HMT cooling T p.4-1,"
n.d.). This unit is self-contained, equipped with a heating load and a circulating pump.
Figure 1: Parts Identification for SOLTEQ Basic Cooling Tower Unit (Model: HE152)
A cooling tower is a kind of heat removal device. It is a special heat exchanger, which
discharges the building heat into the atmosphere, where the water and air are in close contact
to reduce the water temperature. The form of heat removal is called "evaporation" because it
evaporates a small part of the cooled water into a flowing air flow, thus providing significant
cooling for the remaining water flow, and when this happens, it lowers the temperature of the
water circulating through the tower (Delta Cooling Towers. Inc., 2020).
In cooling system by cooling tower, water heated in an industrial process or an air-
conditioning condenser is pumped to the cooling tower through a pipe. Water is sprayed on the
material pile called "filler" through nozzles which reduces the water flow through the cooling
tower and exposes as much water surface area as possible to ensure a larger evaporation
surface, so as to have the best interaction with air-water. When the water flows through the
1 Orifice
2 Water Distributor
3 Packed Column
4 Flowmeter
5 Receiver Tank
6 Air Blower
7 Differential Pressure
Transmitter
8 Make-up Tank
9 Control Panel
10 Load Tank
⊘ This is a preview!⊘
Do you want full access?
Subscribe today to unlock all pages.
Trusted by 1+ million students worldwide
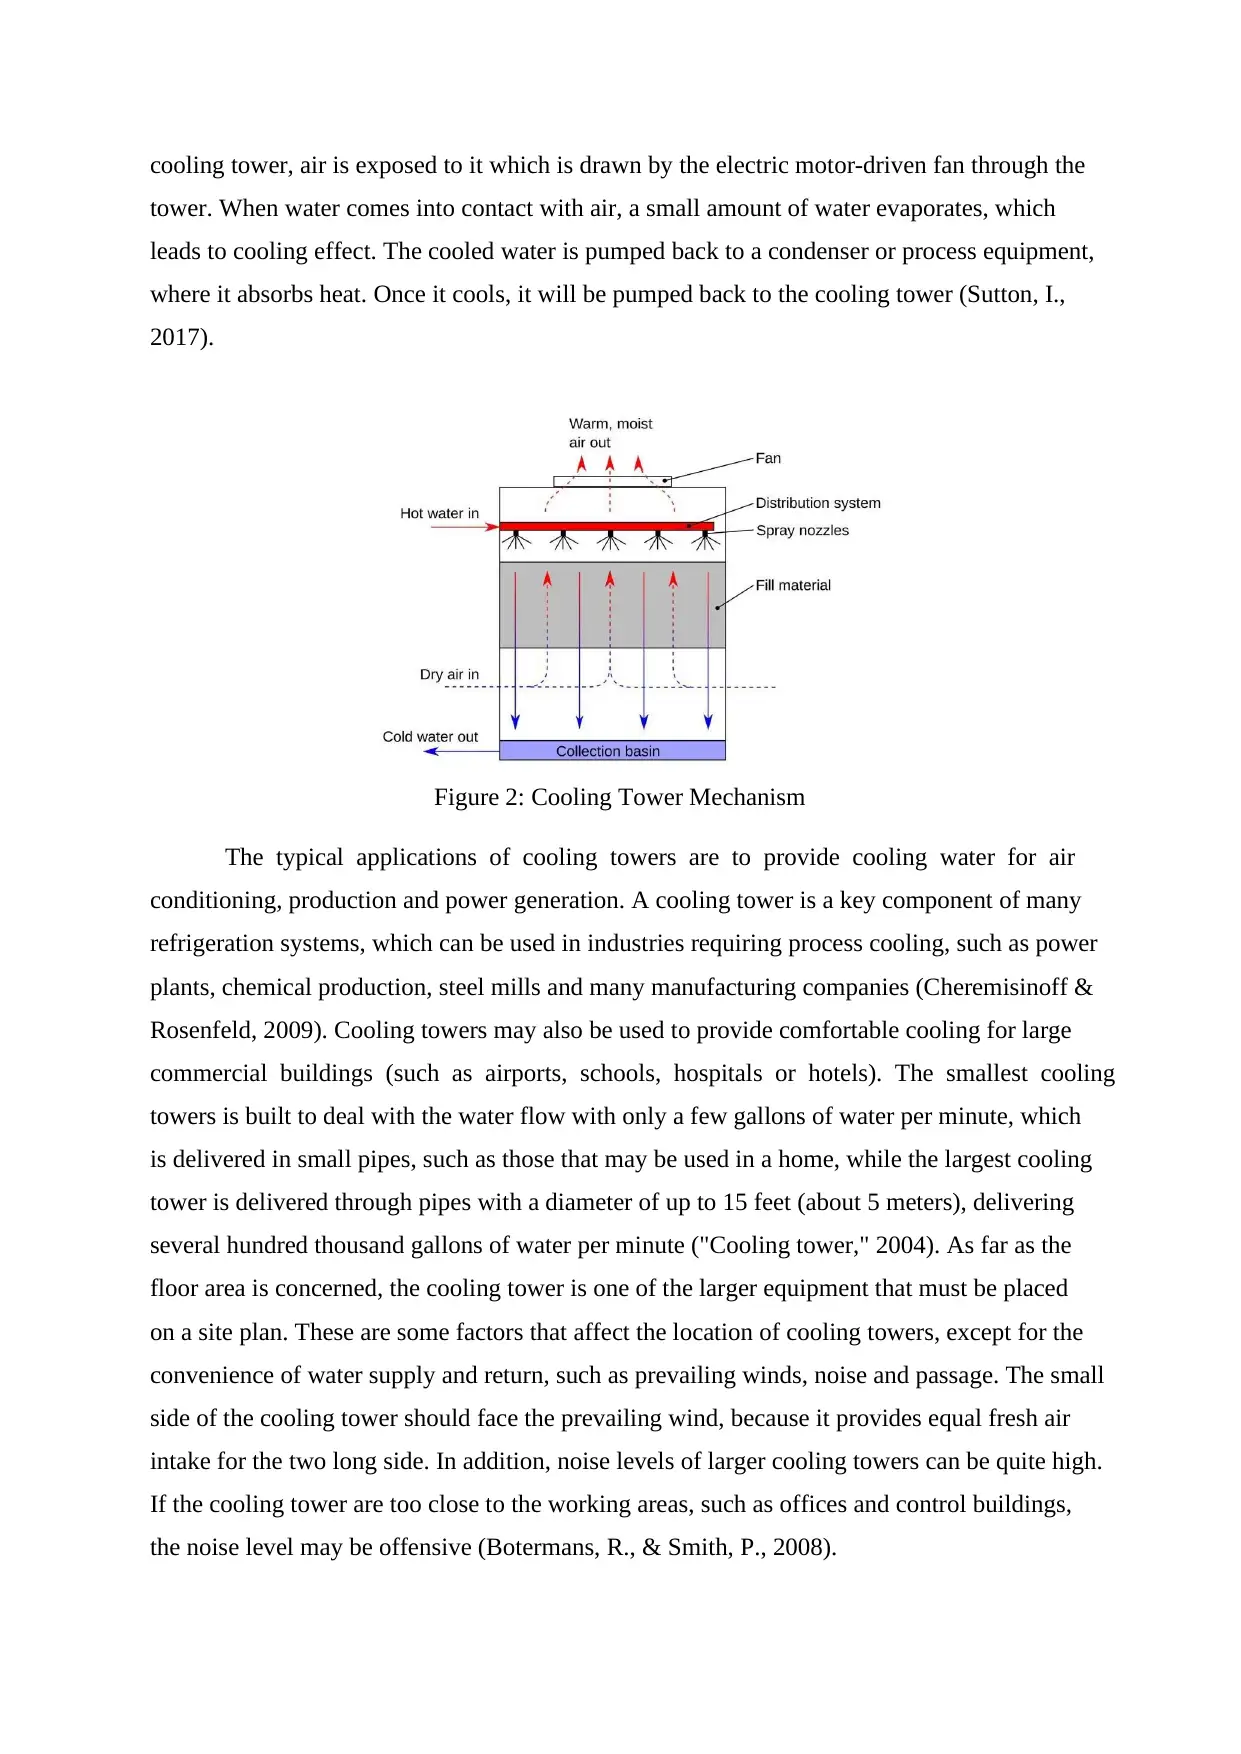
cooling tower, air is exposed to it which is drawn by the electric motor-driven fan through the
tower. When water comes into contact with air, a small amount of water evaporates, which
leads to cooling effect. The cooled water is pumped back to a condenser or process equipment,
where it absorbs heat. Once it cools, it will be pumped back to the cooling tower (Sutton, I.,
2017).
Figure 2: Cooling Tower Mechanism
The typical applications of cooling towers are to provide cooling water for air
conditioning, production and power generation. A cooling tower is a key component of many
refrigeration systems, which can be used in industries requiring process cooling, such as power
plants, chemical production, steel mills and many manufacturing companies (Cheremisinoff &
Rosenfeld, 2009). Cooling towers may also be used to provide comfortable cooling for large
commercial buildings (such as airports, schools, hospitals or hotels). The smallest cooling
towers is built to deal with the water flow with only a few gallons of water per minute, which
is delivered in small pipes, such as those that may be used in a home, while the largest cooling
tower is delivered through pipes with a diameter of up to 15 feet (about 5 meters), delivering
several hundred thousand gallons of water per minute ("Cooling tower," 2004). As far as the
floor area is concerned, the cooling tower is one of the larger equipment that must be placed
on a site plan. These are some factors that affect the location of cooling towers, except for the
convenience of water supply and return, such as prevailing winds, noise and passage. The small
side of the cooling tower should face the prevailing wind, because it provides equal fresh air
intake for the two long side. In addition, noise levels of larger cooling towers can be quite high.
If the cooling tower are too close to the working areas, such as offices and control buildings,
the noise level may be offensive (Botermans, R., & Smith, P., 2008).
Paraphrase This Document
Need a fresh take? Get an instant paraphrase of this document with our AI Paraphraser
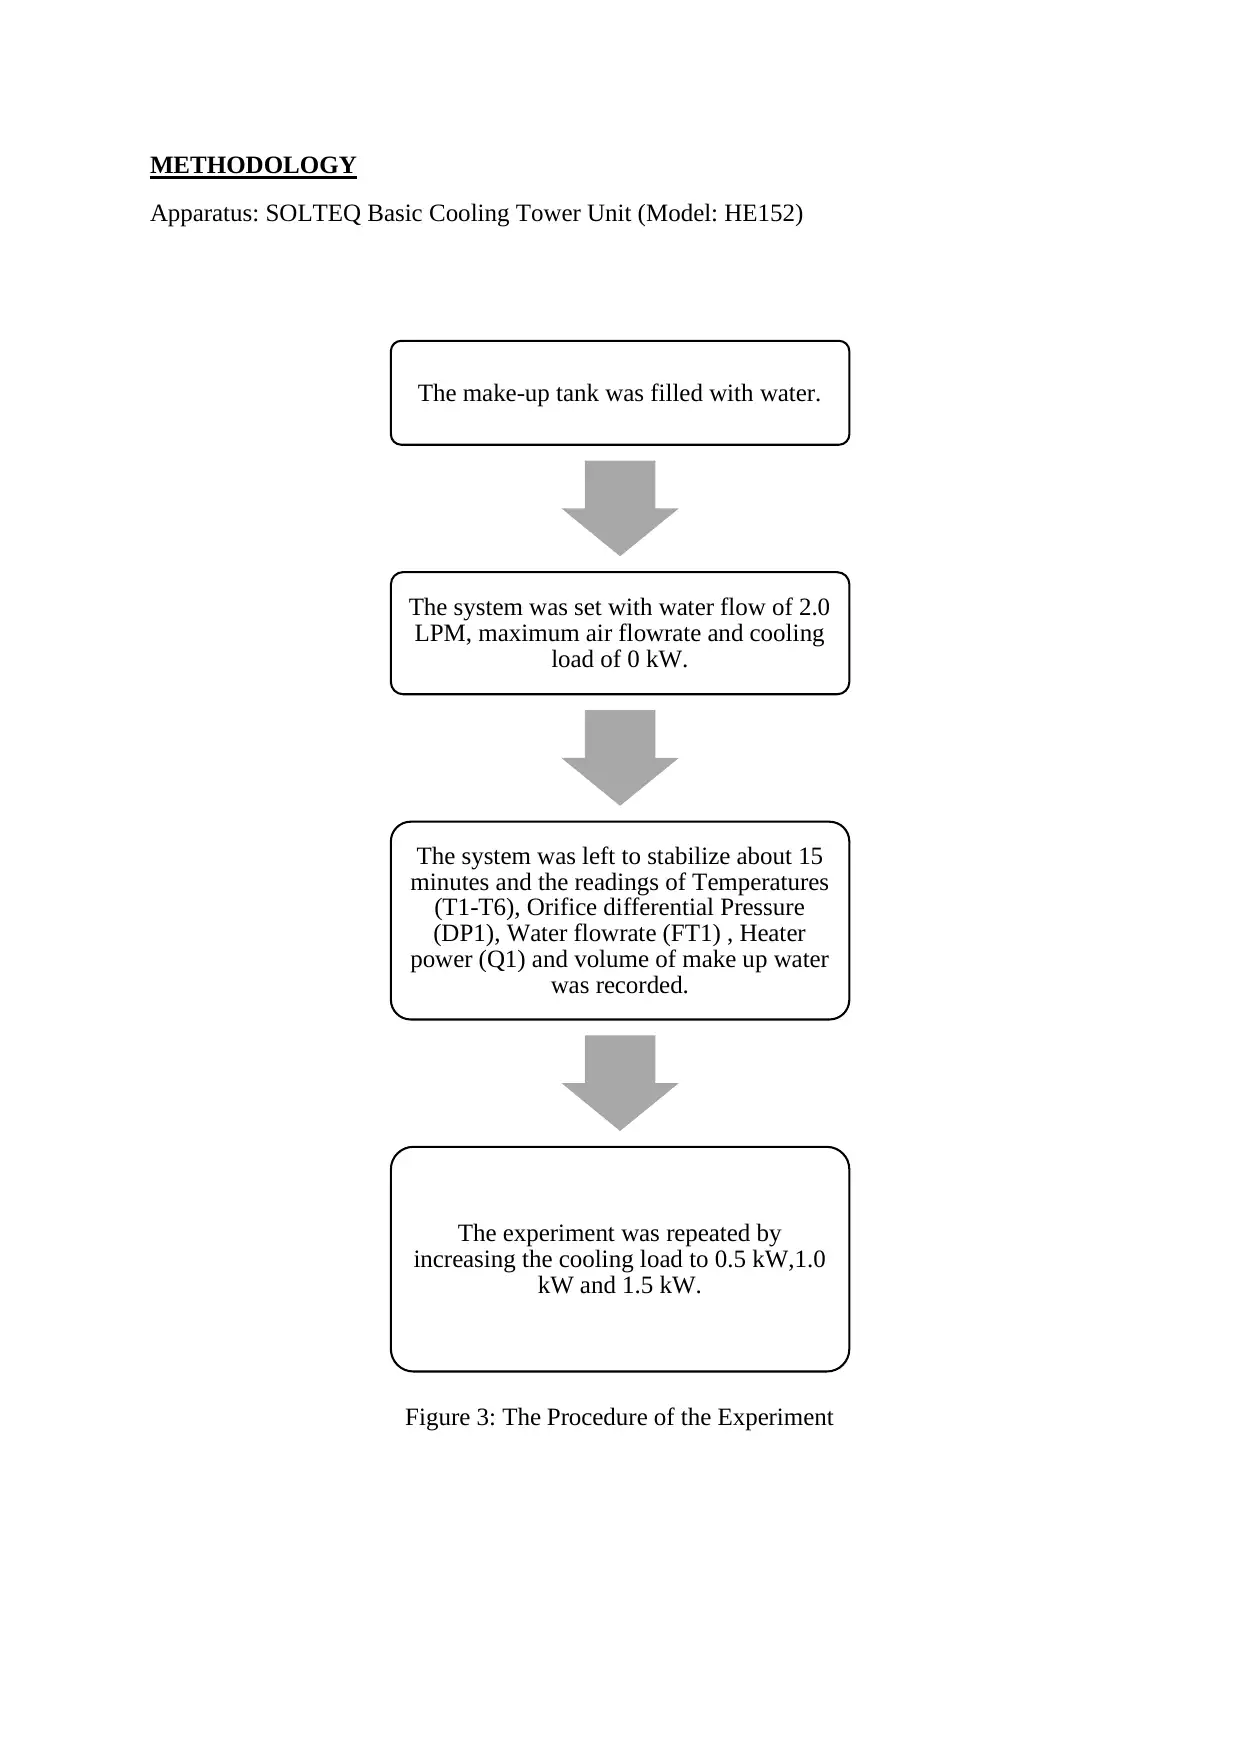
METHODOLOGY
Apparatus: SOLTEQ Basic Cooling Tower Unit (Model: HE152)
Figure 3: The Procedure of the Experiment
The make-up tank was filled with water.
The system was set with water flow of 2.0
LPM, maximum air flowrate and cooling
load of 0 kW.
The system was left to stabilize about 15
minutes and the readings of Temperatures
(T1-T6), Orifice differential Pressure
(DP1), Water flowrate (FT1) , Heater
power (Q1) and volume of make up water
was recorded.
The experiment was repeated by
increasing the cooling load to 0.5 kW,1.0
kW and 1.5 kW.
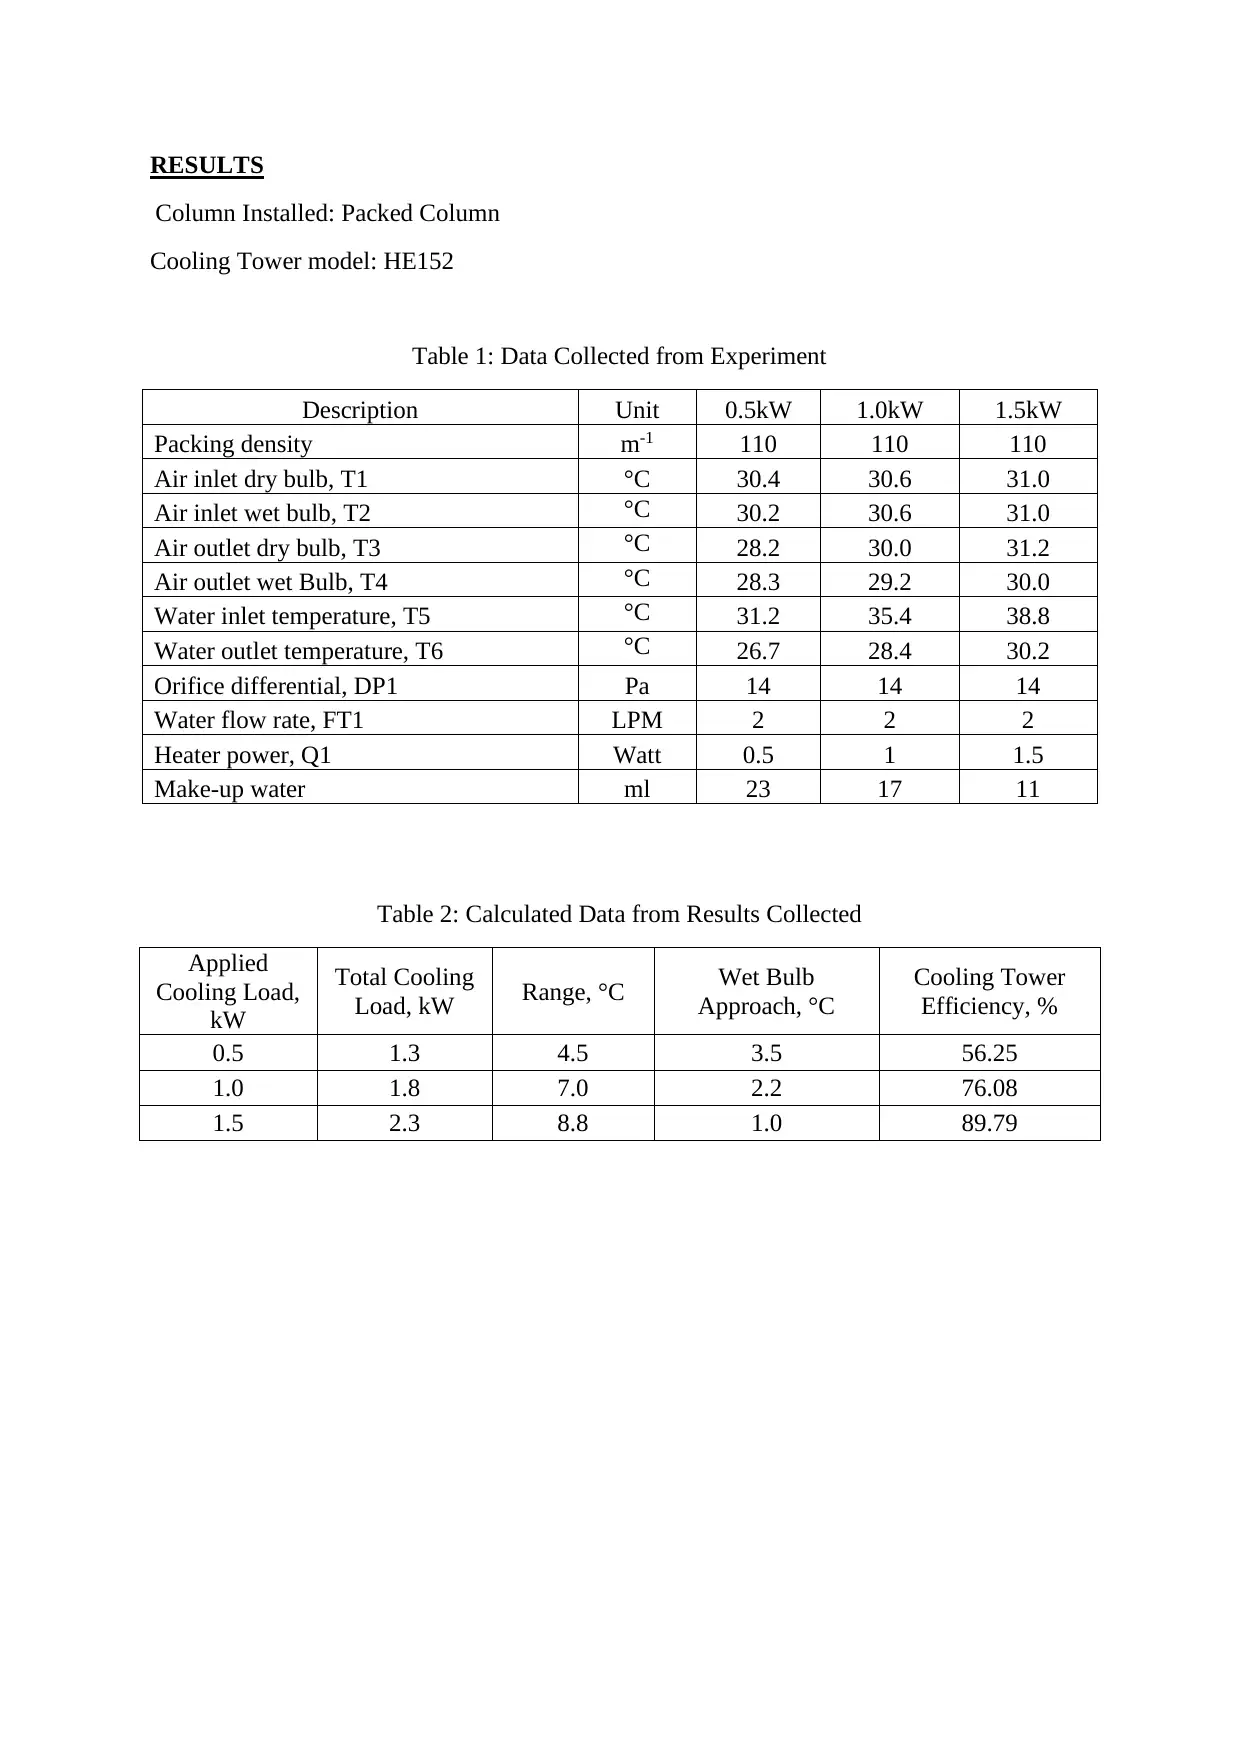
RESULTS
Column Installed: Packed Column
Cooling Tower model: HE152
Table 1: Data Collected from Experiment
Description Unit 0.5kW 1.0kW 1.5kW
Packing density m-1 110 110 110
Air inlet dry bulb, T1 °C 30.4 30.6 31.0
Air inlet wet bulb, T2 °C 30.2 30.6 31.0
Air outlet dry bulb, T3 °C 28.2 30.0 31.2
Air outlet wet Bulb, T4 °C 28.3 29.2 30.0
Water inlet temperature, T5 °C 31.2 35.4 38.8
Water outlet temperature, T6 °C 26.7 28.4 30.2
Orifice differential, DP1 Pa 14 14 14
Water flow rate, FT1 LPM 2 2 2
Heater power, Q1 Watt 0.5 1 1.5
Make-up water ml 23 17 11
Table 2: Calculated Data from Results Collected
Applied
Cooling Load,
kW
Total Cooling
Load, kW Range, °C Wet Bulb
Approach, °C
Cooling Tower
Efficiency, %
0.5 1.3 4.5 3.5 56.25
1.0 1.8 7.0 2.2 76.08
1.5 2.3 8.8 1.0 89.79
⊘ This is a preview!⊘
Do you want full access?
Subscribe today to unlock all pages.
Trusted by 1+ million students worldwide
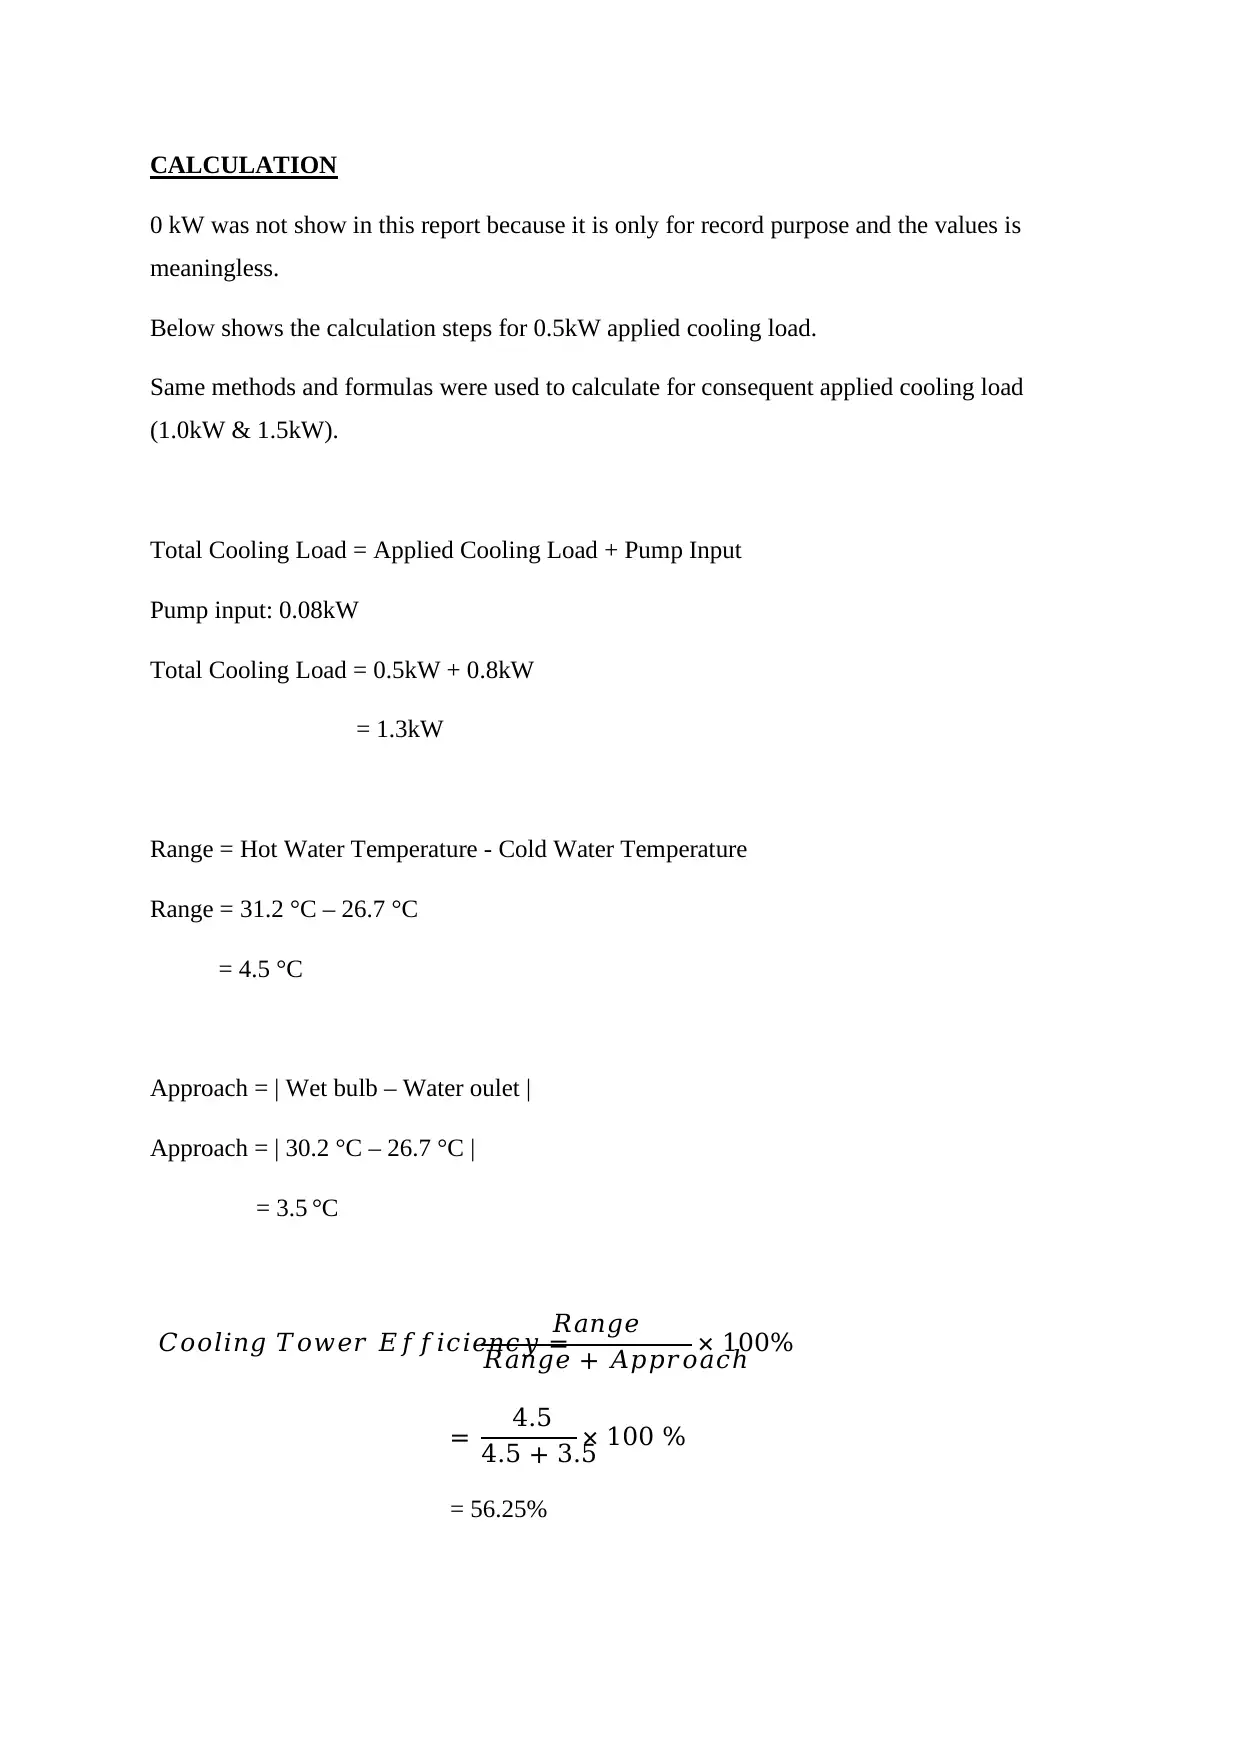
CALCULATION
0 kW was not show in this report because it is only for record purpose and the values is
meaningless.
Below shows the calculation steps for 0.5kW applied cooling load.
Same methods and formulas were used to calculate for consequent applied cooling load
(1.0kW & 1.5kW).
Total Cooling Load = Applied Cooling Load + Pump Input
Pump input: 0.08kW
Total Cooling Load = 0.5kW + 0.8kW
= 1.3kW
Range = Hot Water Temperature - Cold Water Temperature
Range = 31.2 °C – 26.7 °C
= 4.5 °C
Approach = | Wet bulb – Water oulet |
Approach = | 30.2 °C – 26.7 °C |
= 3.5 °C
𝐶𝑜𝑜𝑙𝑖𝑛𝑔 𝑇𝑜𝑤𝑒𝑟 𝐸𝑓𝑓𝑖𝑐𝑖𝑒𝑛𝑐𝑦 =
𝑅𝑎𝑛𝑔𝑒
𝑅𝑎𝑛𝑔𝑒 + 𝐴𝑝𝑝𝑟𝑜𝑎𝑐ℎ
× 100%
= 4.5
4.5 + 3.5
× 100 %
= 56.25%
Paraphrase This Document
Need a fresh take? Get an instant paraphrase of this document with our AI Paraphraser
DISCUSSION
Based on the results of this experiment the relationship between cooling load and
cooling range was investigated. The cooling tower systems work by using water to extract heat
from a system and ejecting it into the atmosphere through evaporation. The three main
components of a cooling system are the cooling tower, recirculating pump, and heat exchanger.
Water first passes through a heat exchanger where it absorbs the heat. The water is then
distributed over the top of the cooling tower where air travels past the warm water causing a
portion of the water to be evaporated. Packed column is used in this experiment because it
ensures maximum contact between air and water to enable cooling (American Society of
Heating; Refrigerating and Air-Conditioning Engineers, 2009).
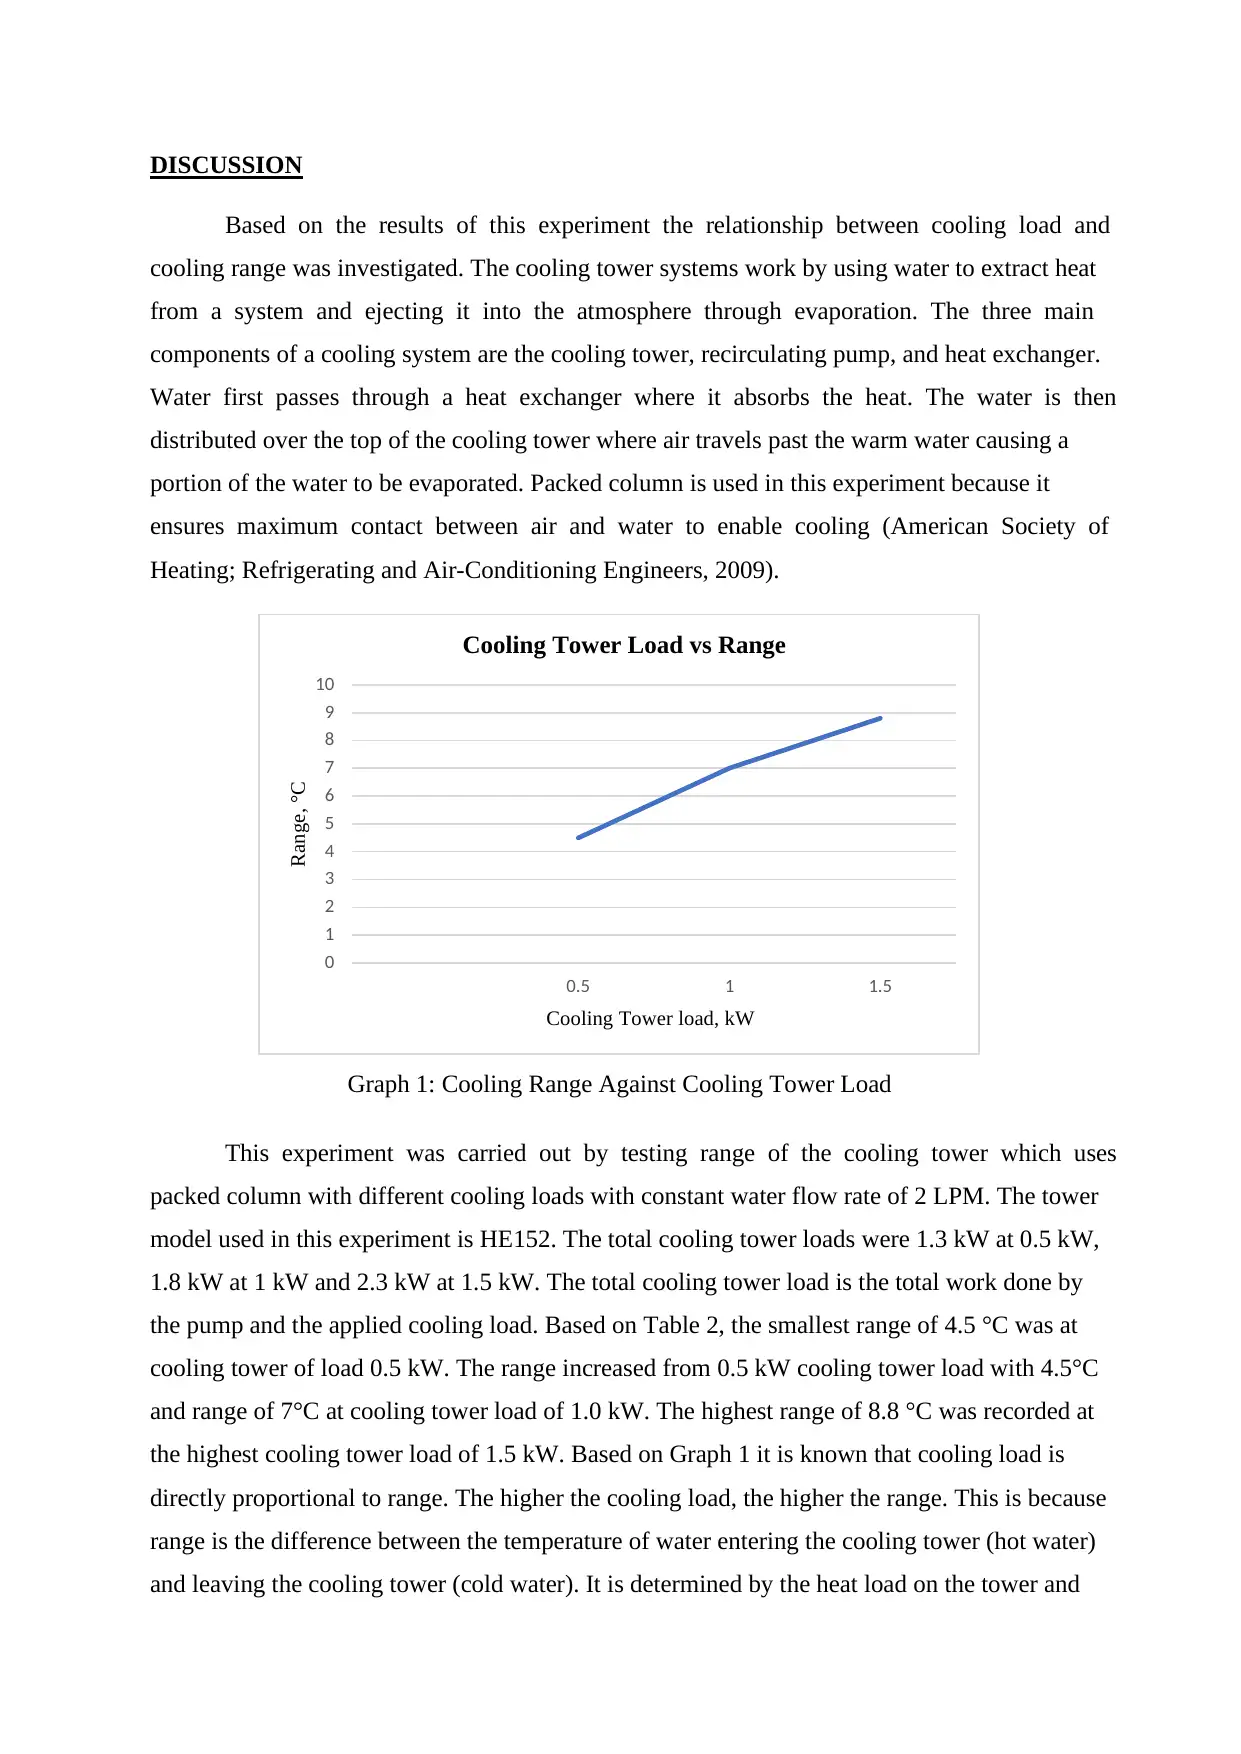
Graph 1: Cooling Range Against Cooling Tower Load
This experiment was carried out by testing range of the cooling tower which uses
packed column with different cooling loads with constant water flow rate of 2 LPM. The tower
model used in this experiment is HE152. The total cooling tower loads were 1.3 kW at 0.5 kW,
1.8 kW at 1 kW and 2.3 kW at 1.5 kW. The total cooling tower load is the total work done by
the pump and the applied cooling load. Based on Table 2, the smallest range of 4.5 °C was at
cooling tower of load 0.5 kW. The range increased from 0.5 kW cooling tower load with 4.5°C
and range of 7°C at cooling tower load of 1.0 kW. The highest range of 8.8 °C was recorded at
the highest cooling tower load of 1.5 kW. Based on Graph 1 it is known that cooling load is
directly proportional to range. The higher the cooling load, the higher the range. This is because
range is the difference between the temperature of water entering the cooling tower (hot water)
and leaving the cooling tower (cold water). It is determined by the heat load on the tower and
0
1
2
3
4
5
6
7
8
9
10
0.5 1 1.5
Range, °C
Cooling Tower load, kW
Cooling Tower Load vs Range
Based on the results of this experiment the relationship between cooling load and
cooling range was investigated. The cooling tower systems work by using water to extract heat
from a system and ejecting it into the atmosphere through evaporation. The three main
components of a cooling system are the cooling tower, recirculating pump, and heat exchanger.
Water first passes through a heat exchanger where it absorbs the heat. The water is then
distributed over the top of the cooling tower where air travels past the warm water causing a
portion of the water to be evaporated. Packed column is used in this experiment because it
ensures maximum contact between air and water to enable cooling (American Society of
Heating; Refrigerating and Air-Conditioning Engineers, 2009).
Graph 1: Cooling Range Against Cooling Tower Load
This experiment was carried out by testing range of the cooling tower which uses
packed column with different cooling loads with constant water flow rate of 2 LPM. The tower
model used in this experiment is HE152. The total cooling tower loads were 1.3 kW at 0.5 kW,
1.8 kW at 1 kW and 2.3 kW at 1.5 kW. The total cooling tower load is the total work done by
the pump and the applied cooling load. Based on Table 2, the smallest range of 4.5 °C was at
cooling tower of load 0.5 kW. The range increased from 0.5 kW cooling tower load with 4.5°C
and range of 7°C at cooling tower load of 1.0 kW. The highest range of 8.8 °C was recorded at
the highest cooling tower load of 1.5 kW. Based on Graph 1 it is known that cooling load is
directly proportional to range. The higher the cooling load, the higher the range. This is because
range is the difference between the temperature of water entering the cooling tower (hot water)
and leaving the cooling tower (cold water). It is determined by the heat load on the tower and
0
1
2
3
4
5
6
7
8
9
10
0.5 1 1.5
Range, °C
Cooling Tower load, kW
Cooling Tower Load vs Range
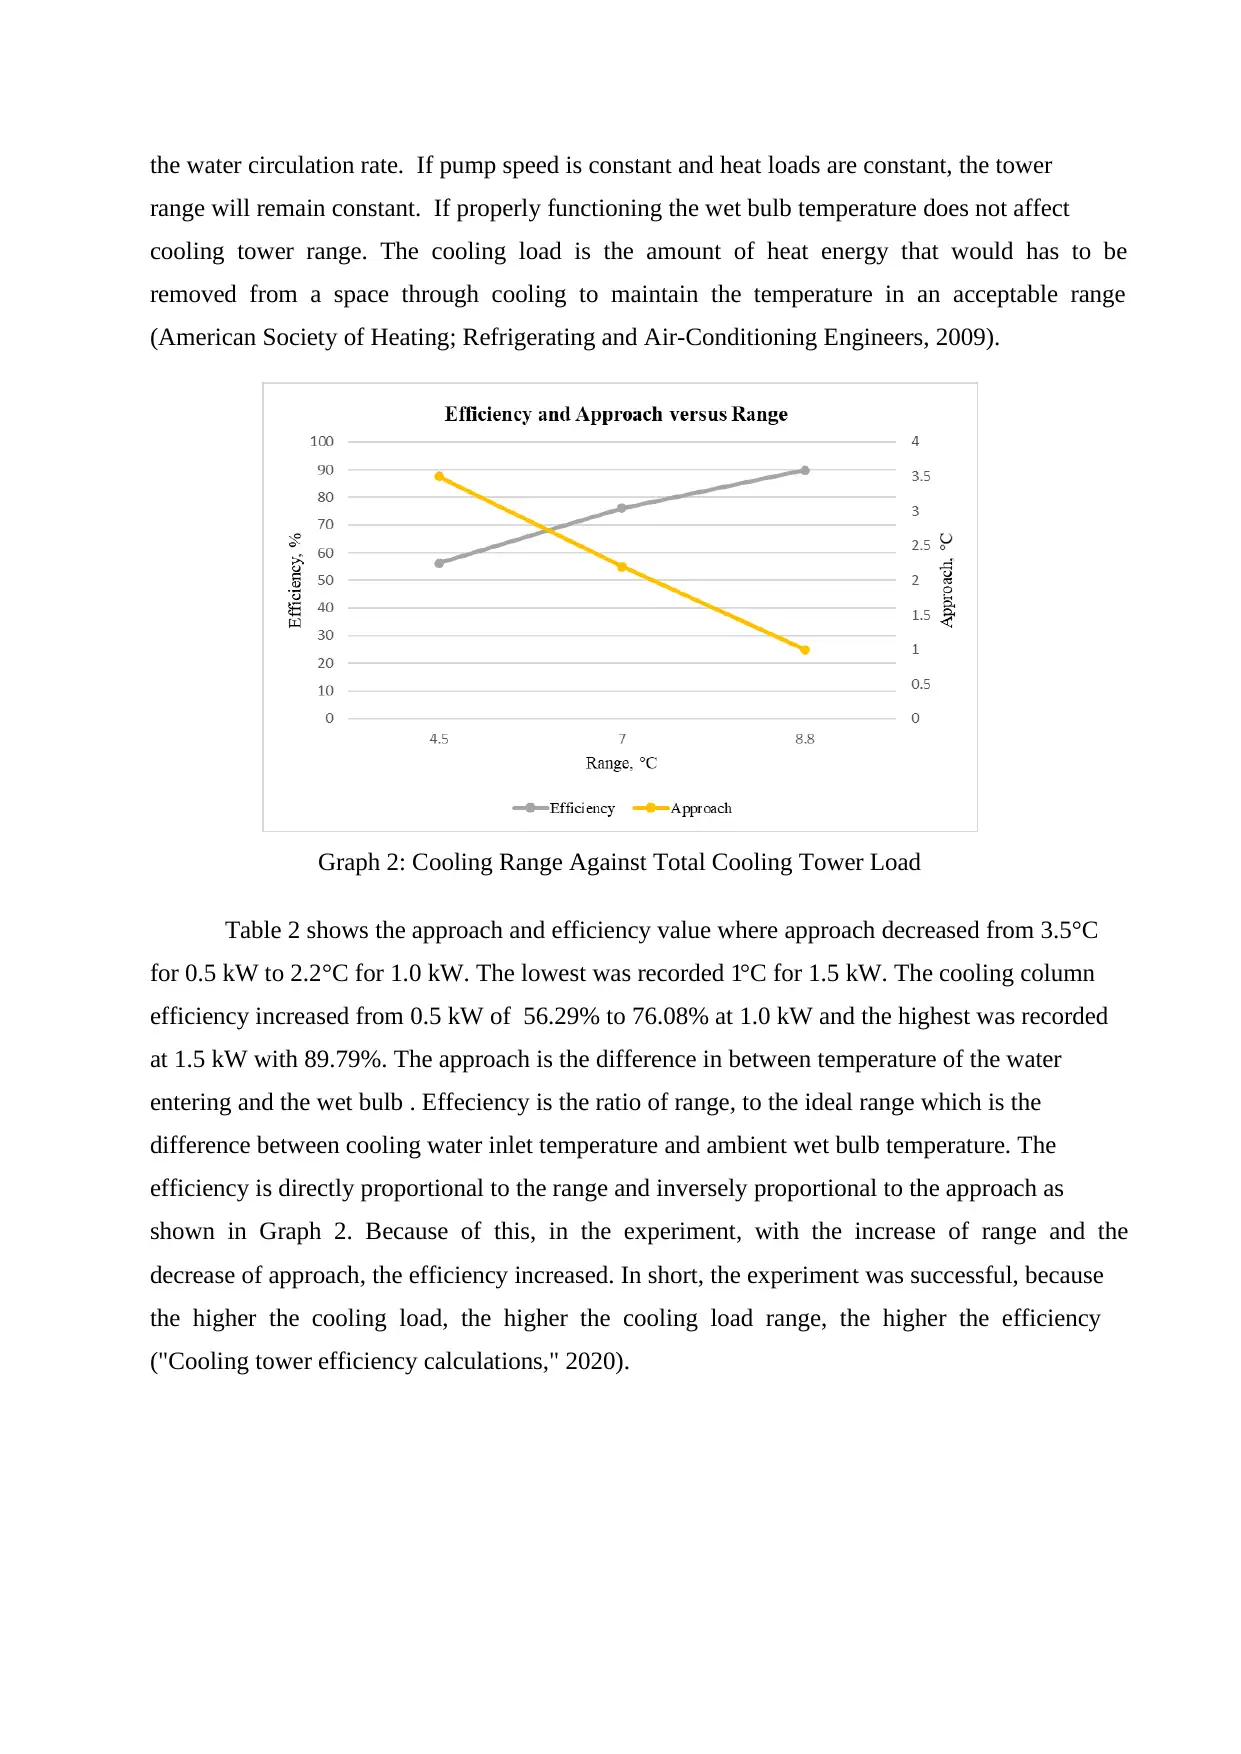
the water circulation rate. If pump speed is constant and heat loads are constant, the tower
range will remain constant. If properly functioning the wet bulb temperature does not affect
cooling tower range. The cooling load is the amount of heat energy that would has to be
removed from a space through cooling to maintain the temperature in an acceptable range
(American Society of Heating; Refrigerating and Air-Conditioning Engineers, 2009).
Graph 2: Cooling Range Against Total Cooling Tower Load
Table 2 shows the approach and efficiency value where approach decreased from 3.5°C
for 0.5 kW to 2.2°C for 1.0 kW. The lowest was recorded 1°C for 1.5 kW. The cooling column
efficiency increased from 0.5 kW of 56.29% to 76.08% at 1.0 kW and the highest was recorded
at 1.5 kW with 89.79%. The approach is the difference in between temperature of the water
entering and the wet bulb . Effeciency is the ratio of range, to the ideal range which is the
difference between cooling water inlet temperature and ambient wet bulb temperature. The
efficiency is directly proportional to the range and inversely proportional to the approach as
shown in Graph 2. Because of this, in the experiment, with the increase of range and the
decrease of approach, the efficiency increased. In short, the experiment was successful, because
the higher the cooling load, the higher the cooling load range, the higher the efficiency
("Cooling tower efficiency calculations," 2020).
⊘ This is a preview!⊘
Do you want full access?
Subscribe today to unlock all pages.
Trusted by 1+ million students worldwide
CONCLUSION
In conclusion, the experiment was successful in determining the relationship between
cooling load and cooling range. The cooling load is proportional to the measuring range.
Therefore, the higher the cooling load is, the larger the range is. Besides that, efficiency is
directly proportional to the range and inversely proportional to the approach. Because of this,
in the experiment, with the increase of range and the decrease of approach, the efficiency
increased. However, theoretically, under ideal conditions, the temperature of cold water should
be the same as that of the wet bulb, but a very large cooling tower is needed to realize this.
Realistically, normal cooling towers have an efficiency of between 70 and 75%. This may also
be due to the fan blades overcoming the resistance of the equipment, which is called pressure
loss to transfer the air. The nozzle may be slightly blocked or obsolete, and the cooling tower
may need to be replaced to obtain better performance.
As a recommendation, the quality of water must be taken into consideration to ensure
the properties dependability and the cooling equipment's appropriate operation according to
the manufacturer's specifications (Hensley, n.d). The cooling water performance should be
based on reducing discharge while not exceeding the saturation limits or corrosive properties
of the minerals dissolved in the make-up water, while also considering the operating pH and
system temperatures. This cooling system can reduce the system losses and remove
unnecessary losses by inspections and repair of the components of the system that are not
working properly. In order to avoid this, it is to be ensured that no damaged or incomplete drift
removers, broken or malfunctioning level controls and broken or malfunctioning distribution
decks in the tower to obtain the correct reading from system. Lastly, the average reading is
obtained to get an accurate reading (Hensley, n.d).
Paraphrase This Document
Need a fresh take? Get an instant paraphrase of this document with our AI Paraphraser
REFERENCES
American Society of Heating; Refrigerating and Air-Conditioning Engineers.
(2009). ASHRAE handbook, 2009: Fundamentals.
Botermans, R., & Smith, P. (2008). Cooling towers. Advanced Piping Design, 177-
182. https://doi.org/10.1016/b978-1-933762-18-0.50016-7
Cheremisinoff, N. P., & Rosenfeld, P. E. (2009). Handbook of pollution prevention and
cleaner production Vol. 1: Best practices in the petroleum industry. William Andrew.
Cooling tower efficiency calculations. (2020, October 27). Chemical Engineering Site.
Retrieved December 31, 2021, from https://chemicalengineeringsite.in/cooling-tower-
efficiency-calculations/
Cooling tower. (2004, June 24). Wikipedia, the free encyclopedia. Retrieved January 1, 2022,
from https://en.wikipedia.org/wiki/Cooling_tower
ER. Anil, (2014) ,Cooling tower highlights, Calculation refference
https://www.igef.net/images/innovation/project-highlights-cooling-tower.pdf
Hensley, J. C. (n.d.). Cooling Tower Fundamentals Compiled from the knowledge and
experience of the entire SPX Cooling Technologies staff. Edited by.
HMT cooling T p.4-1. (n.d.). Scribd. https://www.scribd.com/document/480870645/HMT-
cooling-T-p-4-1
Sutton, I. (2017). Equipment and buildings. Plant Design and Operations, 73-
137. https://doi.org/10.1016/b978-0-12-812883-1.00003-6
Yumpu.com. (n.d.). HE 152 - Solution engineering.
yumpu.com. https://www.yumpu.com/en/document/read/36827325/he-152-solution-
engineering
1 out of 11
Related Documents


Your All-in-One AI-Powered Toolkit for Academic Success.
+13062052269
info@desklib.com
Available 24*7 on WhatsApp / Email
![[object Object]](/_next/static/media/star-bottom.7253800d.svg)
Unlock your academic potential
Copyright © 2020–2026 A2Z Services. All Rights Reserved. Developed and managed by ZUCOL.