HI5020 Corporate Accounting: Ausdrill & Rio Tinto Financial Comparison
VerifiedAdded on 2023/06/08
|19
|4875
|228
Report
AI Summary
This report provides a comprehensive financial analysis of Ausdrill Ltd and Rio Tinto Ltd, two companies in the mining industry listed on the Australian Securities Exchange (ASX). The analysis covers a three-year period, focusing on key elements of their financial statements, including owner's equity, capital structure, cash flow statements, other comprehensive income, and income tax accounting. A comparative analysis is conducted to highlight the differences in financial reporting and performance between the two companies, particularly in areas such as debt and equity capital usage, cash flow management, and effective tax rates. The report also includes calculations and explanations of deferred tax assets and liabilities, as well as a comparison of cash tax rates and book tax rates for both companies.
Running head: CORPORATE ACCOUNTING
Corporate Accounting
Name of the Student:
Name of the University:
Author’s Note:
Corporate Accounting
Name of the Student:
Name of the University:
Author’s Note:
Paraphrase This Document
Need a fresh take? Get an instant paraphrase of this document with our AI Paraphraser
1
CORPORATE ACCOUNTING
Executive Summary
The main purpose of this assessment is to analyze the financial statements of two companies for
a period of three years. The companies which are selected for this assessment are Ausdrill ltd and
Rio Tinto Ltd. The assessment analyzes different elements which are disclosed in the annual
report such as Income tax expenses. The assessment analyzes in dept the cash flow statement of
both the companies in order to under the cash flows of the business during the year. The
assessment conducts a comparative analysis of the cash flow statement between Ausdrill ltd and
Rio Tinto Ltd. The assessment also contains calculations of Effective tax rate and Cash and Book
tax rates and also an explanation of the tax expenses and tax structure of both the companies.
2
CORPORATE ACCOUNTING
Table of Contents
Introduction......................................................................................................................................3
Discussion........................................................................................................................................4
Owner’s Equity............................................................................................................................4
Capital Structure Position of Both the Companies......................................................................5
Cash Flow Statement Analysis....................................................................................................7
Comparative Analysis of Three Components of Cash Flow Statement....................................10
Insight of Cash flow Statement..................................................................................................11
Analysis of Other Comprehensive Income Statement...................................................................11
Reporting of Comprehensive Items...........................................................................................12
Comparative Analysis of Comprehensive Items.......................................................................12
Accounting for Income Tax.......................................................................................................13
Effective Tax Rate.....................................................................................................................13
Deferred Tax Assets and Liabilities..........................................................................................14
Cash Tax Amount and Rate of Both Company.........................................................................15
Difference Between Cash Tax Rate and Book Tax Rate...........................................................15
Reference.......................................................................................................................................16
⊘ This is a preview!⊘
Do you want full access?
Subscribe today to unlock all pages.
Trusted by 1+ million students worldwide
3
CORPORATE ACCOUNTING
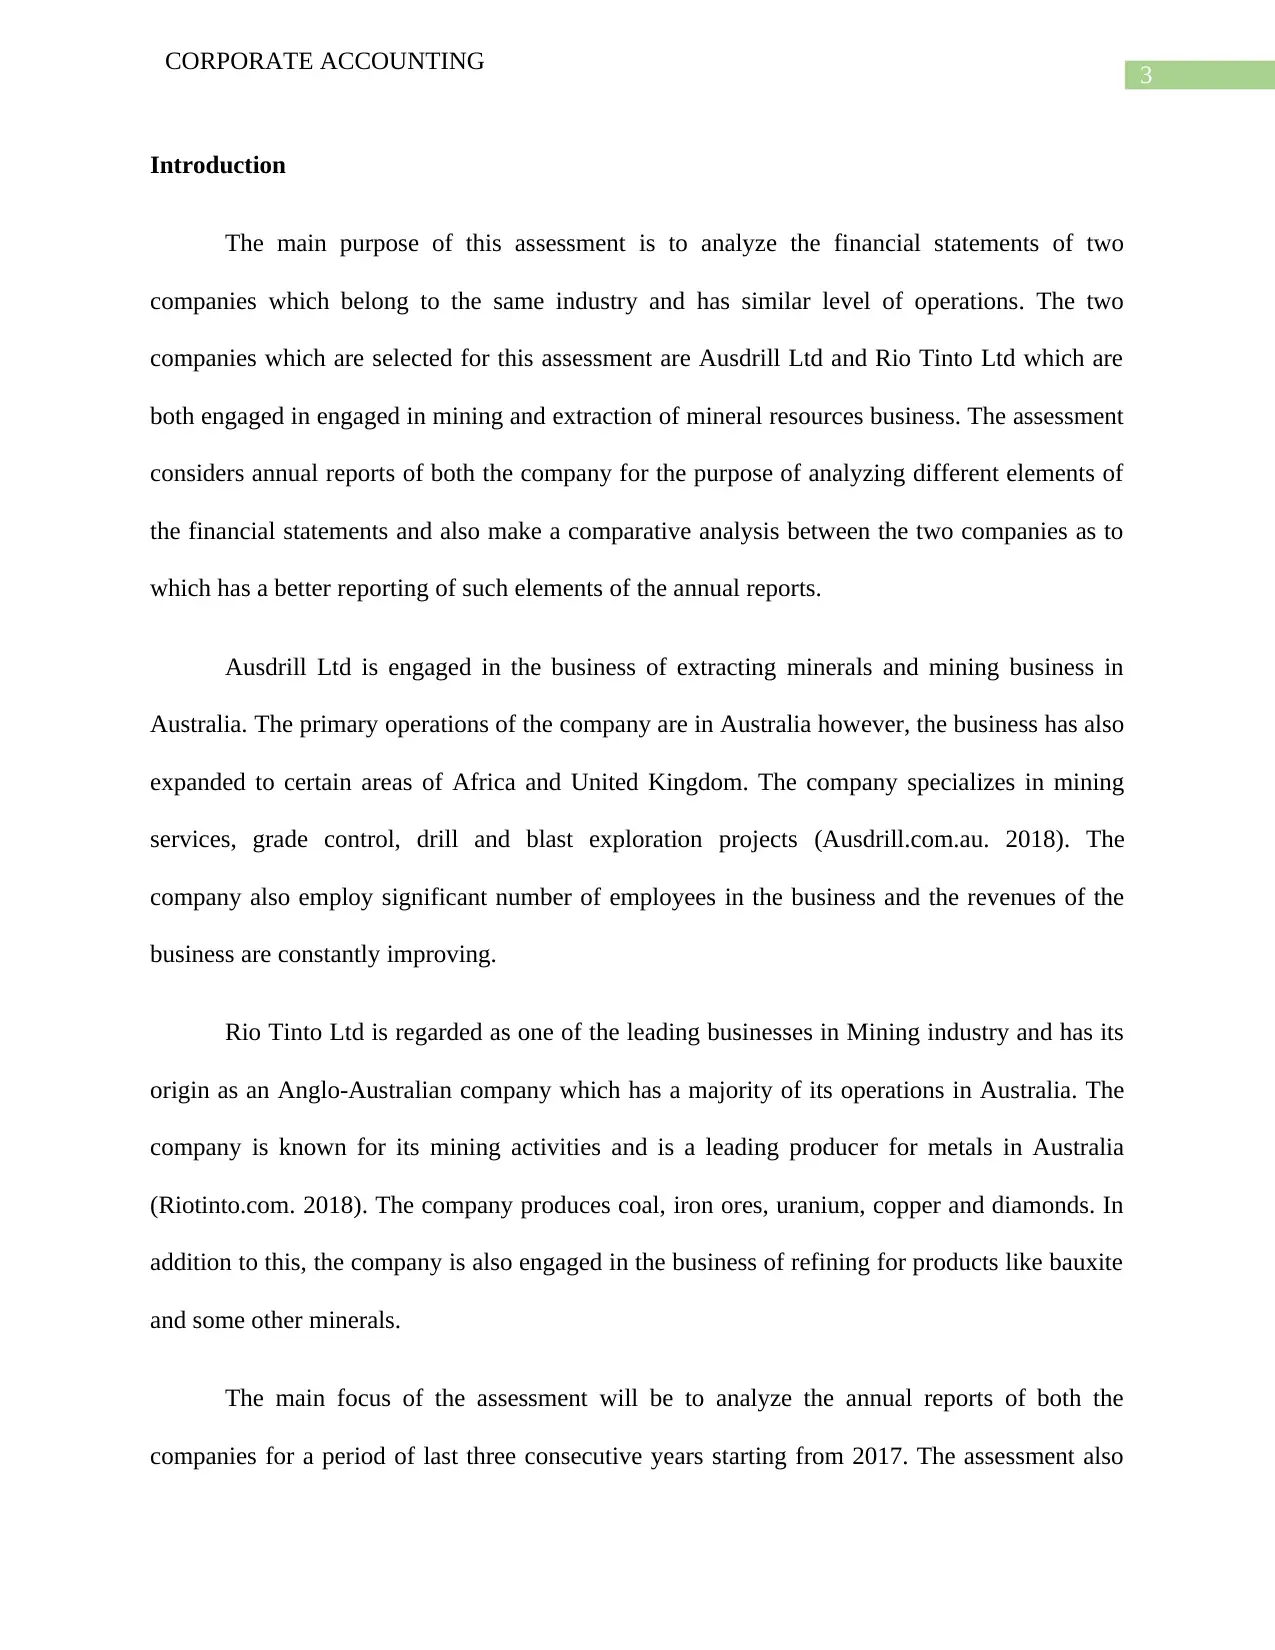
Introduction
The main purpose of this assessment is to analyze the financial statements of two
companies which belong to the same industry and has similar level of operations. The two
companies which are selected for this assessment are Ausdrill Ltd and Rio Tinto Ltd which are
both engaged in engaged in mining and extraction of mineral resources business. The assessment
considers annual reports of both the company for the purpose of analyzing different elements of
the financial statements and also make a comparative analysis between the two companies as to
which has a better reporting of such elements of the annual reports.
Ausdrill Ltd is engaged in the business of extracting minerals and mining business in
Australia. The primary operations of the company are in Australia however, the business has also
expanded to certain areas of Africa and United Kingdom. The company specializes in mining
services, grade control, drill and blast exploration projects (Ausdrill.com.au. 2018). The
company also employ significant number of employees in the business and the revenues of the
business are constantly improving.
Rio Tinto Ltd is regarded as one of the leading businesses in Mining industry and has its
origin as an Anglo-Australian company which has a majority of its operations in Australia. The
company is known for its mining activities and is a leading producer for metals in Australia
(Riotinto.com. 2018). The company produces coal, iron ores, uranium, copper and diamonds. In
addition to this, the company is also engaged in the business of refining for products like bauxite
and some other minerals.
The main focus of the assessment will be to analyze the annual reports of both the
companies for a period of last three consecutive years starting from 2017. The assessment also
CORPORATE ACCOUNTING
Introduction
The main purpose of this assessment is to analyze the financial statements of two
companies which belong to the same industry and has similar level of operations. The two
companies which are selected for this assessment are Ausdrill Ltd and Rio Tinto Ltd which are
both engaged in engaged in mining and extraction of mineral resources business. The assessment
considers annual reports of both the company for the purpose of analyzing different elements of
the financial statements and also make a comparative analysis between the two companies as to
which has a better reporting of such elements of the annual reports.
Ausdrill Ltd is engaged in the business of extracting minerals and mining business in
Australia. The primary operations of the company are in Australia however, the business has also
expanded to certain areas of Africa and United Kingdom. The company specializes in mining
services, grade control, drill and blast exploration projects (Ausdrill.com.au. 2018). The
company also employ significant number of employees in the business and the revenues of the
business are constantly improving.
Rio Tinto Ltd is regarded as one of the leading businesses in Mining industry and has its
origin as an Anglo-Australian company which has a majority of its operations in Australia. The
company is known for its mining activities and is a leading producer for metals in Australia
(Riotinto.com. 2018). The company produces coal, iron ores, uranium, copper and diamonds. In
addition to this, the company is also engaged in the business of refining for products like bauxite
and some other minerals.
The main focus of the assessment will be to analyze the annual reports of both the
companies for a period of last three consecutive years starting from 2017. The assessment also
Paraphrase This Document
Need a fresh take? Get an instant paraphrase of this document with our AI Paraphraser
4
CORPORATE ACCOUNTING
shows analysis and comparative analysis of the elements which are shown in the annual reports
of the business. Some of the significant areas which are considered in the annual reports of both
the companies are cash flow statements, equity capital used, tax treatments and disclosures. In
addition to this, the assessment will also be containing calculations regarding effective tax rate
and other tax computations.
Discussion
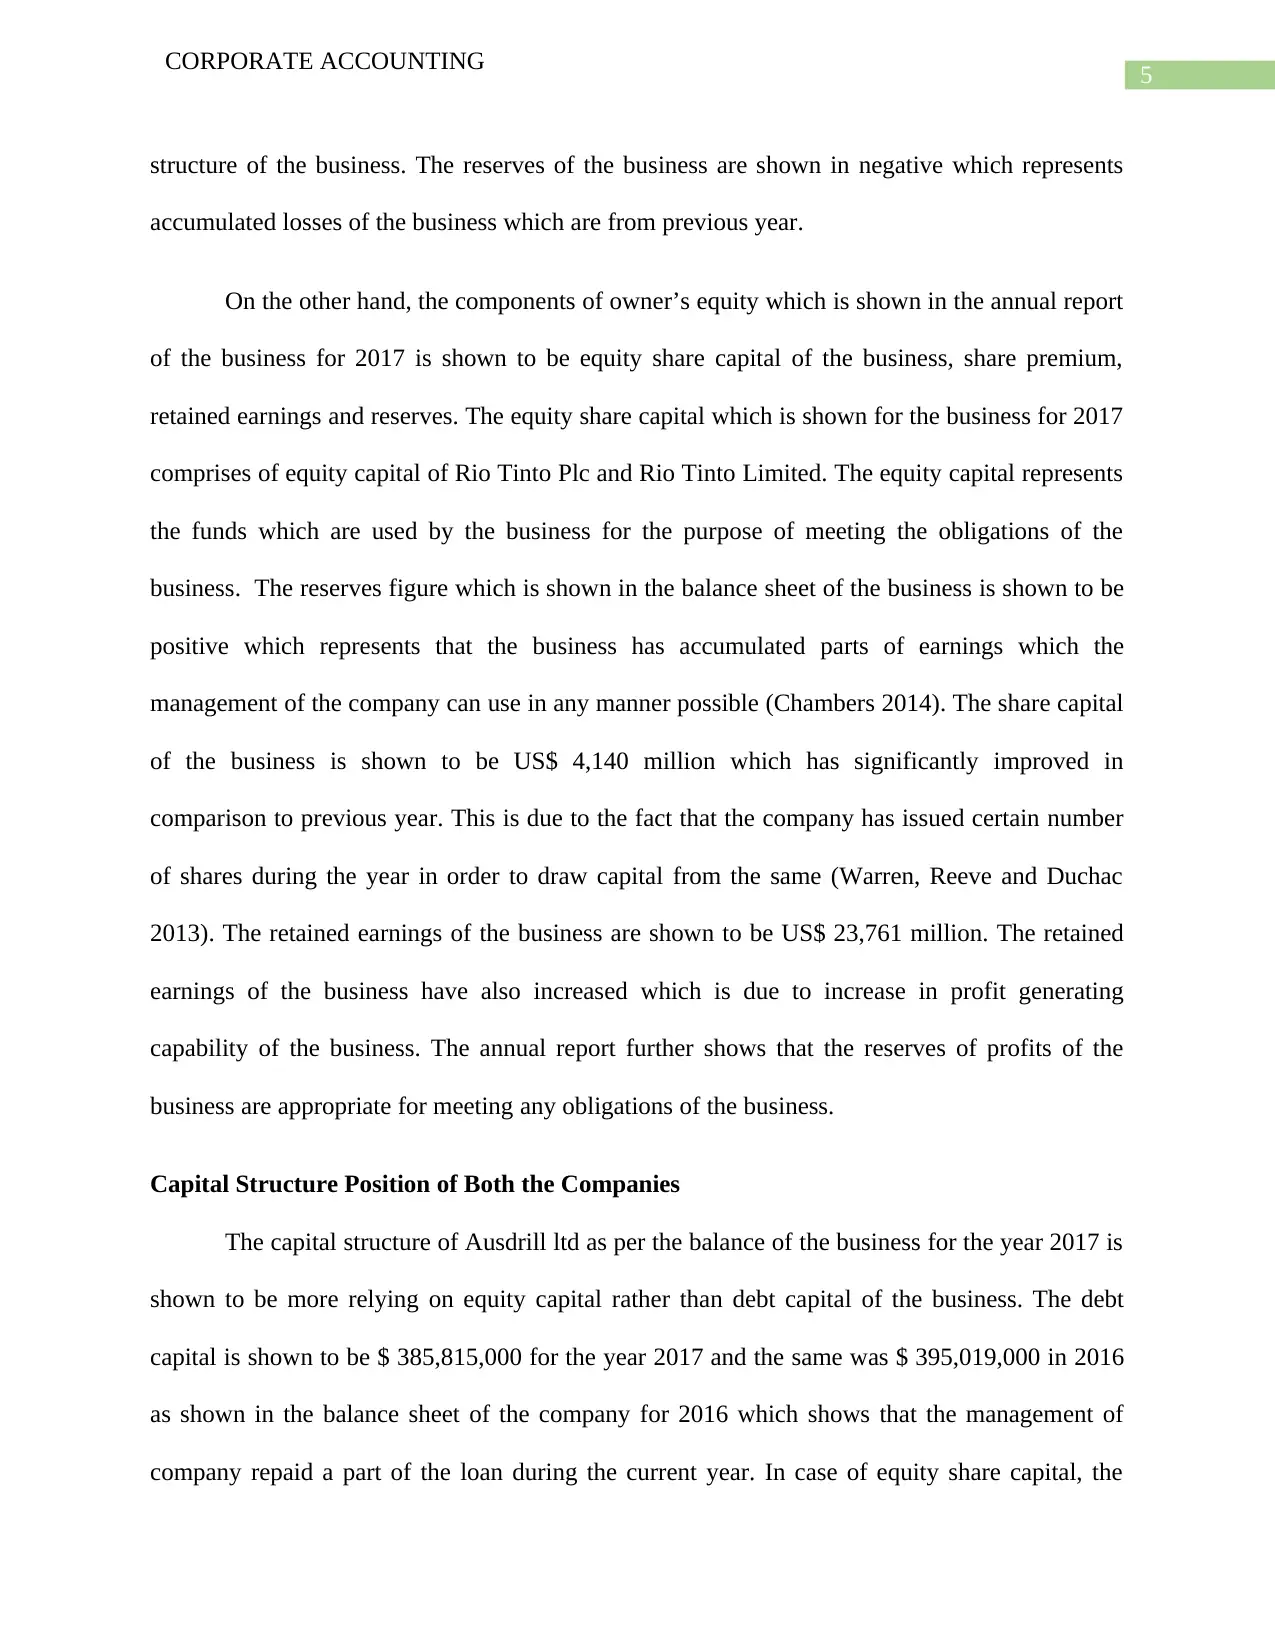
Owner’s Equity
The owner’s equity represents the equity capital and retain earnings of the business which
is used for financing the activities of the business. The annual report of 2017 is considered for
both the companies for the purpose of analyzing the owner’s equity of the business. As per the
annual report of 2017 for the Ausdrill Ltd, the owner’s equity is shown in the balance sheet. The
owner’s equity comprises of contributed equity, retained earnings and other reserves. The
contributed equity relates to the share capital which the company has accumulated by issues of
shares to the public. The contributed equity of the business for the year 2017 is shown to be $
546,447,000 which is same as the figure which was shown for previous year (Needles, Powers
and Crosson 2013). There have been no changes in the figure of equity as per previous year
estimates and also as per 2015 estimates. The retained earnings of the business reflect a part of
the profits which are kept aside either for reinvesting the same in the business or meeting certain
future obligations of the business. The retained earnings of the business for the year 2017 has
significantly increased in comparison to previous year analysis and the same is shown to be $
121,444,000. The estimate which is shown for 2015 is $ 38,027,000. Therefore, there is a general
trend which shows increase in the retained earnings of the business. This may be due to the
improvement in profitability of the business and also due to improvement in the operating
CORPORATE ACCOUNTING
shows analysis and comparative analysis of the elements which are shown in the annual reports
of the business. Some of the significant areas which are considered in the annual reports of both
the companies are cash flow statements, equity capital used, tax treatments and disclosures. In
addition to this, the assessment will also be containing calculations regarding effective tax rate
and other tax computations.
Discussion
Owner’s Equity
The owner’s equity represents the equity capital and retain earnings of the business which
is used for financing the activities of the business. The annual report of 2017 is considered for
both the companies for the purpose of analyzing the owner’s equity of the business. As per the
annual report of 2017 for the Ausdrill Ltd, the owner’s equity is shown in the balance sheet. The
owner’s equity comprises of contributed equity, retained earnings and other reserves. The
contributed equity relates to the share capital which the company has accumulated by issues of
shares to the public. The contributed equity of the business for the year 2017 is shown to be $
546,447,000 which is same as the figure which was shown for previous year (Needles, Powers
and Crosson 2013). There have been no changes in the figure of equity as per previous year
estimates and also as per 2015 estimates. The retained earnings of the business reflect a part of
the profits which are kept aside either for reinvesting the same in the business or meeting certain
future obligations of the business. The retained earnings of the business for the year 2017 has
significantly increased in comparison to previous year analysis and the same is shown to be $
121,444,000. The estimate which is shown for 2015 is $ 38,027,000. Therefore, there is a general
trend which shows increase in the retained earnings of the business. This may be due to the
improvement in profitability of the business and also due to improvement in the operating
5
CORPORATE ACCOUNTING
structure of the business. The reserves of the business are shown in negative which represents
accumulated losses of the business which are from previous year.
On the other hand, the components of owner’s equity which is shown in the annual report
of the business for 2017 is shown to be equity share capital of the business, share premium,
retained earnings and reserves. The equity share capital which is shown for the business for 2017
comprises of equity capital of Rio Tinto Plc and Rio Tinto Limited. The equity capital represents
the funds which are used by the business for the purpose of meeting the obligations of the
business. The reserves figure which is shown in the balance sheet of the business is shown to be
positive which represents that the business has accumulated parts of earnings which the
management of the company can use in any manner possible (Chambers 2014). The share capital
of the business is shown to be US$ 4,140 million which has significantly improved in
comparison to previous year. This is due to the fact that the company has issued certain number
of shares during the year in order to draw capital from the same (Warren, Reeve and Duchac
2013). The retained earnings of the business are shown to be US$ 23,761 million. The retained
earnings of the business have also increased which is due to increase in profit generating
capability of the business. The annual report further shows that the reserves of profits of the
business are appropriate for meeting any obligations of the business.
Capital Structure Position of Both the Companies
The capital structure of Ausdrill ltd as per the balance of the business for the year 2017 is
shown to be more relying on equity capital rather than debt capital of the business. The debt
capital is shown to be $ 385,815,000 for the year 2017 and the same was $ 395,019,000 in 2016
as shown in the balance sheet of the company for 2016 which shows that the management of
company repaid a part of the loan during the current year. In case of equity share capital, the
⊘ This is a preview!⊘
Do you want full access?
Subscribe today to unlock all pages.
Trusted by 1+ million students worldwide
6
CORPORATE ACCOUNTING
business has increased equity capital of the business during the year as shown in the balance
sheet of the business. The borrowings of the business for the year 2015 is shown to be $
407,307,000 which is higher than 2016 estimate. The analysis for 3 years reveals that the
management is systematically reducing the debts of the business and thereby focusing on
application of more equity capital of the business.
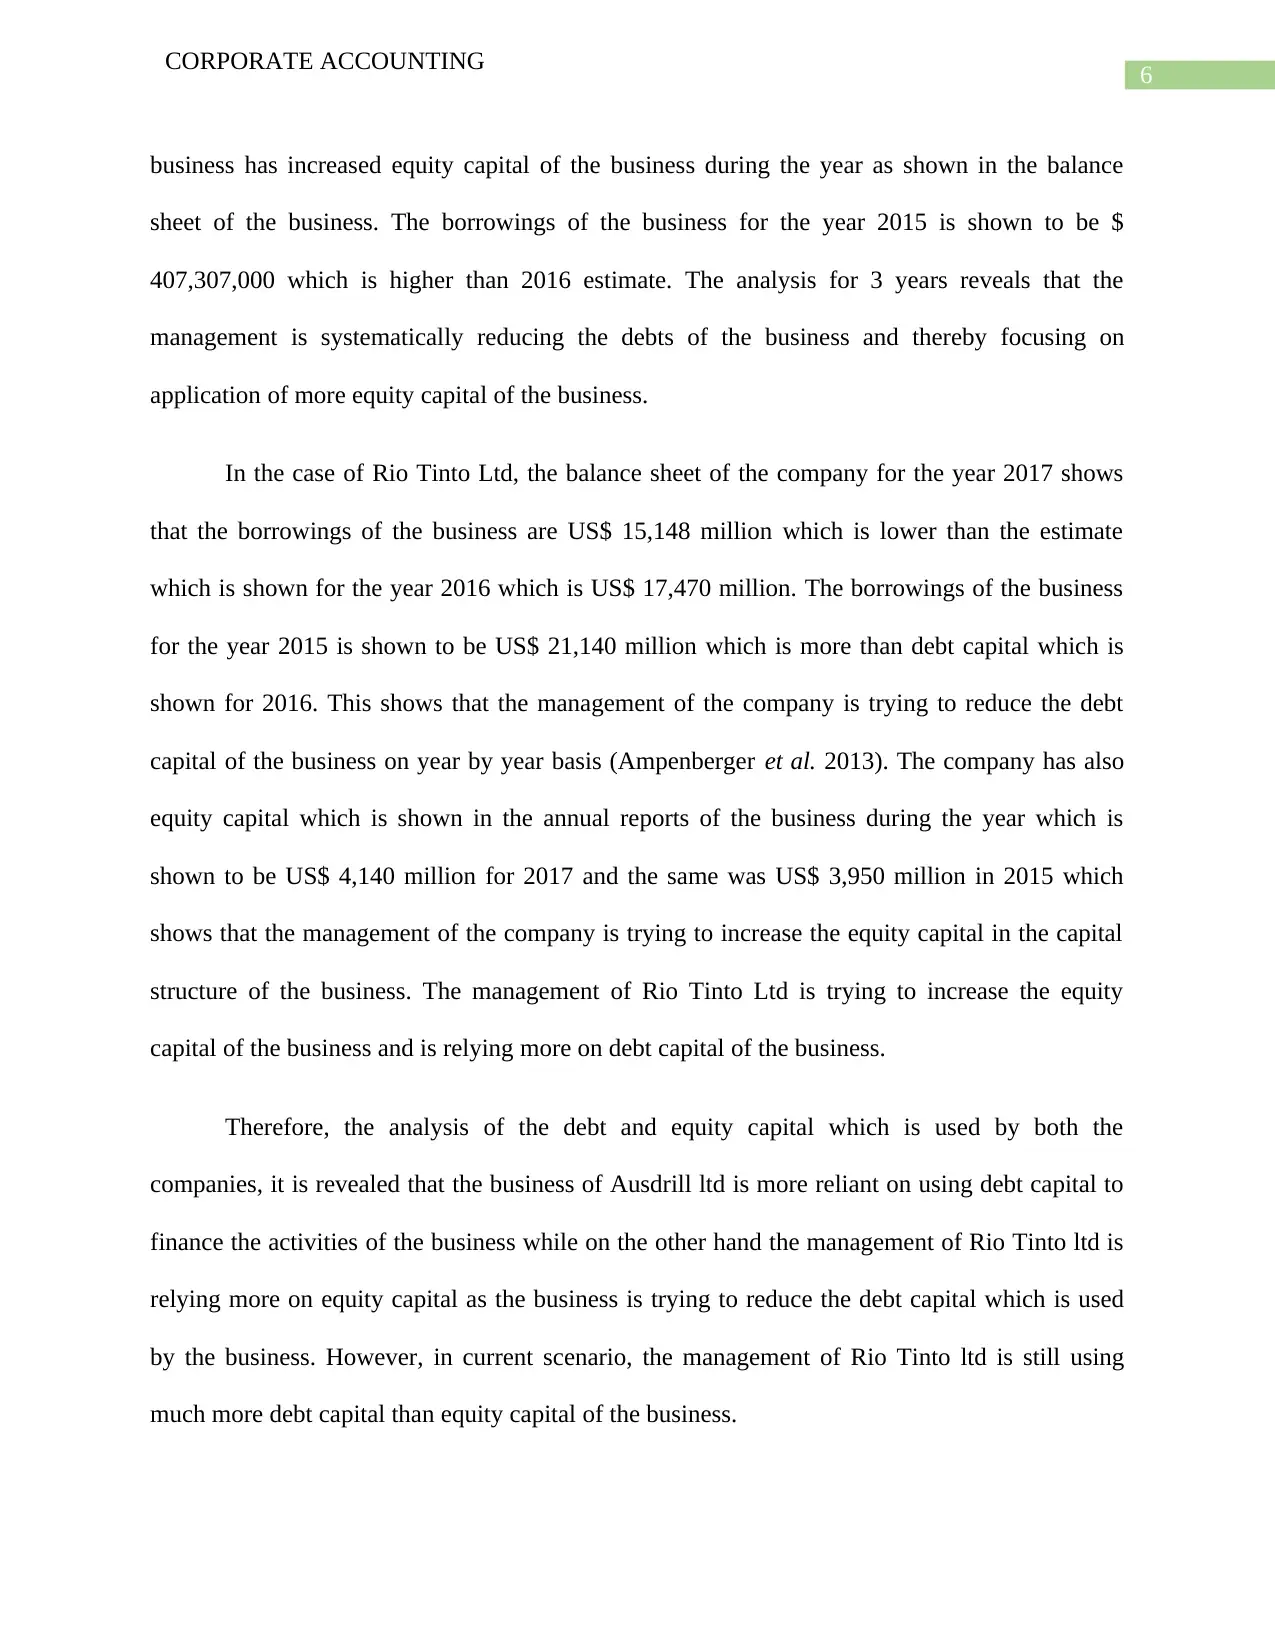
In the case of Rio Tinto Ltd, the balance sheet of the company for the year 2017 shows
that the borrowings of the business are US$ 15,148 million which is lower than the estimate
which is shown for the year 2016 which is US$ 17,470 million. The borrowings of the business
for the year 2015 is shown to be US$ 21,140 million which is more than debt capital which is
shown for 2016. This shows that the management of the company is trying to reduce the debt
capital of the business on year by year basis (Ampenberger et al. 2013). The company has also
equity capital which is shown in the annual reports of the business during the year which is
shown to be US$ 4,140 million for 2017 and the same was US$ 3,950 million in 2015 which
shows that the management of the company is trying to increase the equity capital in the capital
structure of the business. The management of Rio Tinto Ltd is trying to increase the equity
capital of the business and is relying more on debt capital of the business.
Therefore, the analysis of the debt and equity capital which is used by both the
companies, it is revealed that the business of Ausdrill ltd is more reliant on using debt capital to
finance the activities of the business while on the other hand the management of Rio Tinto ltd is
relying more on equity capital as the business is trying to reduce the debt capital which is used
by the business. However, in current scenario, the management of Rio Tinto ltd is still using
much more debt capital than equity capital of the business.
CORPORATE ACCOUNTING
business has increased equity capital of the business during the year as shown in the balance
sheet of the business. The borrowings of the business for the year 2015 is shown to be $
407,307,000 which is higher than 2016 estimate. The analysis for 3 years reveals that the
management is systematically reducing the debts of the business and thereby focusing on
application of more equity capital of the business.
In the case of Rio Tinto Ltd, the balance sheet of the company for the year 2017 shows
that the borrowings of the business are US$ 15,148 million which is lower than the estimate
which is shown for the year 2016 which is US$ 17,470 million. The borrowings of the business
for the year 2015 is shown to be US$ 21,140 million which is more than debt capital which is
shown for 2016. This shows that the management of the company is trying to reduce the debt
capital of the business on year by year basis (Ampenberger et al. 2013). The company has also
equity capital which is shown in the annual reports of the business during the year which is
shown to be US$ 4,140 million for 2017 and the same was US$ 3,950 million in 2015 which
shows that the management of the company is trying to increase the equity capital in the capital
structure of the business. The management of Rio Tinto Ltd is trying to increase the equity
capital of the business and is relying more on debt capital of the business.
Therefore, the analysis of the debt and equity capital which is used by both the
companies, it is revealed that the business of Ausdrill ltd is more reliant on using debt capital to
finance the activities of the business while on the other hand the management of Rio Tinto ltd is
relying more on equity capital as the business is trying to reduce the debt capital which is used
by the business. However, in current scenario, the management of Rio Tinto ltd is still using
much more debt capital than equity capital of the business.
Paraphrase This Document
Need a fresh take? Get an instant paraphrase of this document with our AI Paraphraser
7
CORPORATE ACCOUNTING
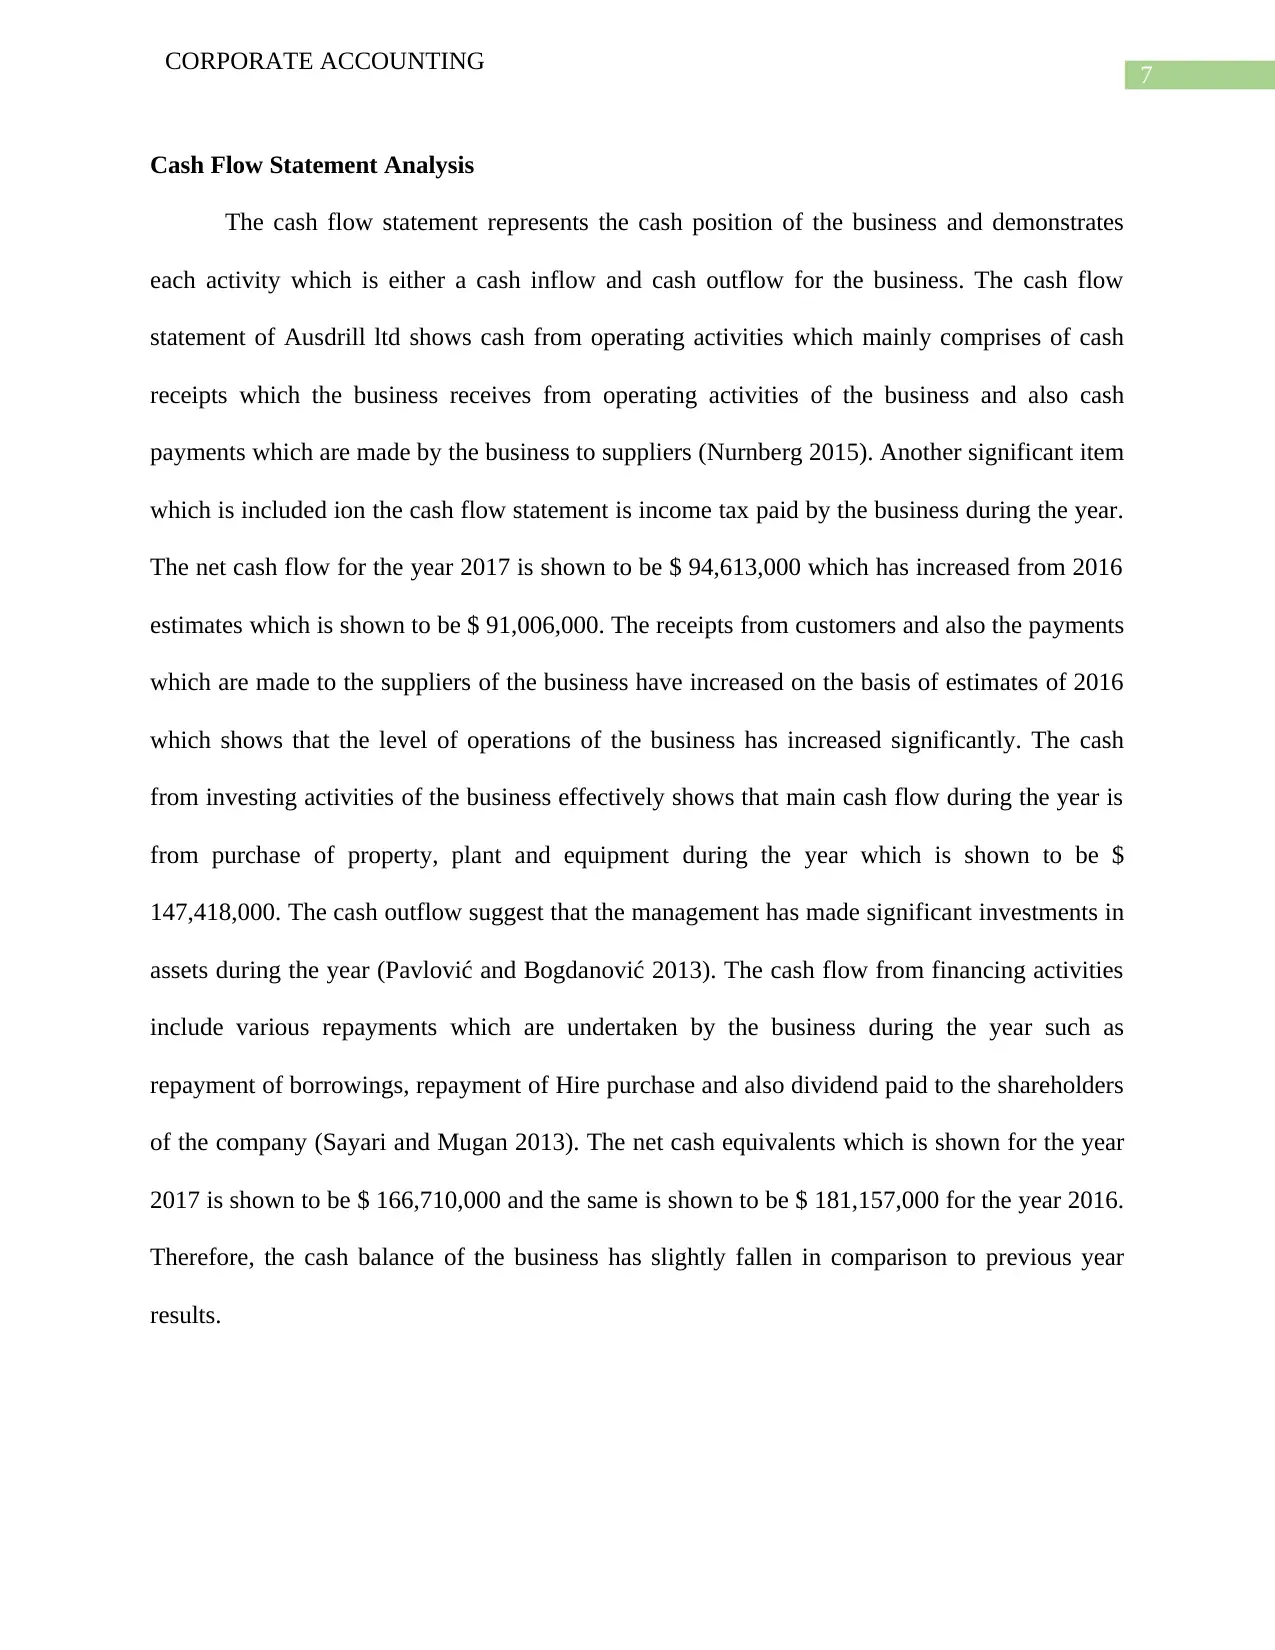
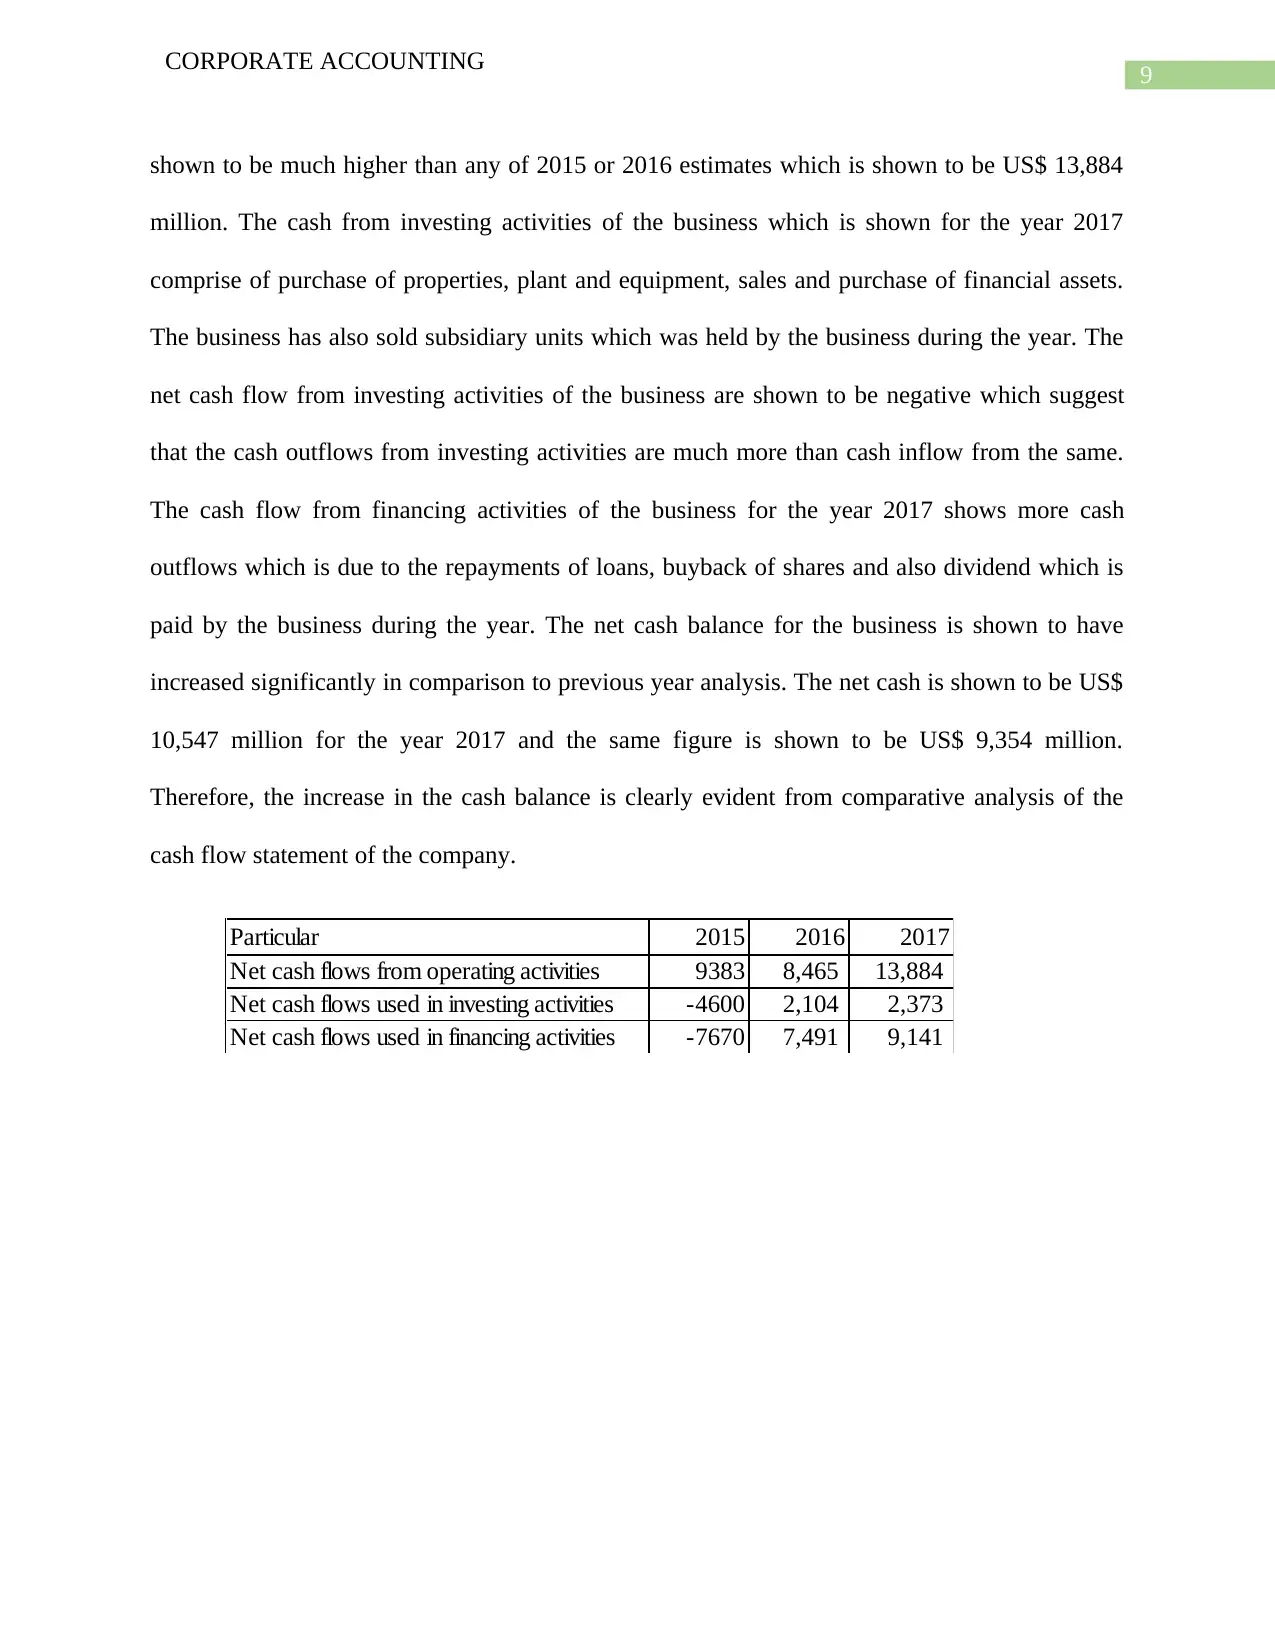
Cash Flow Statement Analysis
The cash flow statement represents the cash position of the business and demonstrates
each activity which is either a cash inflow and cash outflow for the business. The cash flow
statement of Ausdrill ltd shows cash from operating activities which mainly comprises of cash
receipts which the business receives from operating activities of the business and also cash
payments which are made by the business to suppliers (Nurnberg 2015). Another significant item
which is included ion the cash flow statement is income tax paid by the business during the year.
The net cash flow for the year 2017 is shown to be $ 94,613,000 which has increased from 2016
estimates which is shown to be $ 91,006,000. The receipts from customers and also the payments
which are made to the suppliers of the business have increased on the basis of estimates of 2016
which shows that the level of operations of the business has increased significantly. The cash
from investing activities of the business effectively shows that main cash flow during the year is
from purchase of property, plant and equipment during the year which is shown to be $
147,418,000. The cash outflow suggest that the management has made significant investments in
assets during the year (Pavlović and Bogdanović 2013). The cash flow from financing activities
include various repayments which are undertaken by the business during the year such as
repayment of borrowings, repayment of Hire purchase and also dividend paid to the shareholders
of the company (Sayari and Mugan 2013). The net cash equivalents which is shown for the year
2017 is shown to be $ 166,710,000 and the same is shown to be $ 181,157,000 for the year 2016.
Therefore, the cash balance of the business has slightly fallen in comparison to previous year
results.
CORPORATE ACCOUNTING
Cash Flow Statement Analysis
The cash flow statement represents the cash position of the business and demonstrates
each activity which is either a cash inflow and cash outflow for the business. The cash flow
statement of Ausdrill ltd shows cash from operating activities which mainly comprises of cash
receipts which the business receives from operating activities of the business and also cash
payments which are made by the business to suppliers (Nurnberg 2015). Another significant item
which is included ion the cash flow statement is income tax paid by the business during the year.
The net cash flow for the year 2017 is shown to be $ 94,613,000 which has increased from 2016
estimates which is shown to be $ 91,006,000. The receipts from customers and also the payments
which are made to the suppliers of the business have increased on the basis of estimates of 2016
which shows that the level of operations of the business has increased significantly. The cash
from investing activities of the business effectively shows that main cash flow during the year is
from purchase of property, plant and equipment during the year which is shown to be $
147,418,000. The cash outflow suggest that the management has made significant investments in
assets during the year (Pavlović and Bogdanović 2013). The cash flow from financing activities
include various repayments which are undertaken by the business during the year such as
repayment of borrowings, repayment of Hire purchase and also dividend paid to the shareholders
of the company (Sayari and Mugan 2013). The net cash equivalents which is shown for the year
2017 is shown to be $ 166,710,000 and the same is shown to be $ 181,157,000 for the year 2016.
Therefore, the cash balance of the business has slightly fallen in comparison to previous year
results.
8
CORPORATE ACCOUNTING
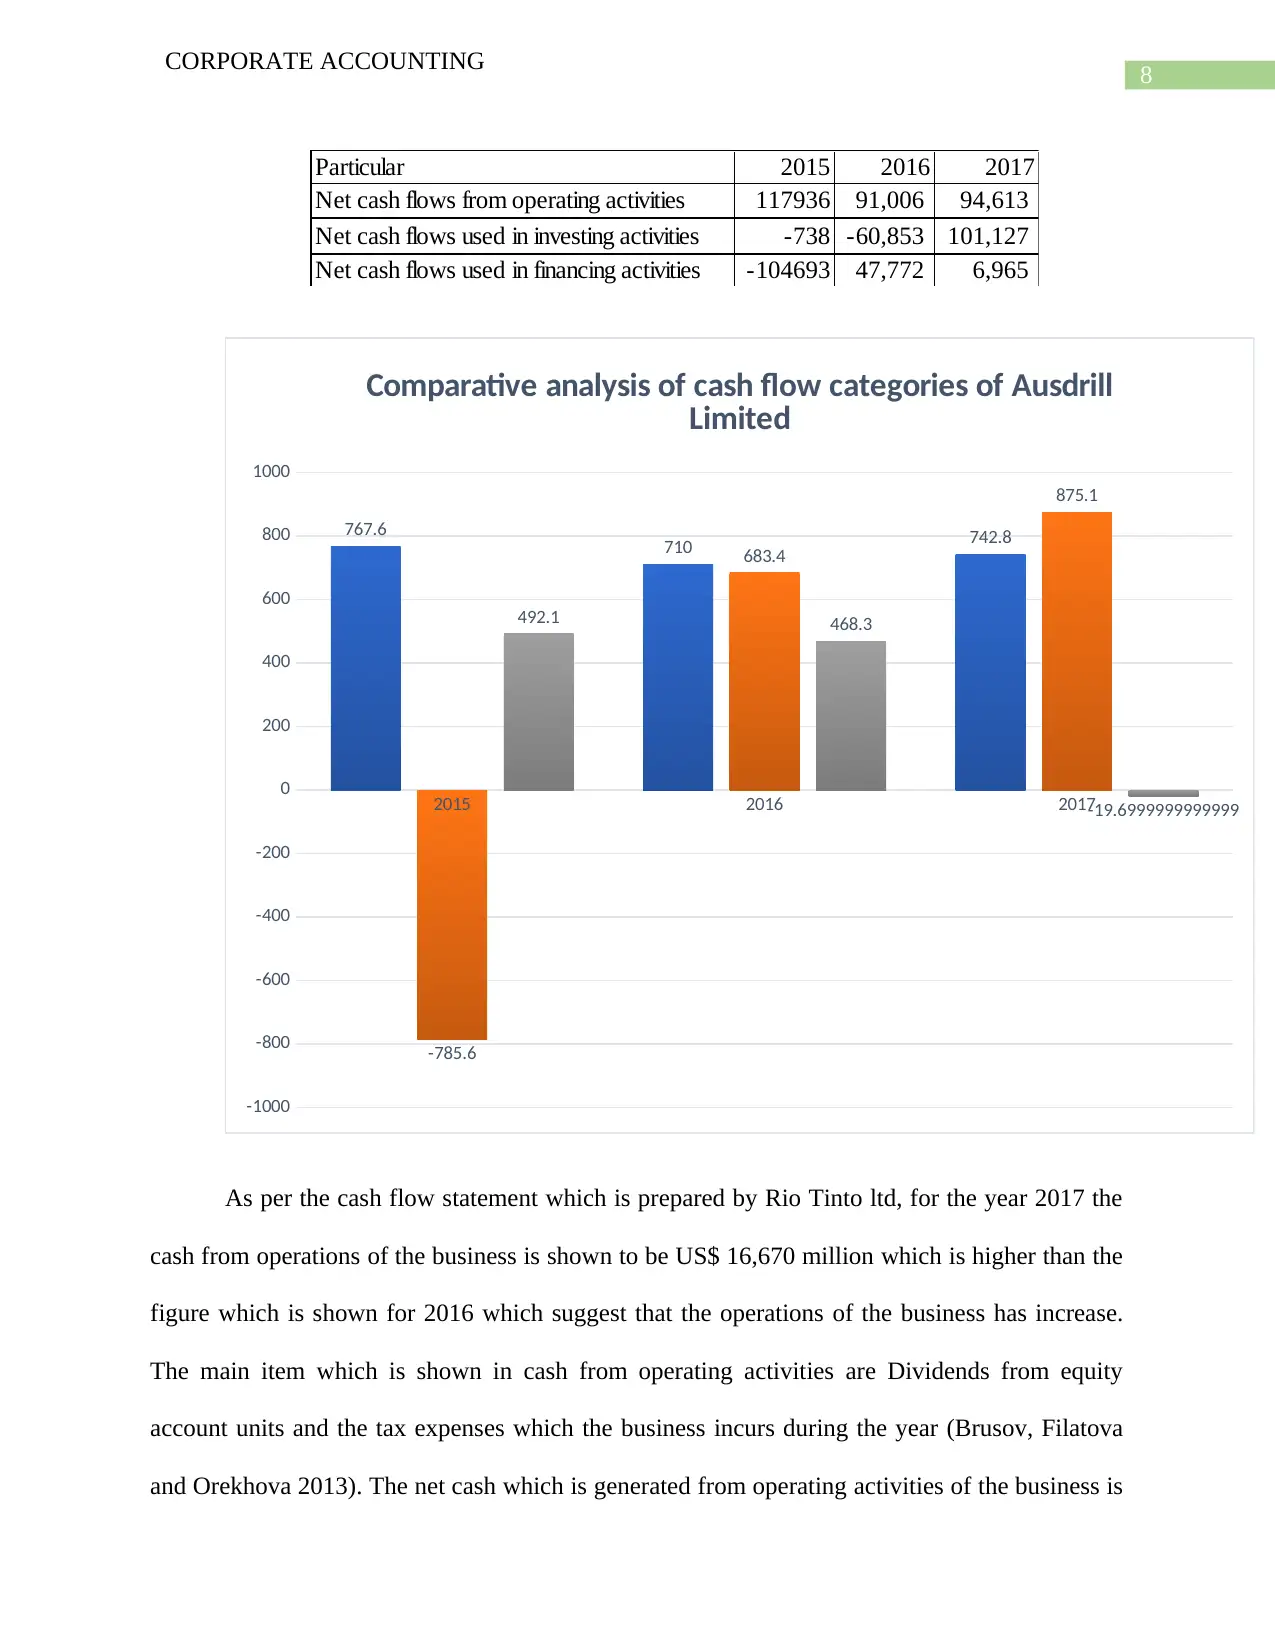
Particular 2015 2016 2017
Net cash flows from operating activities 117936 91,006 94,613
Net cash flows used in investing activities -738 -60,853 101,127
Net cash flows used in financing activities -104693 47,772 6,965
2015 2016 2017
-1000
-800
-600
-400
-200
0
200
400
600
800
1000
767.6 710 742.8
-785.6
683.4
875.1
492.1 468.3
-19.6999999999999
Comparative analysis of cash flow categories of Ausdrill
Limited
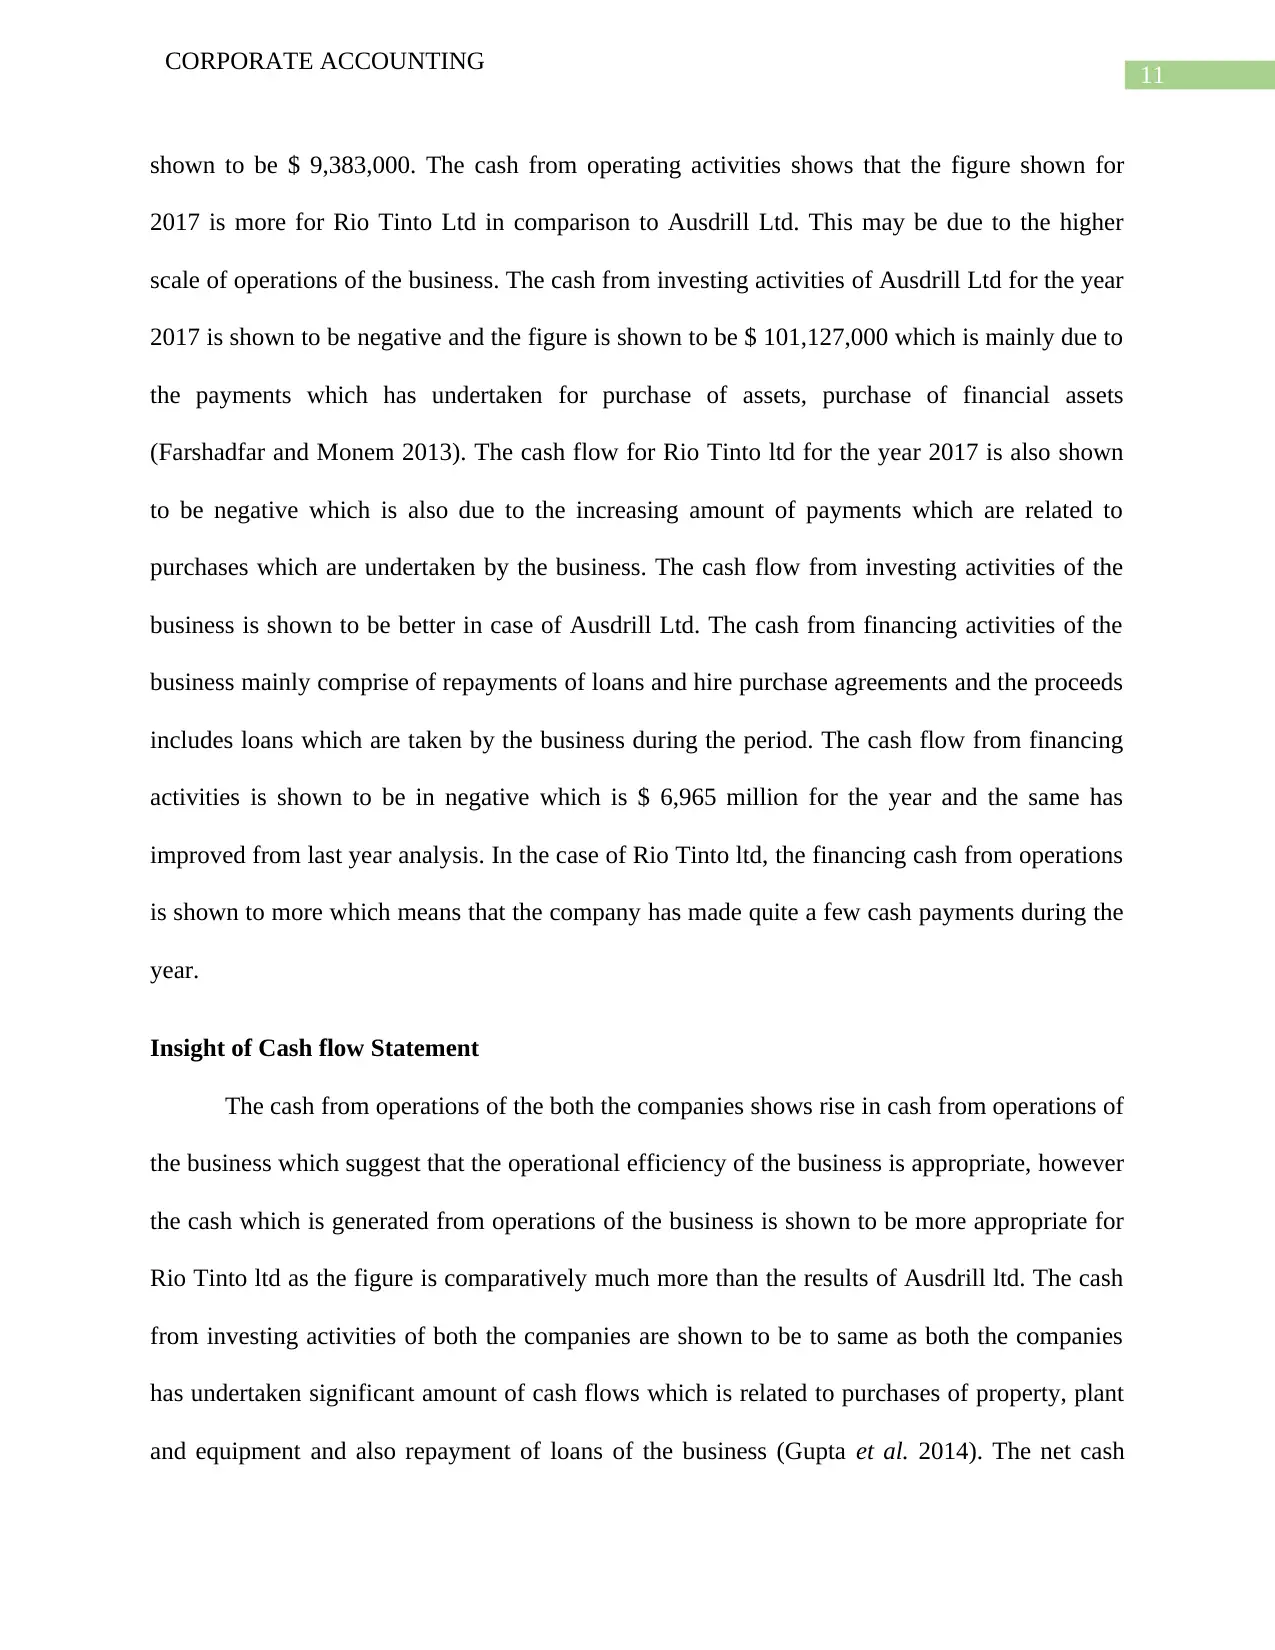
As per the cash flow statement which is prepared by Rio Tinto ltd, for the year 2017 the
cash from operations of the business is shown to be US$ 16,670 million which is higher than the
figure which is shown for 2016 which suggest that the operations of the business has increase.
The main item which is shown in cash from operating activities are Dividends from equity
account units and the tax expenses which the business incurs during the year (Brusov, Filatova
and Orekhova 2013). The net cash which is generated from operating activities of the business is
CORPORATE ACCOUNTING
Particular 2015 2016 2017
Net cash flows from operating activities 117936 91,006 94,613
Net cash flows used in investing activities -738 -60,853 101,127
Net cash flows used in financing activities -104693 47,772 6,965
2015 2016 2017
-1000
-800
-600
-400
-200
0
200
400
600
800
1000
767.6 710 742.8
-785.6
683.4
875.1
492.1 468.3
-19.6999999999999
Comparative analysis of cash flow categories of Ausdrill
Limited
As per the cash flow statement which is prepared by Rio Tinto ltd, for the year 2017 the
cash from operations of the business is shown to be US$ 16,670 million which is higher than the
figure which is shown for 2016 which suggest that the operations of the business has increase.
The main item which is shown in cash from operating activities are Dividends from equity
account units and the tax expenses which the business incurs during the year (Brusov, Filatova
and Orekhova 2013). The net cash which is generated from operating activities of the business is
⊘ This is a preview!⊘
Do you want full access?
Subscribe today to unlock all pages.
Trusted by 1+ million students worldwide
9
CORPORATE ACCOUNTING
shown to be much higher than any of 2015 or 2016 estimates which is shown to be US$ 13,884
million. The cash from investing activities of the business which is shown for the year 2017
comprise of purchase of properties, plant and equipment, sales and purchase of financial assets.
The business has also sold subsidiary units which was held by the business during the year. The
net cash flow from investing activities of the business are shown to be negative which suggest
that the cash outflows from investing activities are much more than cash inflow from the same.
The cash flow from financing activities of the business for the year 2017 shows more cash
outflows which is due to the repayments of loans, buyback of shares and also dividend which is
paid by the business during the year. The net cash balance for the business is shown to have
increased significantly in comparison to previous year analysis. The net cash is shown to be US$
10,547 million for the year 2017 and the same figure is shown to be US$ 9,354 million.
Therefore, the increase in the cash balance is clearly evident from comparative analysis of the
cash flow statement of the company.
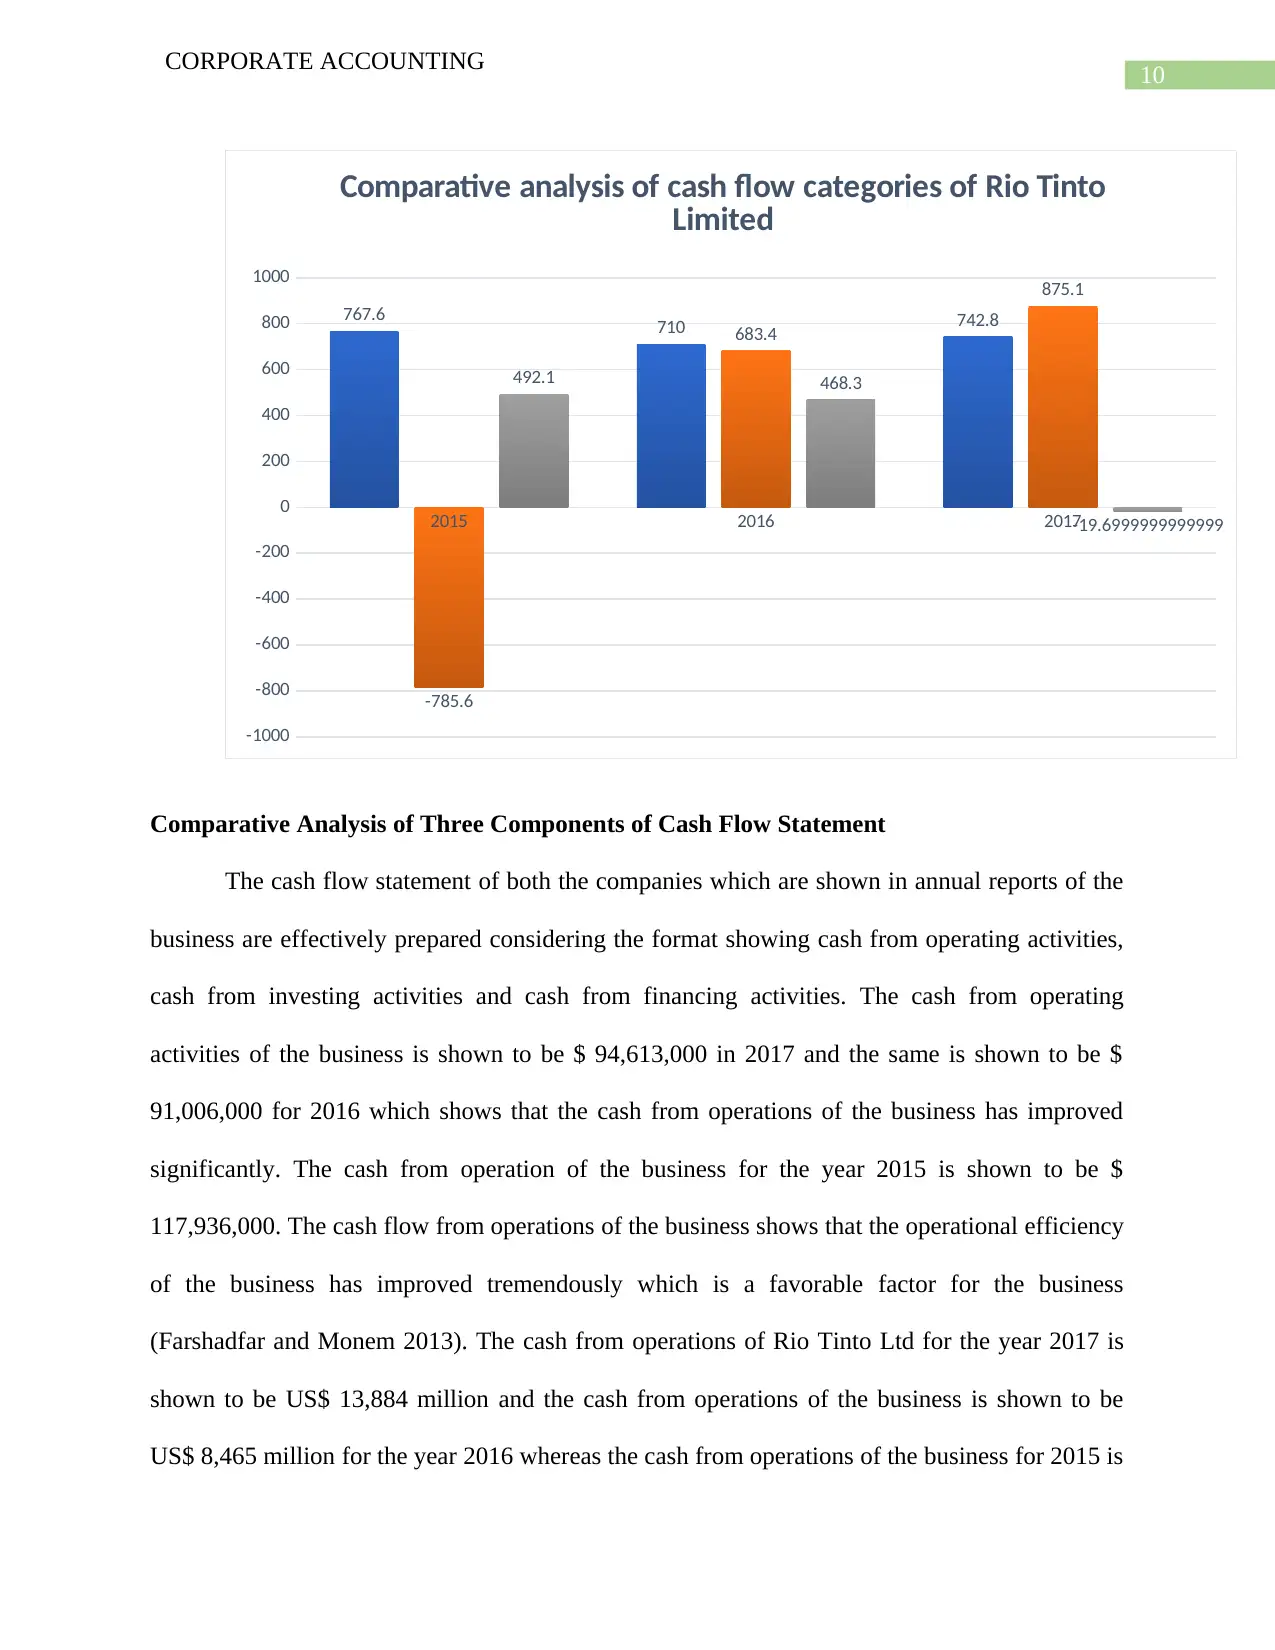
Particular 2015 2016 2017
Net cash flows from operating activities 9383 8,465 13,884
Net cash flows used in investing activities -4600 2,104 2,373
Net cash flows used in financing activities -7670 7,491 9,141
CORPORATE ACCOUNTING
shown to be much higher than any of 2015 or 2016 estimates which is shown to be US$ 13,884
million. The cash from investing activities of the business which is shown for the year 2017
comprise of purchase of properties, plant and equipment, sales and purchase of financial assets.
The business has also sold subsidiary units which was held by the business during the year. The
net cash flow from investing activities of the business are shown to be negative which suggest
that the cash outflows from investing activities are much more than cash inflow from the same.
The cash flow from financing activities of the business for the year 2017 shows more cash
outflows which is due to the repayments of loans, buyback of shares and also dividend which is
paid by the business during the year. The net cash balance for the business is shown to have
increased significantly in comparison to previous year analysis. The net cash is shown to be US$
10,547 million for the year 2017 and the same figure is shown to be US$ 9,354 million.
Therefore, the increase in the cash balance is clearly evident from comparative analysis of the
cash flow statement of the company.
Particular 2015 2016 2017
Net cash flows from operating activities 9383 8,465 13,884
Net cash flows used in investing activities -4600 2,104 2,373
Net cash flows used in financing activities -7670 7,491 9,141
Paraphrase This Document
Need a fresh take? Get an instant paraphrase of this document with our AI Paraphraser
10
CORPORATE ACCOUNTING
2015 2016 2017
-1000
-800
-600
-400
-200
0
200
400
600
800
1000
767.6 710 742.8
-785.6
683.4
875.1
492.1 468.3
-19.6999999999999
Comparative analysis of cash flow categories of Rio Tinto
Limited
Comparative Analysis of Three Components of Cash Flow Statement
The cash flow statement of both the companies which are shown in annual reports of the
business are effectively prepared considering the format showing cash from operating activities,
cash from investing activities and cash from financing activities. The cash from operating
activities of the business is shown to be $ 94,613,000 in 2017 and the same is shown to be $
91,006,000 for 2016 which shows that the cash from operations of the business has improved
significantly. The cash from operation of the business for the year 2015 is shown to be $
117,936,000. The cash flow from operations of the business shows that the operational efficiency
of the business has improved tremendously which is a favorable factor for the business
(Farshadfar and Monem 2013). The cash from operations of Rio Tinto Ltd for the year 2017 is
shown to be US$ 13,884 million and the cash from operations of the business is shown to be
US$ 8,465 million for the year 2016 whereas the cash from operations of the business for 2015 is
11
CORPORATE ACCOUNTING
shown to be $ 9,383,000. The cash from operating activities shows that the figure shown for
2017 is more for Rio Tinto Ltd in comparison to Ausdrill Ltd. This may be due to the higher
scale of operations of the business. The cash from investing activities of Ausdrill Ltd for the year
2017 is shown to be negative and the figure is shown to be $ 101,127,000 which is mainly due to
the payments which has undertaken for purchase of assets, purchase of financial assets
(Farshadfar and Monem 2013). The cash flow for Rio Tinto ltd for the year 2017 is also shown
to be negative which is also due to the increasing amount of payments which are related to
purchases which are undertaken by the business. The cash flow from investing activities of the
business is shown to be better in case of Ausdrill Ltd. The cash from financing activities of the
business mainly comprise of repayments of loans and hire purchase agreements and the proceeds
includes loans which are taken by the business during the period. The cash flow from financing
activities is shown to be in negative which is $ 6,965 million for the year and the same has
improved from last year analysis. In the case of Rio Tinto ltd, the financing cash from operations
is shown to more which means that the company has made quite a few cash payments during the
year.
Insight of Cash flow Statement
The cash from operations of the both the companies shows rise in cash from operations of
the business which suggest that the operational efficiency of the business is appropriate, however
the cash which is generated from operations of the business is shown to be more appropriate for
Rio Tinto ltd as the figure is comparatively much more than the results of Ausdrill ltd. The cash
from investing activities of both the companies are shown to be to same as both the companies
has undertaken significant amount of cash flows which is related to purchases of property, plant
and equipment and also repayment of loans of the business (Gupta et al. 2014). The net cash
⊘ This is a preview!⊘
Do you want full access?
Subscribe today to unlock all pages.
Trusted by 1+ million students worldwide
1 out of 19
Related Documents


Your All-in-One AI-Powered Toolkit for Academic Success.
+13062052269
info@desklib.com
Available 24*7 on WhatsApp / Email
![[object Object]](/_next/static/media/star-bottom.7253800d.svg)
Unlock your academic potential
Copyright © 2020–2026 A2Z Services. All Rights Reserved. Developed and managed by ZUCOL.