HI5020 Corporate Accounting Assignment: Bank Performance Analysis
VerifiedAdded on 2023/06/04
|22
|4465
|56
Report
AI Summary
This report provides a comparative analysis of the corporate accounting practices of Commonwealth Bank and Westpac Bank, both listed on the Australian Securities Exchange (ASX). The analysis, conducted from an investor's perspective, examines various financial components, including equity, cash flow statements, comprehensive income statements, and corporate income tax. The equity section discusses share capital, retained earnings, and reserves, highlighting the debt-equity ratios of both banks. The cash flow statement analysis explores operating, investing, and financing activities, comparing trends and providing graphical representations. The comprehensive income statement section addresses items reported under other comprehensive income (OCI) and their implications. Finally, the report delves into corporate income tax, calculating effective tax rates, deferred tax assets and liabilities, and the difference between cash and book tax, concluding with an overview of the key findings.

Corporate accounting
Paraphrase This Document
Need a fresh take? Get an instant paraphrase of this document with our AI Paraphraser
EXECUTIVE SUMMARY
We get the industry overview by analyzing the performance of each company belonging to that
industry. The following discussion is the comparative analysis of two listed companies of
Australia operating within the same industry. For such an analysis, we have chosen
Commonwealth and Westpac banks. The analysis has been made from an investor's point of
view as such stakeholders have an interest in knowing about the internal environment of an
organization so that useful decisions can be made accordingly.
Contents
ANALYSIS OF EQUITY................................................................................................................6
Discussion on each item of equity for both the companies..........................................................6
Discussion regarding debt and equity of both the companies......................................................7
ANALYSIS OF CASH FLOW STATEMENT...............................................................................9
Discussion regarding Cash Flow Statement:...............................................................................9
Description of Analysis of Cash flow of both the companies....................................................13
ANALYSIS OF COMPREHENSIVE INCOME STATEMENT.................................................14
Items reported in other comprehensive income statement.........................................................14
Reasons for not reporting this item in income statement...........................................................14
Comparative Analysis of OCI statement items..........................................................................14
Use of OCI in evaluation of performance of managers.............................................................15
ANALYSIS OF CORPORATE INCOME TAX...........................................................................16
Tax expense for the companies for the current year..................................................................16
Effective income tax rate...........................................................................................................16
Deferred tax asset and liabilities................................................................................................16
Increase in DTA and DTL.........................................................................................................17
Calculation of cash tax using book tax......................................................................................17
Calculation of Tax rate...............................................................................................................19
Difference in cash tax and book tax...........................................................................................19
⊘ This is a preview!⊘
Do you want full access?
Subscribe today to unlock all pages.
Trusted by 1+ million students worldwide

CONCLUSION..............................................................................................................................20
Bibliography..................................................................................................................................21
Bibliography..................................................................................................................................21
Paraphrase This Document
Need a fresh take? Get an instant paraphrase of this document with our AI Paraphraser
INTRODUCTION
The financial & non financial measures and statistics together sums up as various components of
the financial reports. Such components differ from each other in terms of characteristics and their
nature. The following discussion focuses on comparison of various such components between
Commonwealth group and Westpac group working under the same industry.
The Australian multinational bank, Commonwealth Bank, is engaged a number of activities such
as Institutional banking , retail and business management of funds, superannuation facilities,
investment, insurance and such other financial services such as brokerage services. It has its
businesses spread all over the world such as New Zealand, US, UK and Asia. As of 2015, this
company had turned out to be the largest listed company on Australian Securities Exchange
(ASX) with brands such as Commonwealth securities & insurance, ASB Bank, Bankwest, etc.
This company is also the Southern Hemisphere's largest bank (Armstrong, 2015).
Westpac Banking Corporation, also known as Westpac, having headquarters at Sydney is a
provider of financial services and is considered as one of the 'big four' banks of Australia. It's
name is formed by the combination of 'Western' and 'Pacific'. Considering its current status, it
has 14 million customers with 40,000 employees under it. It looks forward to prosper in terms of
growth, customers, communities and great service provider. It was consideded as one of the most
sustainable bank as per Dow Jones Sustainability Index in 2017 which was for the fourth time in
a row (Atkinson, 2012).
For a better picture of both the companies, we have discussed the following financial aspects of
both the companies’ along with a comparison analysis between the two.
ANALYSIS OF EQUITY
The equity of a company refers to shareholder's funds or monies invested by shareholders who
get the shares of the company. Such shares could be equity or preference shares or both. Also,
retained earnings and reserves and surpluses or deficits form a part of equity (Berry, 2009).
Discussion on each item of equity for both the companies
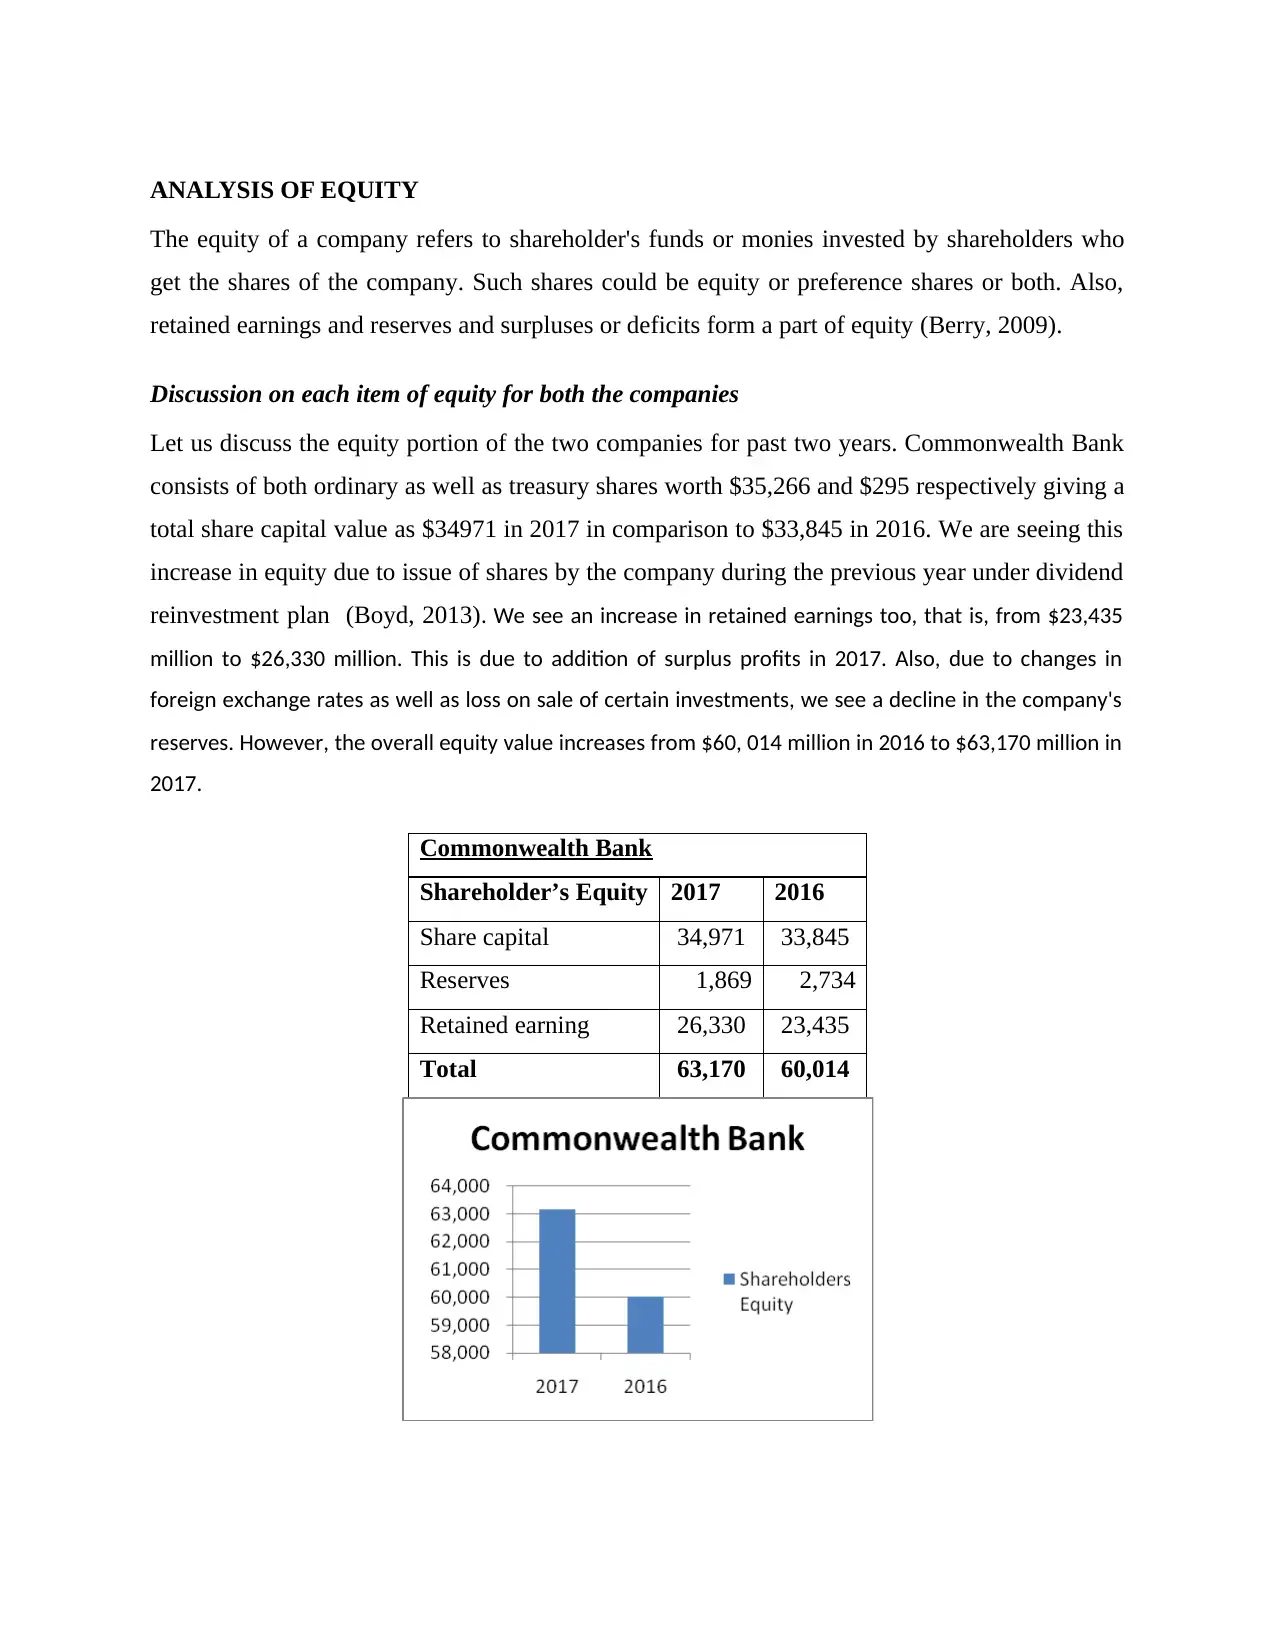
Let us discuss the equity portion of the two companies for past two years. Commonwealth Bank
consists of both ordinary as well as treasury shares worth $35,266 and $295 respectively giving a
total share capital value as $34971 in 2017 in comparison to $33,845 in 2016. We are seeing this
increase in equity due to issue of shares by the company during the previous year under dividend
reinvestment plan (Boyd, 2013). We see an increase in retained earnings too, that is, from $23,435
million to $26,330 million. This is due to addition of surplus profits in 2017. Also, due to changes in
foreign exchange rates as well as loss on sale of certain investments, we see a decline in the company's
reserves. However, the overall equity value increases from $60, 014 million in 2016 to $63,170 million in
2017.
Commonwealth Bank
Shareholder’s Equity 2017 2016
Share capital 34,971 33,845
Reserves 1,869 2,734
Retained earning 26,330 23,435
Total 63,170 60,014
The equity of a company refers to shareholder's funds or monies invested by shareholders who
get the shares of the company. Such shares could be equity or preference shares or both. Also,
retained earnings and reserves and surpluses or deficits form a part of equity (Berry, 2009).
Discussion on each item of equity for both the companies
Let us discuss the equity portion of the two companies for past two years. Commonwealth Bank
consists of both ordinary as well as treasury shares worth $35,266 and $295 respectively giving a
total share capital value as $34971 in 2017 in comparison to $33,845 in 2016. We are seeing this
increase in equity due to issue of shares by the company during the previous year under dividend
reinvestment plan (Boyd, 2013). We see an increase in retained earnings too, that is, from $23,435
million to $26,330 million. This is due to addition of surplus profits in 2017. Also, due to changes in
foreign exchange rates as well as loss on sale of certain investments, we see a decline in the company's
reserves. However, the overall equity value increases from $60, 014 million in 2016 to $63,170 million in
2017.
Commonwealth Bank
Shareholder’s Equity 2017 2016
Share capital 34,971 33,845
Reserves 1,869 2,734
Retained earning 26,330 23,435
Total 63,170 60,014
⊘ This is a preview!⊘
Do you want full access?
Subscribe today to unlock all pages.
Trusted by 1+ million students worldwide
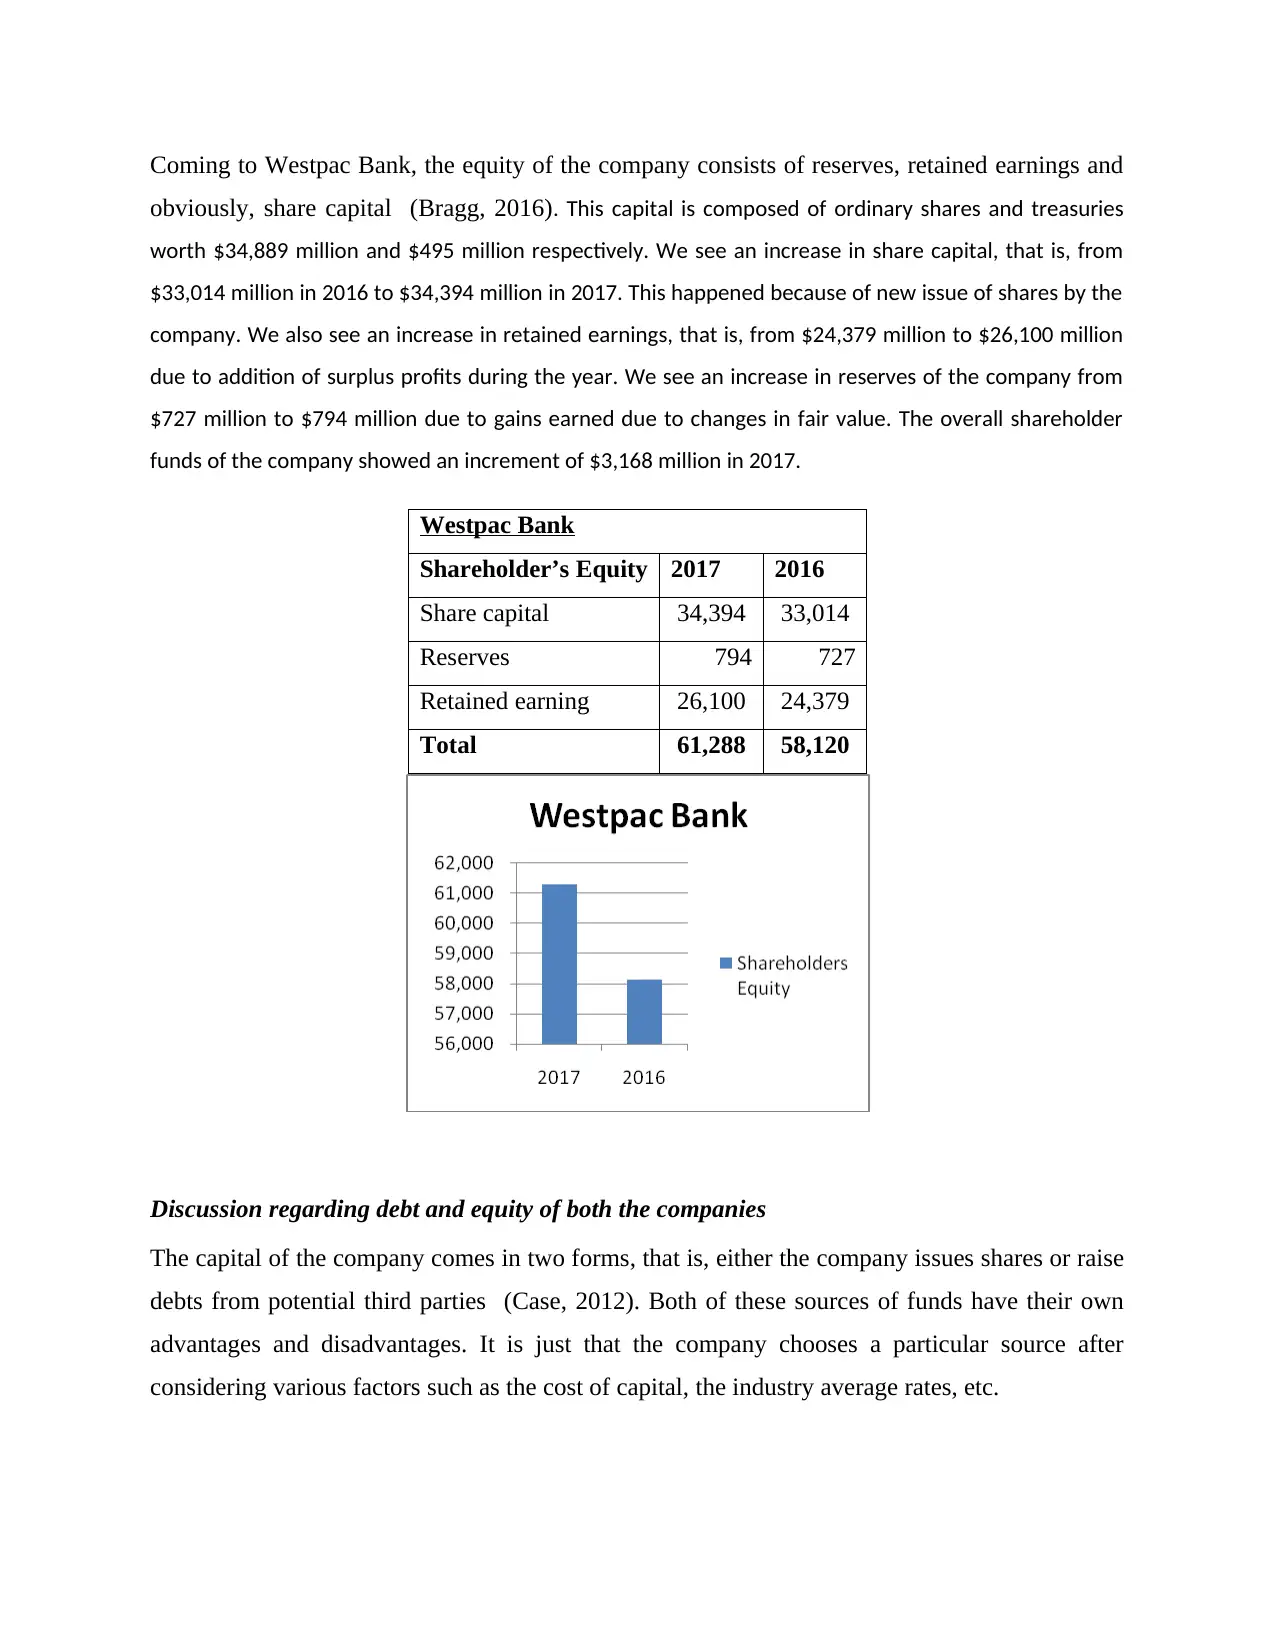
Coming to Westpac Bank, the equity of the company consists of reserves, retained earnings and
obviously, share capital (Bragg, 2016). This capital is composed of ordinary shares and treasuries
worth $34,889 million and $495 million respectively. We see an increase in share capital, that is, from
$33,014 million in 2016 to $34,394 million in 2017. This happened because of new issue of shares by the
company. We also see an increase in retained earnings, that is, from $24,379 million to $26,100 million
due to addition of surplus profits during the year. We see an increase in reserves of the company from
$727 million to $794 million due to gains earned due to changes in fair value. The overall shareholder
funds of the company showed an increment of $3,168 million in 2017.
Westpac Bank
Shareholder’s Equity 2017 2016
Share capital 34,394 33,014
Reserves 794 727
Retained earning 26,100 24,379
Total 61,288 58,120
Discussion regarding debt and equity of both the companies
The capital of the company comes in two forms, that is, either the company issues shares or raise
debts from potential third parties (Case, 2012). Both of these sources of funds have their own
advantages and disadvantages. It is just that the company chooses a particular source after
considering various factors such as the cost of capital, the industry average rates, etc.
Paraphrase This Document
Need a fresh take? Get an instant paraphrase of this document with our AI Paraphraser
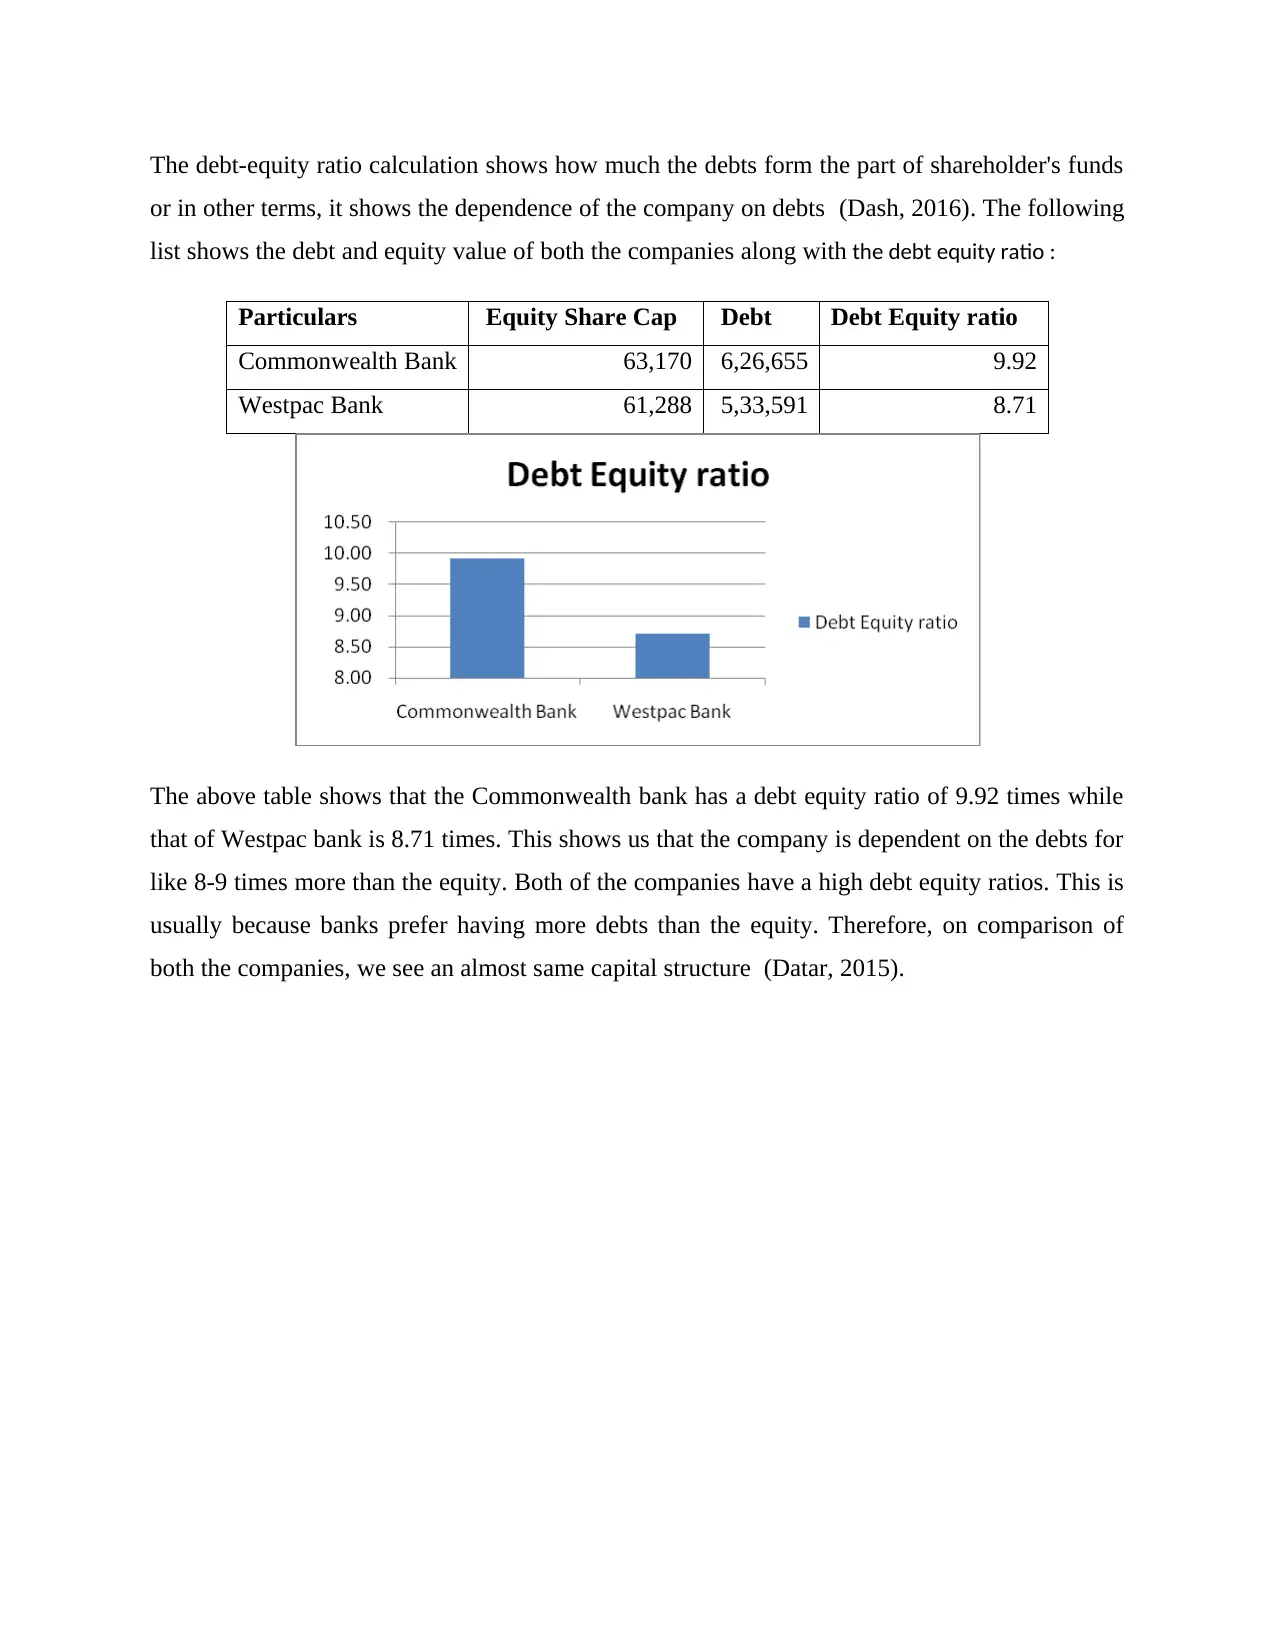
The debt-equity ratio calculation shows how much the debts form the part of shareholder's funds
or in other terms, it shows the dependence of the company on debts (Dash, 2016). The following
list shows the debt and equity value of both the companies along with the debt equity ratio :
Particulars Equity Share Cap Debt Debt Equity ratio
Commonwealth Bank 63,170 6,26,655 9.92
Westpac Bank 61,288 5,33,591 8.71
The above table shows that the Commonwealth bank has a debt equity ratio of 9.92 times while
that of Westpac bank is 8.71 times. This shows us that the company is dependent on the debts for
like 8-9 times more than the equity. Both of the companies have a high debt equity ratios. This is
usually because banks prefer having more debts than the equity. Therefore, on comparison of
both the companies, we see an almost same capital structure (Datar, 2015).
ANALYSIS OF CASH FLOW STATEMENT
There are two bases to prepare the cash flow statement, either on the cash basis or the accrual
basis. The two companies prepare their cash flow statements on the accrual basis. It is important
for a company to prepare this statement to know the actual inflow or outflow of cash in the
company and thereby, let the users know about the liquidity status of the company (Donanldson,
2012).
Discussion regarding Cash Flow Statement:
In case of Commonwealth bank:
Operating activities consists of investment incomes and Interest payments as those are the
main activities of the business.
Investing activities consists of cash flows from sale and acquirement of associates or
subsidiaries, investments, fixed assets and investment incomes in the form of dividend.
Financing activities consists of repayments and proceeds of leverage funds (debts) and
equity.
The outflow of cash from the operating activities in $807 million in 2017 in comparison to
$4,561 million in 2016. Such a decline is visualized due to increase in inflow from interest
incomes and investments incomes. We see a decline in cash flowing out from investment
activities, that is, from $2,032 million in 2016 to $677 million in 2017. This decline took place
due to non payments for acquiring of certain entities that are under control, less purchases of
property, plant and equipment & intangible assets. We see an increment in cash inflows in case
of financing activities which is due to lesser outflow from redemption of debt instruments.
On an overall basis, we see a positive result as there is an increase from the negative balance of
$4,973 million in 2016 to the positive balance of $8,988 million in 2017.
In case of Westpac bank :
Operating activities consists of cash flowing from proceeds of insurance, interest and
income tax.
⊘ This is a preview!⊘
Do you want full access?
Subscribe today to unlock all pages.
Trusted by 1+ million students worldwide
Investing activities consists of cash flows from sale and acquirement of associates or
subsidiaries, investments, both intangible & tangible assets and various other securities.
Financing activities consists of repayments and proceeds of leverage funds (debts) and
equity.
As we can see, Westpac shows a decline in the cash flowing due to operating activities, that is,
from $5,497 million in 2016 to $2,820 million in 2017 which happened due to losses incurred
from valuations of the investments according to fair value method. It shows a decline in cash
outflows too from $7,245 million in 2016 to $1,698 million in 2017 which took place majorly
due to increase in proceeds from sale of associates and securities. Similarly, we again see a
decline in inflows in case of financing activities from $4,573 million to $552 million in 2017.
This took place due to increase in out flowing of cash in the form of redemption of loans and
issue of debts in lower proportions (Flood, 2017).
On an overall basis, we see a decline in net cash flow by approximately $1,151 million in the
current year 2017.
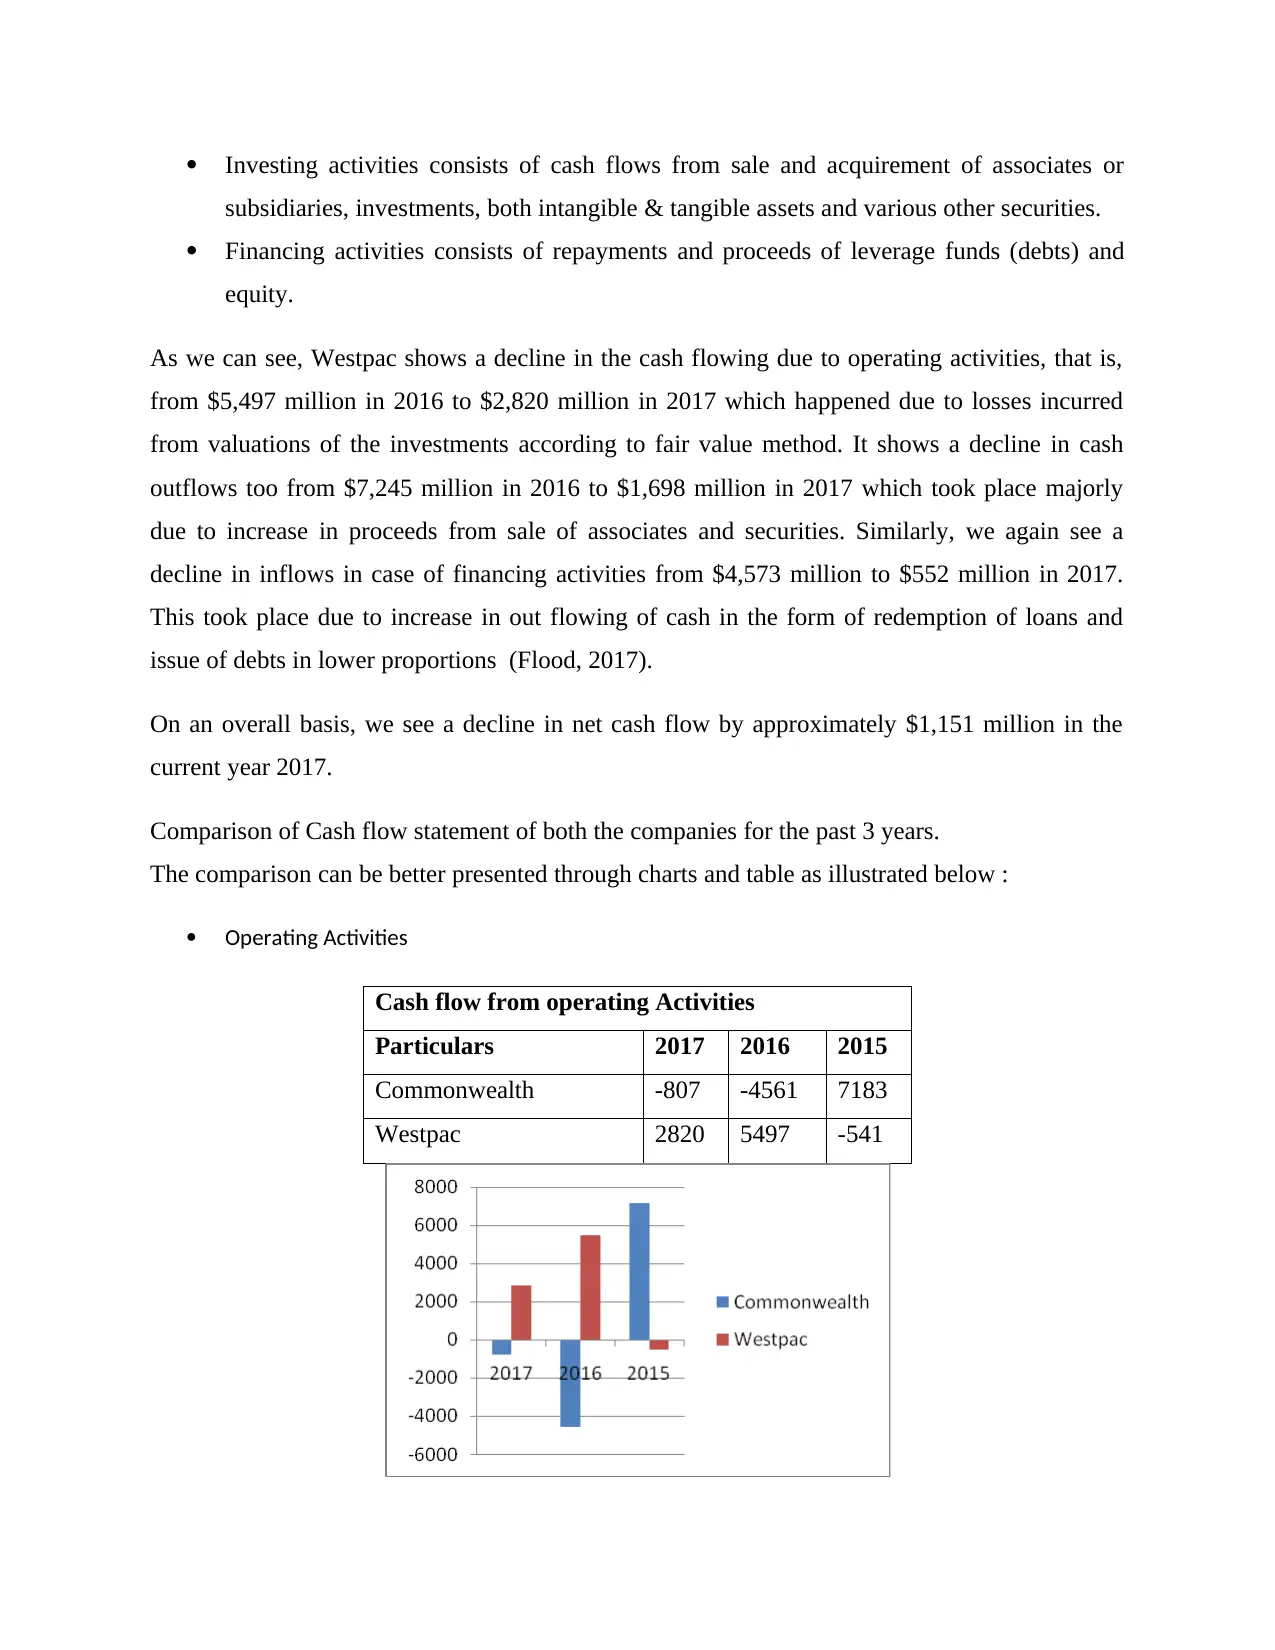
Comparison of Cash flow statement of both the companies for the past 3 years.
The comparison can be better presented through charts and table as illustrated below :
Operating Activities
Cash flow from operating Activities
Particulars 2017 2016 2015
Commonwealth -807 -4561 7183
Westpac 2820 5497 -541
subsidiaries, investments, both intangible & tangible assets and various other securities.
Financing activities consists of repayments and proceeds of leverage funds (debts) and
equity.
As we can see, Westpac shows a decline in the cash flowing due to operating activities, that is,
from $5,497 million in 2016 to $2,820 million in 2017 which happened due to losses incurred
from valuations of the investments according to fair value method. It shows a decline in cash
outflows too from $7,245 million in 2016 to $1,698 million in 2017 which took place majorly
due to increase in proceeds from sale of associates and securities. Similarly, we again see a
decline in inflows in case of financing activities from $4,573 million to $552 million in 2017.
This took place due to increase in out flowing of cash in the form of redemption of loans and
issue of debts in lower proportions (Flood, 2017).
On an overall basis, we see a decline in net cash flow by approximately $1,151 million in the
current year 2017.
Comparison of Cash flow statement of both the companies for the past 3 years.
The comparison can be better presented through charts and table as illustrated below :
Operating Activities
Cash flow from operating Activities
Particulars 2017 2016 2015
Commonwealth -807 -4561 7183
Westpac 2820 5497 -541
Paraphrase This Document
Need a fresh take? Get an instant paraphrase of this document with our AI Paraphraser
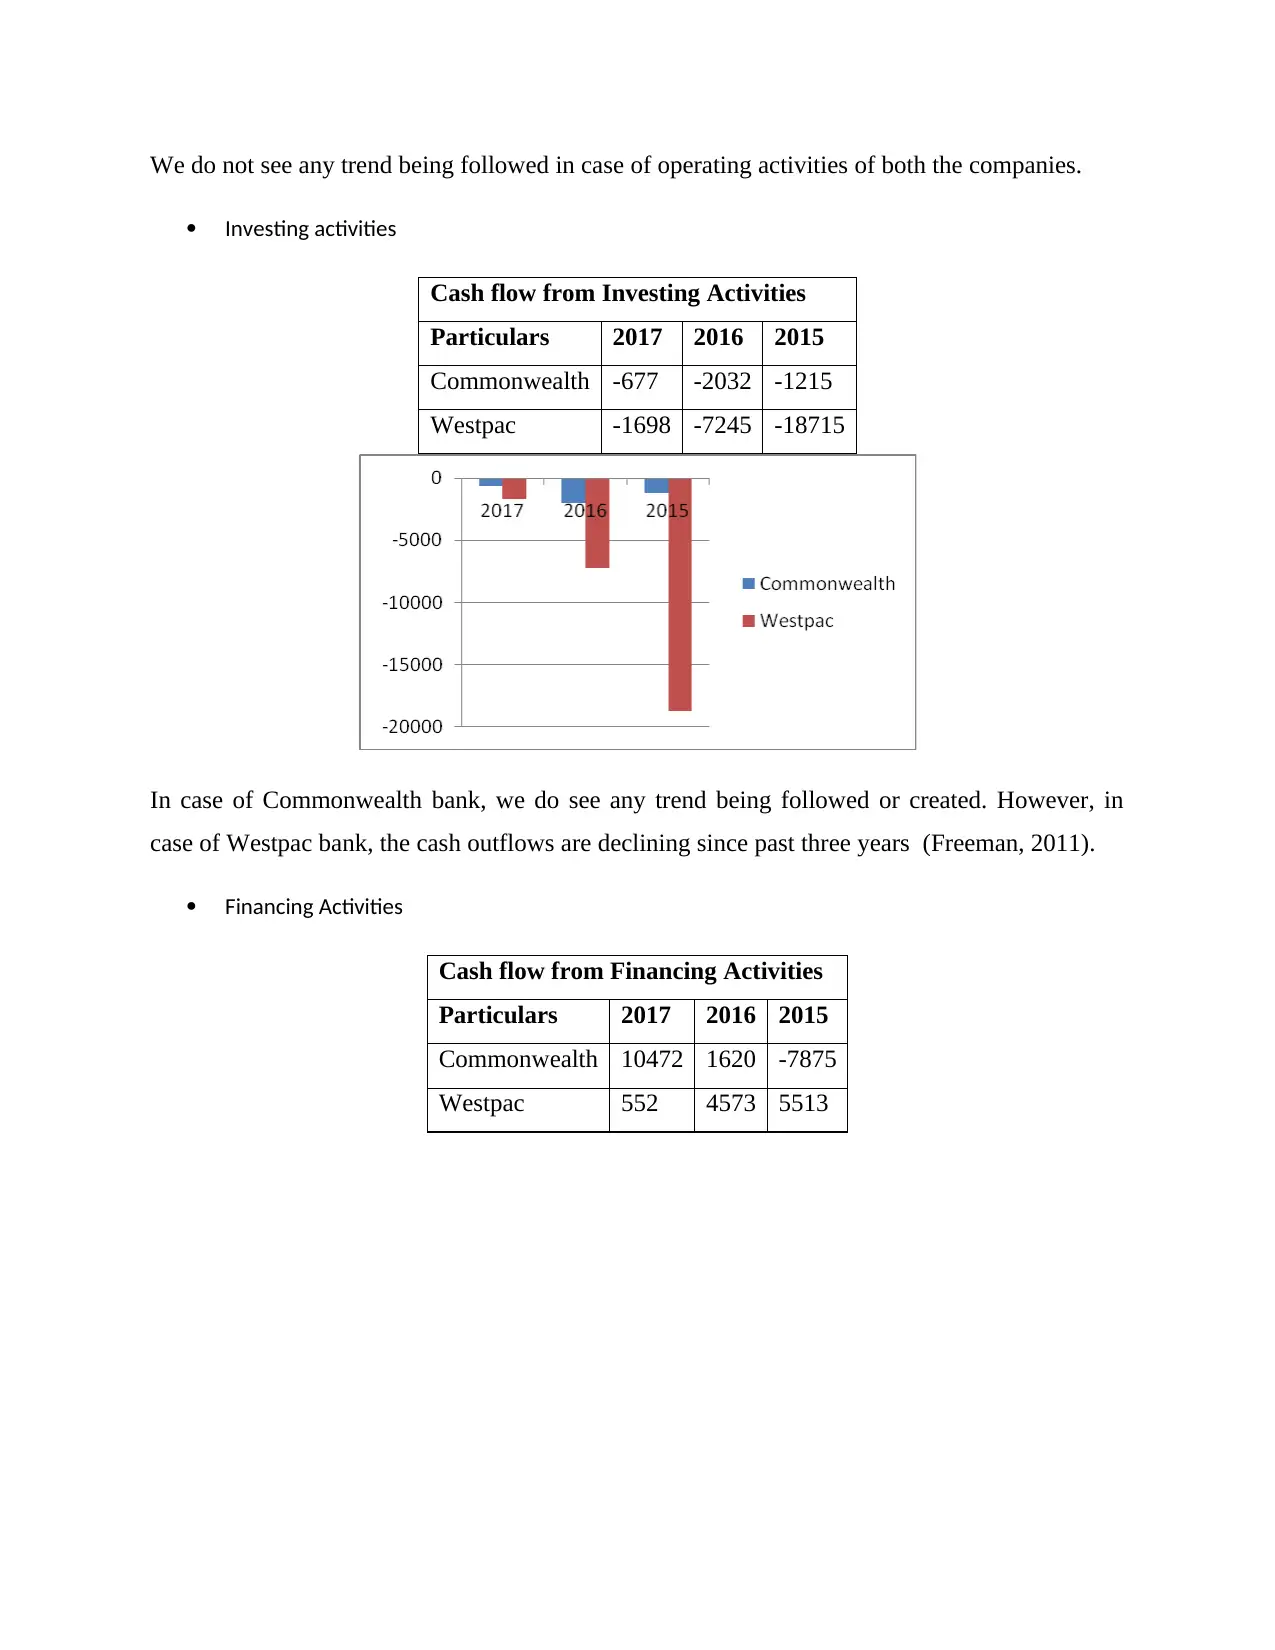
We do not see any trend being followed in case of operating activities of both the companies.
Investing activities
Cash flow from Investing Activities
Particulars 2017 2016 2015
Commonwealth -677 -2032 -1215
Westpac -1698 -7245 -18715
In case of Commonwealth bank, we do see any trend being followed or created. However, in
case of Westpac bank, the cash outflows are declining since past three years (Freeman, 2011).
Financing Activities
Cash flow from Financing Activities
Particulars 2017 2016 2015
Commonwealth 10472 1620 -7875
Westpac 552 4573 5513
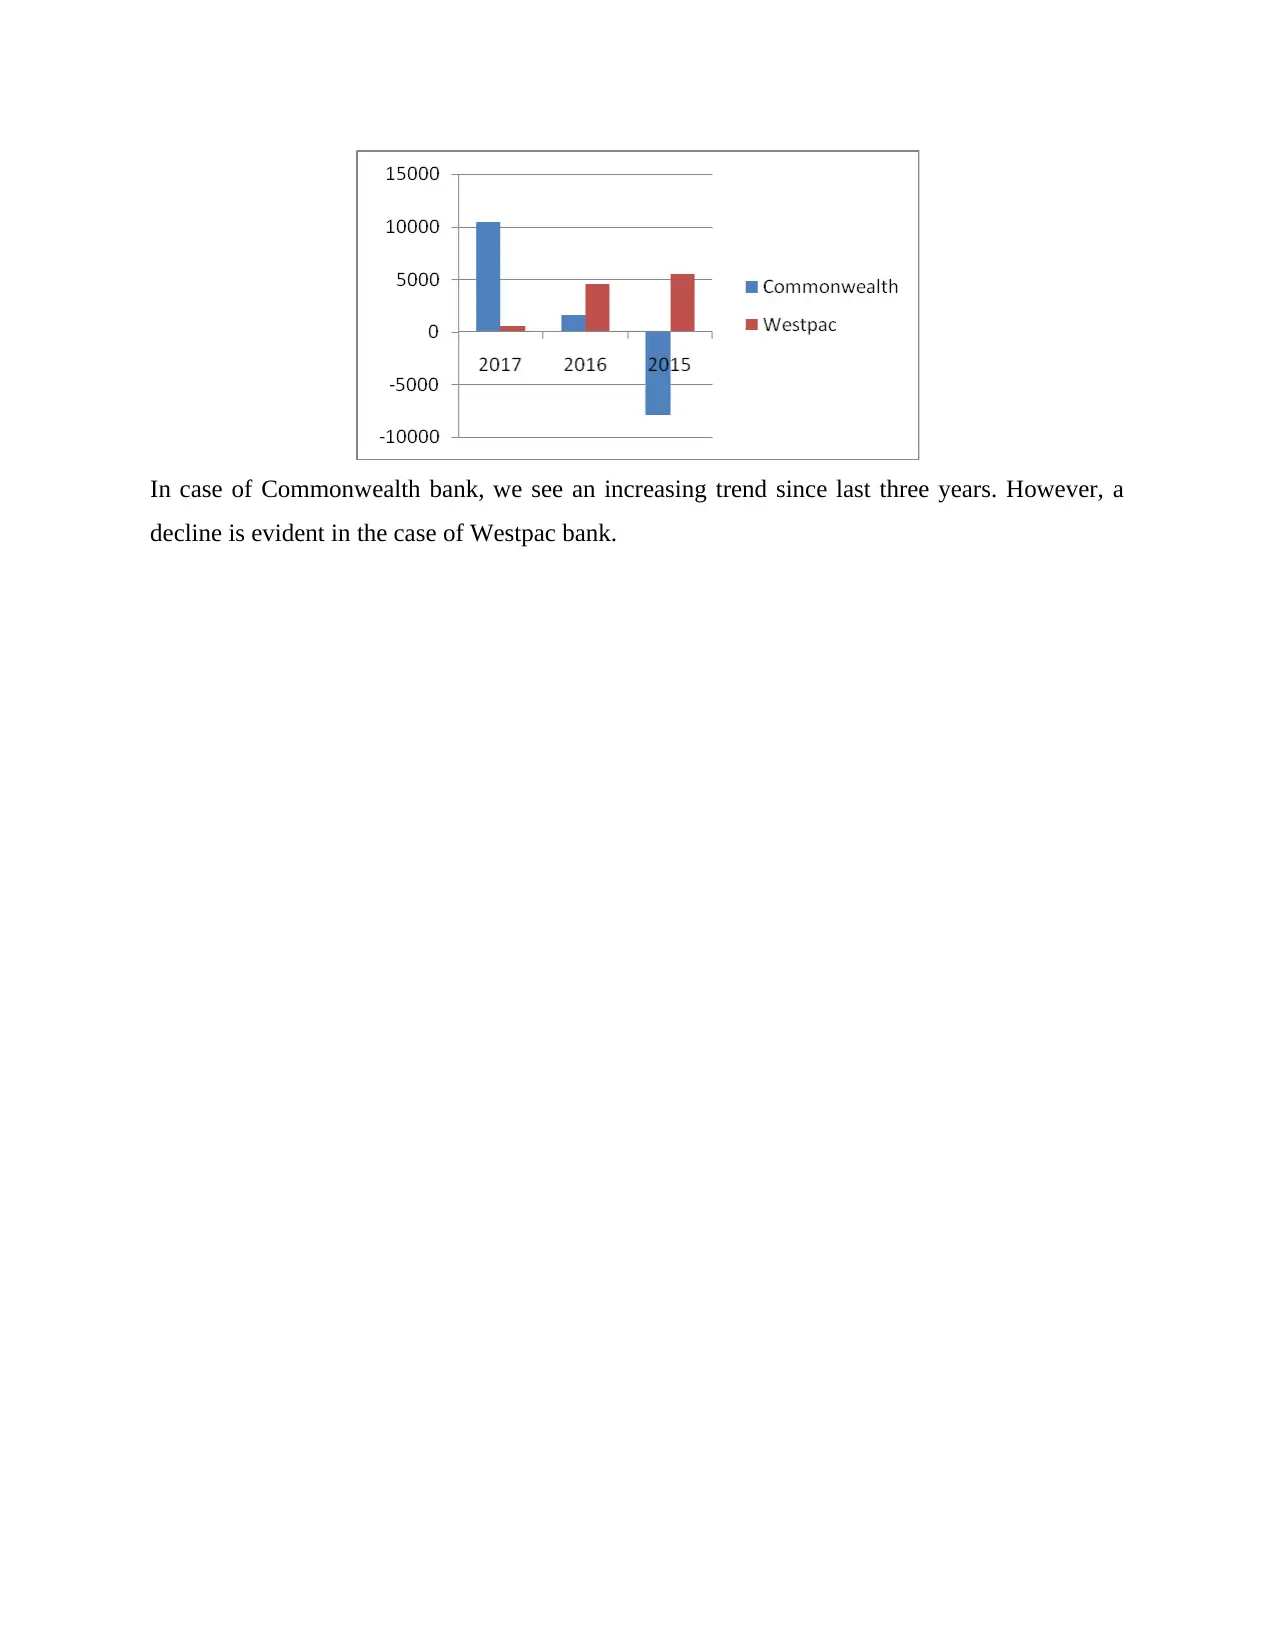
In case of Commonwealth bank, we see an increasing trend since last three years. However, a
decline is evident in the case of Westpac bank.
decline is evident in the case of Westpac bank.
⊘ This is a preview!⊘
Do you want full access?
Subscribe today to unlock all pages.
Trusted by 1+ million students worldwide
1 out of 22
Related Documents


Your All-in-One AI-Powered Toolkit for Academic Success.
+13062052269
info@desklib.com
Available 24*7 on WhatsApp / Email
![[object Object]](/_next/static/media/star-bottom.7253800d.svg)
Unlock your academic potential
Copyright © 2020–2026 A2Z Services. All Rights Reserved. Developed and managed by ZUCOL.