Corporate Accounting Report: AHG and AP Eagers Financial Analysis
VerifiedAdded on 2020/12/31
|18
|4816
|38
Report
AI Summary
This report provides a detailed corporate accounting analysis, focusing on the retailing industry, specifically Automotive Holdings Group (AHG) and AP Eagers. It examines owner's equity, including contributed equity, reserves, and retained earnings, along with their changes over time. The report also assesses the debt-equity positions of both organizations, highlighting that neither follows an optimal capital structure from a future perspective, with a heavy reliance on equity financing. A comprehensive review of the cash flow statements for both companies is provided, categorizing operating, investing, and financing activities, including comparative analyses and insights. The report also addresses other comprehensive income, its importance in performance evaluation, and the minor differences between cash tax and book tax rates. Finally, the analysis includes calculations of effective tax rates, deferred tax assets and liabilities, and cash tax amounts, along with a discussion on the differences between cash tax and book tax rates for both AHG and AP Eagers.

CORPORATE ACCOUNTING
Paraphrase This Document
Need a fresh take? Get an instant paraphrase of this document with our AI Paraphraser
EXECUTIVE SUMMARY
Corporate accounting is very useful for various activities such as amalgamation,
absorption and for preparing consolidated financial statements. The present report will discuss
about Retailing industry as Automotive Holdings Group and AP Eagers. It had been reflected
that both organization are not following optimal capital structure with future perspective. This
report had articulated every category of cash flow statement in which operating activity are
necessary for generating cash. Further, it will be concluded that other comprehensive income
must be considered for performance evaluation and cash tax rate and book tax rate has presence
of minor differences.
TABLE OF CONTENTS
INTRODUCTION...........................................................................................................................1
OWNER'S EQUITY........................................................................................................................1
1. Listing each item of equity with its changes from past years.................................................1
2. Stating debt equity position of both organization...................................................................2
CASH FLOW STATEMENT..........................................................................................................5
3. Listing each item of cash flow statement................................................................................5
4. Stating comparative analysis of companies on basis of its broad categories..........................6
5. Stating insights with above comparative analysis...................................................................7
OTHER COMPREHENSIVE INCOME STATEMENT................................................................8
6. Listing each item of comprehensive income statement..........................................................8
7. Stating reason for not including these items in income statement..........................................8
8. Stating comparative analysis of each item in this statement...................................................8
9. Other comprehensive income must be used for performance evaluation or not...................10
ACCOUNTING FOR CORPORATE INCOME TAX..................................................................11
10. Stating tax expense on basis of the latest financial statements...........................................11
11. Calculating effective tax rate of both organization.............................................................11
12. Stating comment on deferred tax liability and asset in balance sheet.................................11
13. Stating change in deferred tax asset and liability in each organization..............................12
14. Calculating cash tax amount with book tax and change in DTA and DTL........................12
15. Calculating cash tax rate.....................................................................................................13
16. Stating difference between cash tax and book tax rate.......................................................13
CONCLUSION..............................................................................................................................14
REFERENCES..............................................................................................................................15
⊘ This is a preview!⊘
Do you want full access?
Subscribe today to unlock all pages.
Trusted by 1+ million students worldwide
INTRODUCTION
Corporate accounting is referred as special branch of accounting which is used for
preparation of financial statements. The main focus for applying accounting techniques in a
corporate sector is to prepare consolidated statements related to finance. The present report will
discuss about the retailing industry and this will include about description of the annual reports
of Automotive Holdings Group and AP Eagers. It will articulate about owner's equity with its
changes from past years and capital structure for both organizations through comparative
analysis. It will also state importance of other comprehensive income statements with its
alterations and items which are classified. Further, it will discuss about cash flow statement and
accounting for corporate income tax.
OWNER'S EQUITY
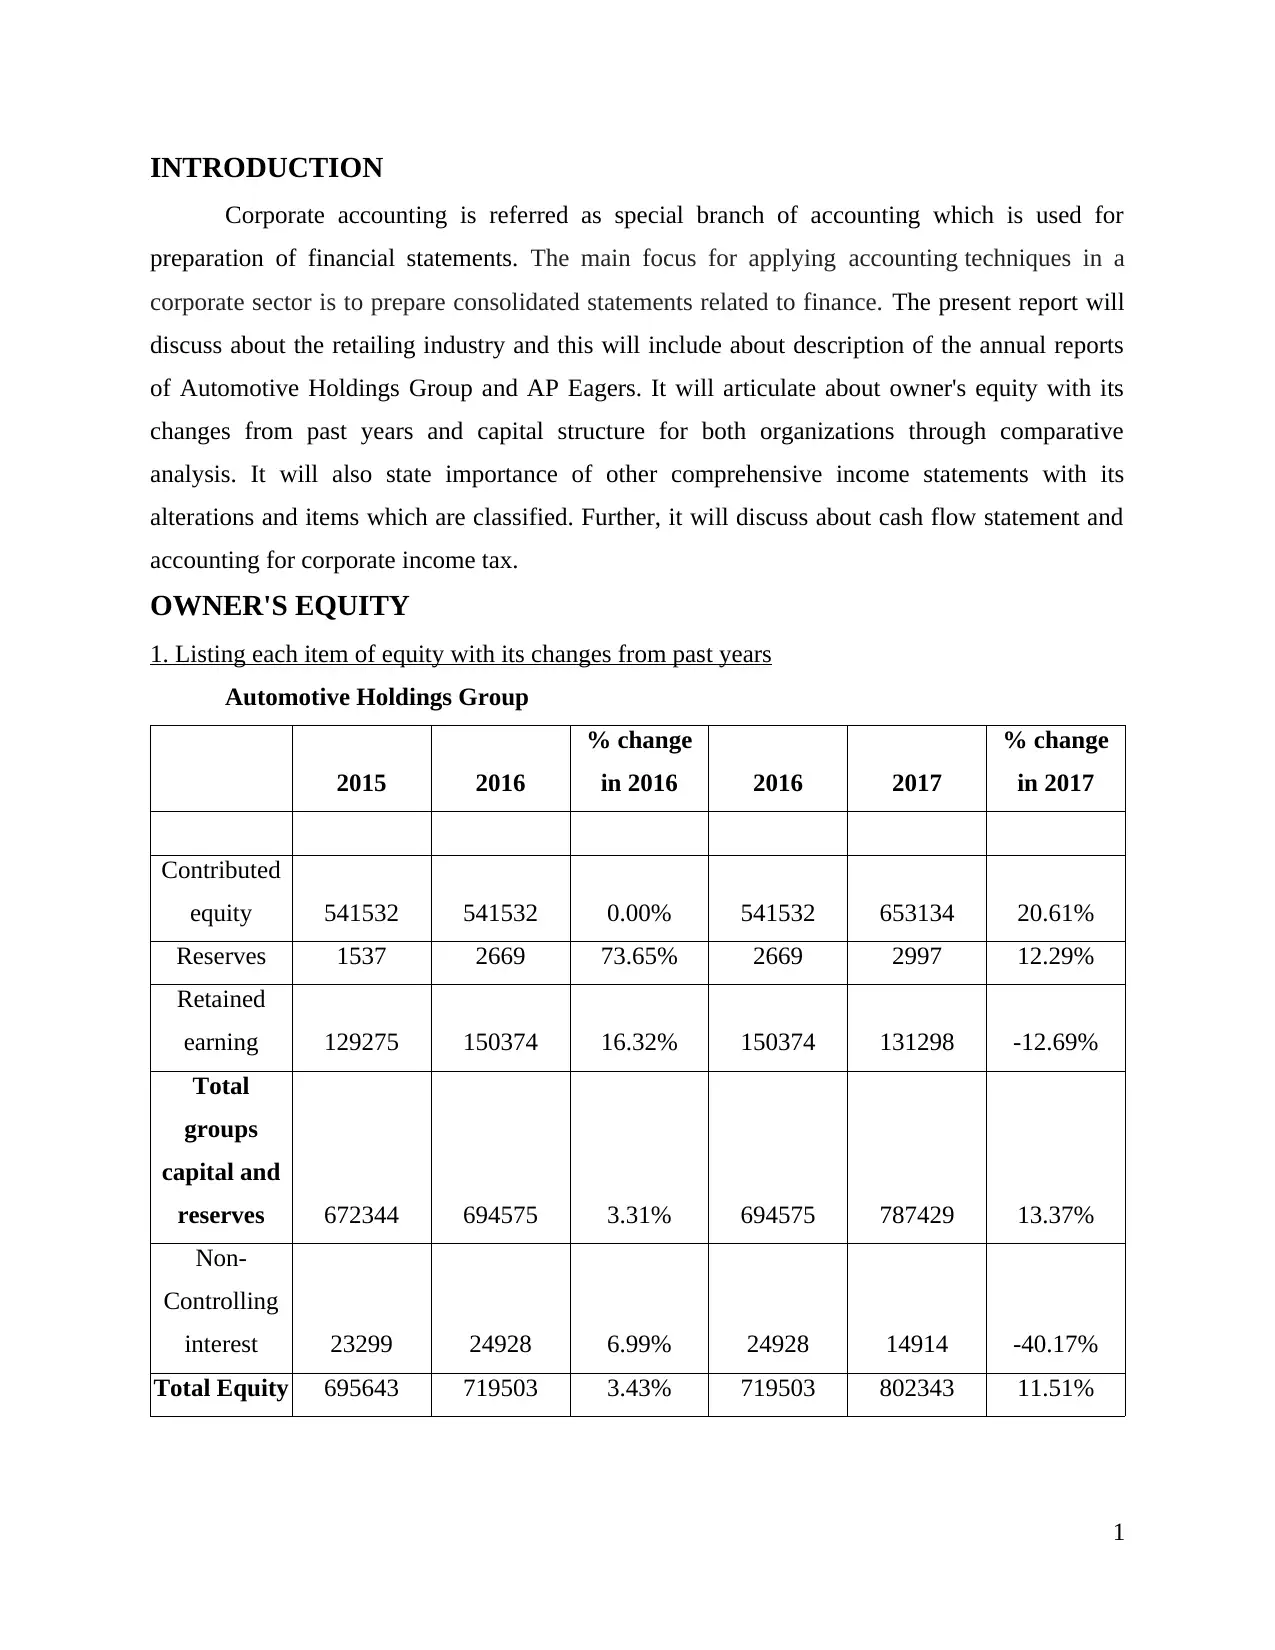
1. Listing each item of equity with its changes from past years
Automotive Holdings Group
2015 2016
% change
in 2016 2016 2017
% change
in 2017
Contributed
equity 541532 541532 0.00% 541532 653134 20.61%
Reserves 1537 2669 73.65% 2669 2997 12.29%
Retained
earning 129275 150374 16.32% 150374 131298 -12.69%
Total
groups
capital and
reserves 672344 694575 3.31% 694575 787429 13.37%
Non-
Controlling
interest 23299 24928 6.99% 24928 14914 -40.17%
Total Equity 695643 719503 3.43% 719503 802343 11.51%
1
Corporate accounting is referred as special branch of accounting which is used for
preparation of financial statements. The main focus for applying accounting techniques in a
corporate sector is to prepare consolidated statements related to finance. The present report will
discuss about the retailing industry and this will include about description of the annual reports
of Automotive Holdings Group and AP Eagers. It will articulate about owner's equity with its
changes from past years and capital structure for both organizations through comparative
analysis. It will also state importance of other comprehensive income statements with its
alterations and items which are classified. Further, it will discuss about cash flow statement and
accounting for corporate income tax.
OWNER'S EQUITY
1. Listing each item of equity with its changes from past years
Automotive Holdings Group
2015 2016
% change
in 2016 2016 2017
% change
in 2017
Contributed
equity 541532 541532 0.00% 541532 653134 20.61%
Reserves 1537 2669 73.65% 2669 2997 12.29%
Retained
earning 129275 150374 16.32% 150374 131298 -12.69%
Total
groups
capital and
reserves 672344 694575 3.31% 694575 787429 13.37%
Non-
Controlling
interest 23299 24928 6.99% 24928 14914 -40.17%
Total Equity 695643 719503 3.43% 719503 802343 11.51%
1
Paraphrase This Document
Need a fresh take? Get an instant paraphrase of this document with our AI Paraphraser
Interpretation: Owner's equity is very important for each business entity. The above table
is signifying every element of total equity with its differences from past years. It consists of
reserves, contributed equity and retained earnings and along with this, non-controlling interest
also gives impact on total equity. From 2015 to 2016, its contributed equity was same but rest
components increased as its reserves rose by 73.65%.
In similar aspects, its retained earnings and non-controlling interest increased by 16.32%
and 6.99% respectively. However, in 2017, its contributed equity also increased by 20.61%
which was constant in previous year. The retained earnings of Automotive Holdings Group got
decreased but with less proportion at 12.69% and along with this, non-controlling interest
decreased by 40.17%. Hence, total equity was increased in 2017 by 11.51% which was less in
previous year of 3.43% (Edwards, 2018).
AP Eagers
2015 2016
% change
in 2016 2016 2017
% change
in 2017
Contributed
equity 296060 364449 23.10% 364449 369028 1.26%
Reserves 105375 55398 -47.43% 55398 38131 -31.17%
Retained
earning 293435 335779 14.43% 335779 367855 9.55%
Non-
Controlling
interest 8139 8166 0.33% 8166 10761 31.78%
Total Equity 703009 763792 8.65% 763792 785775 2.88%
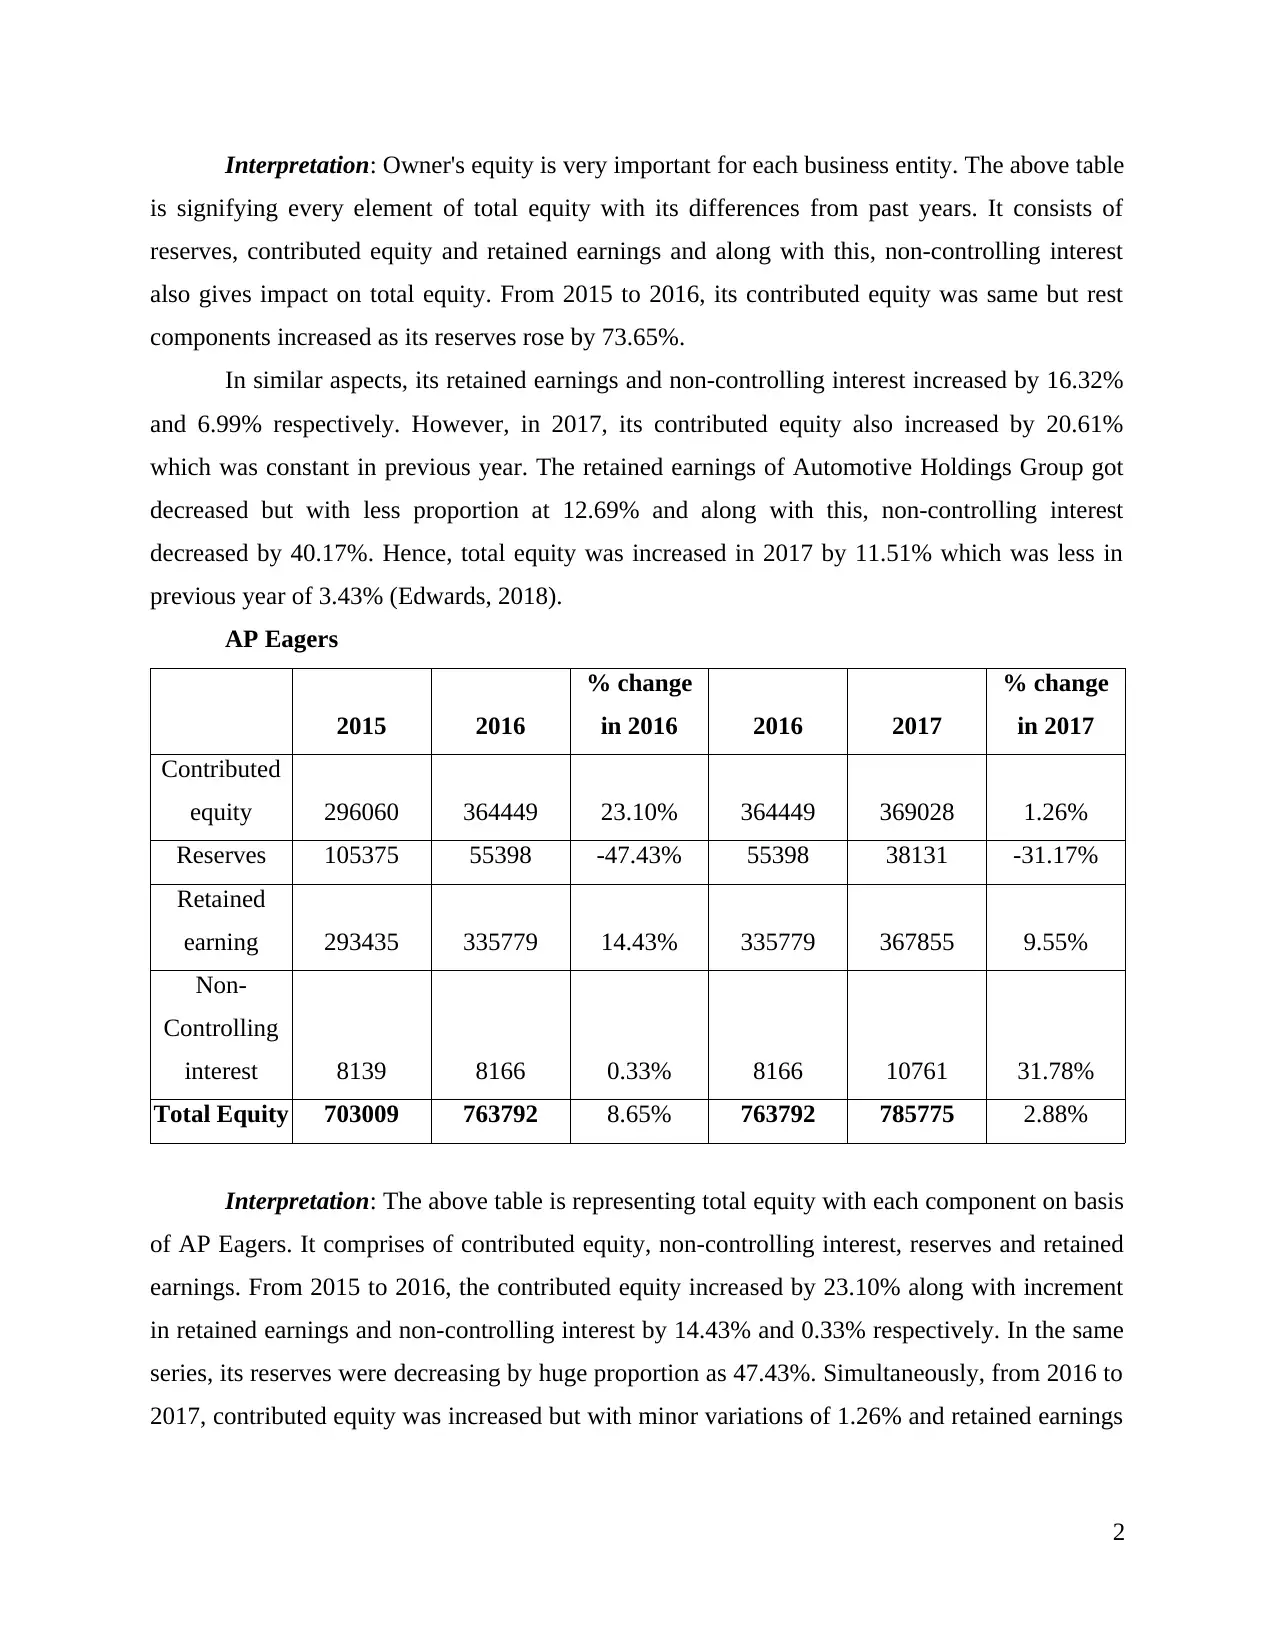
Interpretation: The above table is representing total equity with each component on basis
of AP Eagers. It comprises of contributed equity, non-controlling interest, reserves and retained
earnings. From 2015 to 2016, the contributed equity increased by 23.10% along with increment
in retained earnings and non-controlling interest by 14.43% and 0.33% respectively. In the same
series, its reserves were decreasing by huge proportion as 47.43%. Simultaneously, from 2016 to
2017, contributed equity was increased but with minor variations of 1.26% and retained earnings
2
is signifying every element of total equity with its differences from past years. It consists of
reserves, contributed equity and retained earnings and along with this, non-controlling interest
also gives impact on total equity. From 2015 to 2016, its contributed equity was same but rest
components increased as its reserves rose by 73.65%.
In similar aspects, its retained earnings and non-controlling interest increased by 16.32%
and 6.99% respectively. However, in 2017, its contributed equity also increased by 20.61%
which was constant in previous year. The retained earnings of Automotive Holdings Group got
decreased but with less proportion at 12.69% and along with this, non-controlling interest
decreased by 40.17%. Hence, total equity was increased in 2017 by 11.51% which was less in
previous year of 3.43% (Edwards, 2018).
AP Eagers
2015 2016
% change
in 2016 2016 2017
% change
in 2017
Contributed
equity 296060 364449 23.10% 364449 369028 1.26%
Reserves 105375 55398 -47.43% 55398 38131 -31.17%
Retained
earning 293435 335779 14.43% 335779 367855 9.55%
Non-
Controlling
interest 8139 8166 0.33% 8166 10761 31.78%
Total Equity 703009 763792 8.65% 763792 785775 2.88%
Interpretation: The above table is representing total equity with each component on basis
of AP Eagers. It comprises of contributed equity, non-controlling interest, reserves and retained
earnings. From 2015 to 2016, the contributed equity increased by 23.10% along with increment
in retained earnings and non-controlling interest by 14.43% and 0.33% respectively. In the same
series, its reserves were decreasing by huge proportion as 47.43%. Simultaneously, from 2016 to
2017, contributed equity was increased but with minor variations of 1.26% and retained earnings
2
by 9.55%. The impact of non-controlling interest is higher than previous year as 31.78% and
decrement in reserves of 31.17%.
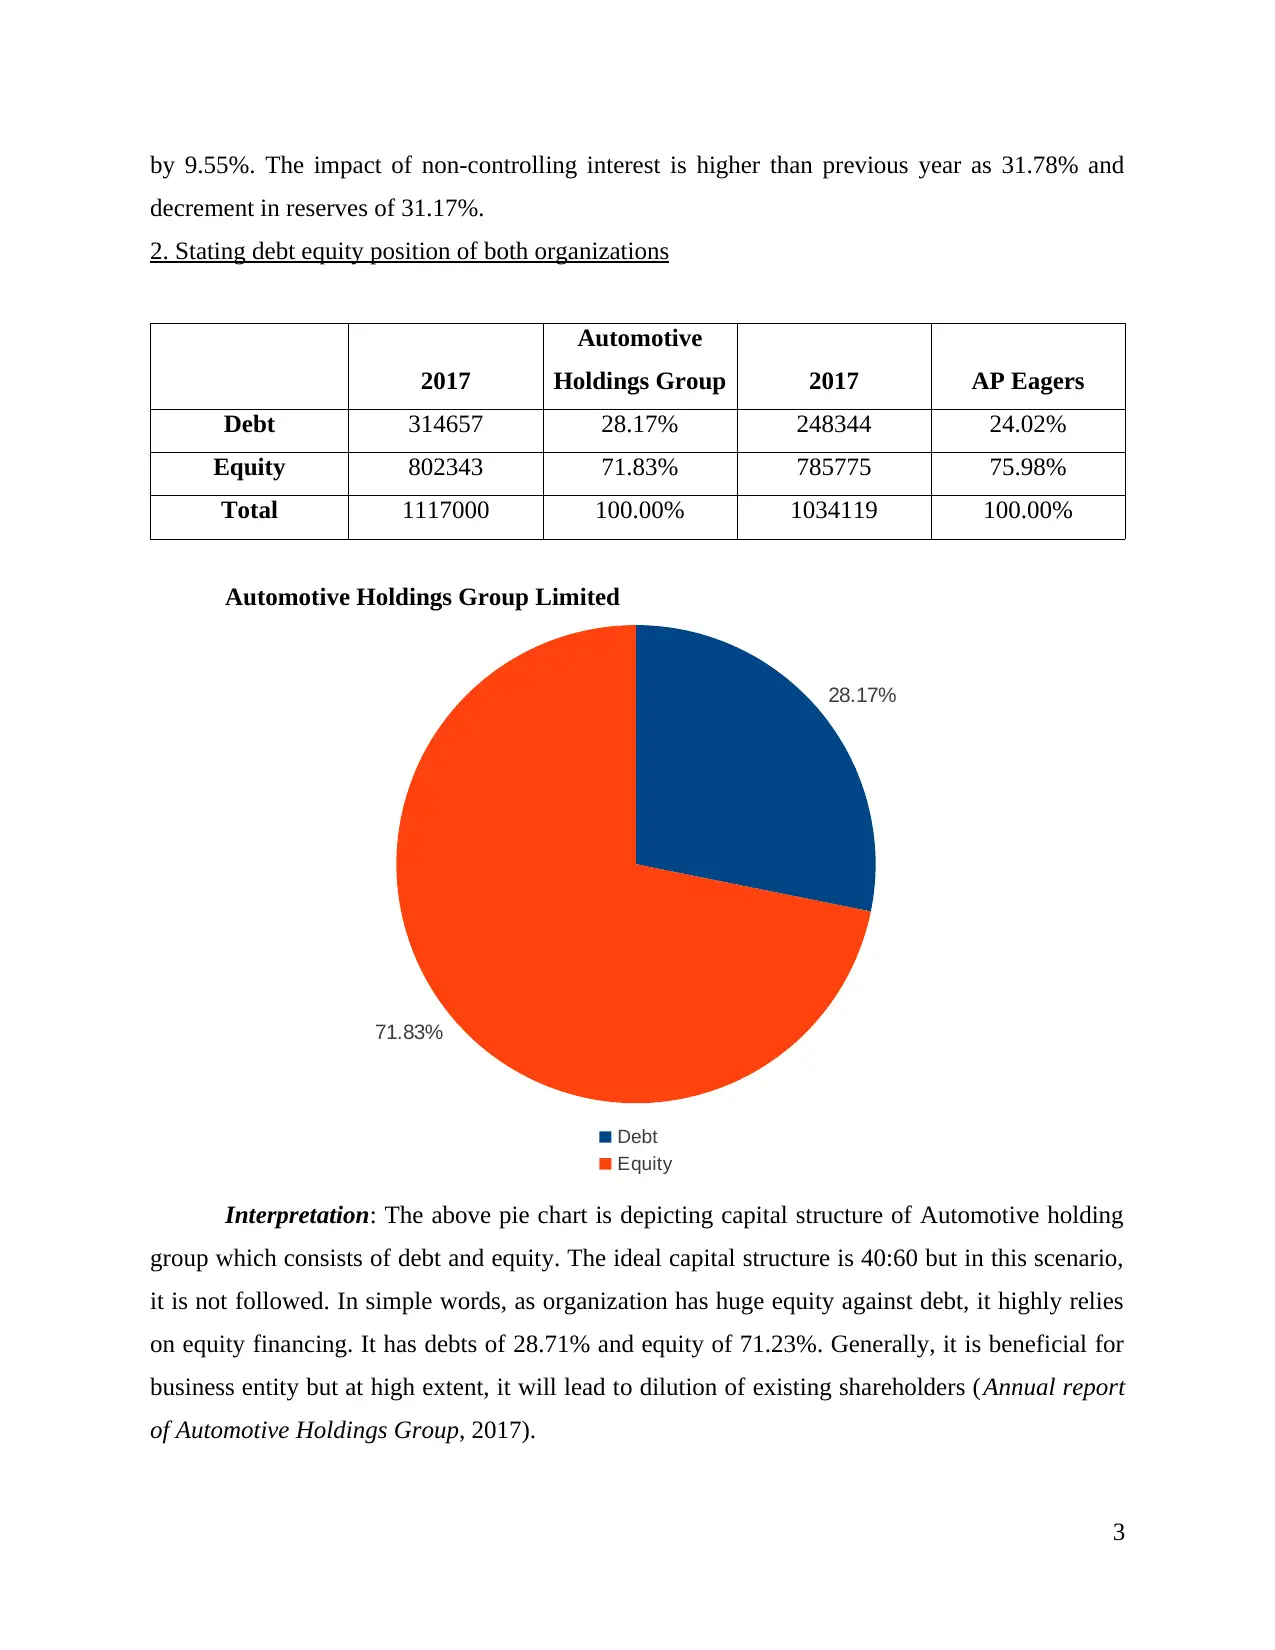
2. Stating debt equity position of both organizations
2017
Automotive
Holdings Group 2017 AP Eagers
Debt 314657 28.17% 248344 24.02%
Equity 802343 71.83% 785775 75.98%
Total 1117000 100.00% 1034119 100.00%
Automotive Holdings Group Limited
28.17%
71.83%
Debt
Equity
Interpretation: The above pie chart is depicting capital structure of Automotive holding
group which consists of debt and equity. The ideal capital structure is 40:60 but in this scenario,
it is not followed. In simple words, as organization has huge equity against debt, it highly relies
on equity financing. It has debts of 28.71% and equity of 71.23%. Generally, it is beneficial for
business entity but at high extent, it will lead to dilution of existing shareholders (Annual report
of Automotive Holdings Group, 2017).
3
decrement in reserves of 31.17%.
2. Stating debt equity position of both organizations
2017
Automotive
Holdings Group 2017 AP Eagers
Debt 314657 28.17% 248344 24.02%
Equity 802343 71.83% 785775 75.98%
Total 1117000 100.00% 1034119 100.00%
Automotive Holdings Group Limited
28.17%
71.83%
Debt
Equity
Interpretation: The above pie chart is depicting capital structure of Automotive holding
group which consists of debt and equity. The ideal capital structure is 40:60 but in this scenario,
it is not followed. In simple words, as organization has huge equity against debt, it highly relies
on equity financing. It has debts of 28.71% and equity of 71.23%. Generally, it is beneficial for
business entity but at high extent, it will lead to dilution of existing shareholders (Annual report
of Automotive Holdings Group, 2017).
3
⊘ This is a preview!⊘
Do you want full access?
Subscribe today to unlock all pages.
Trusted by 1+ million students worldwide
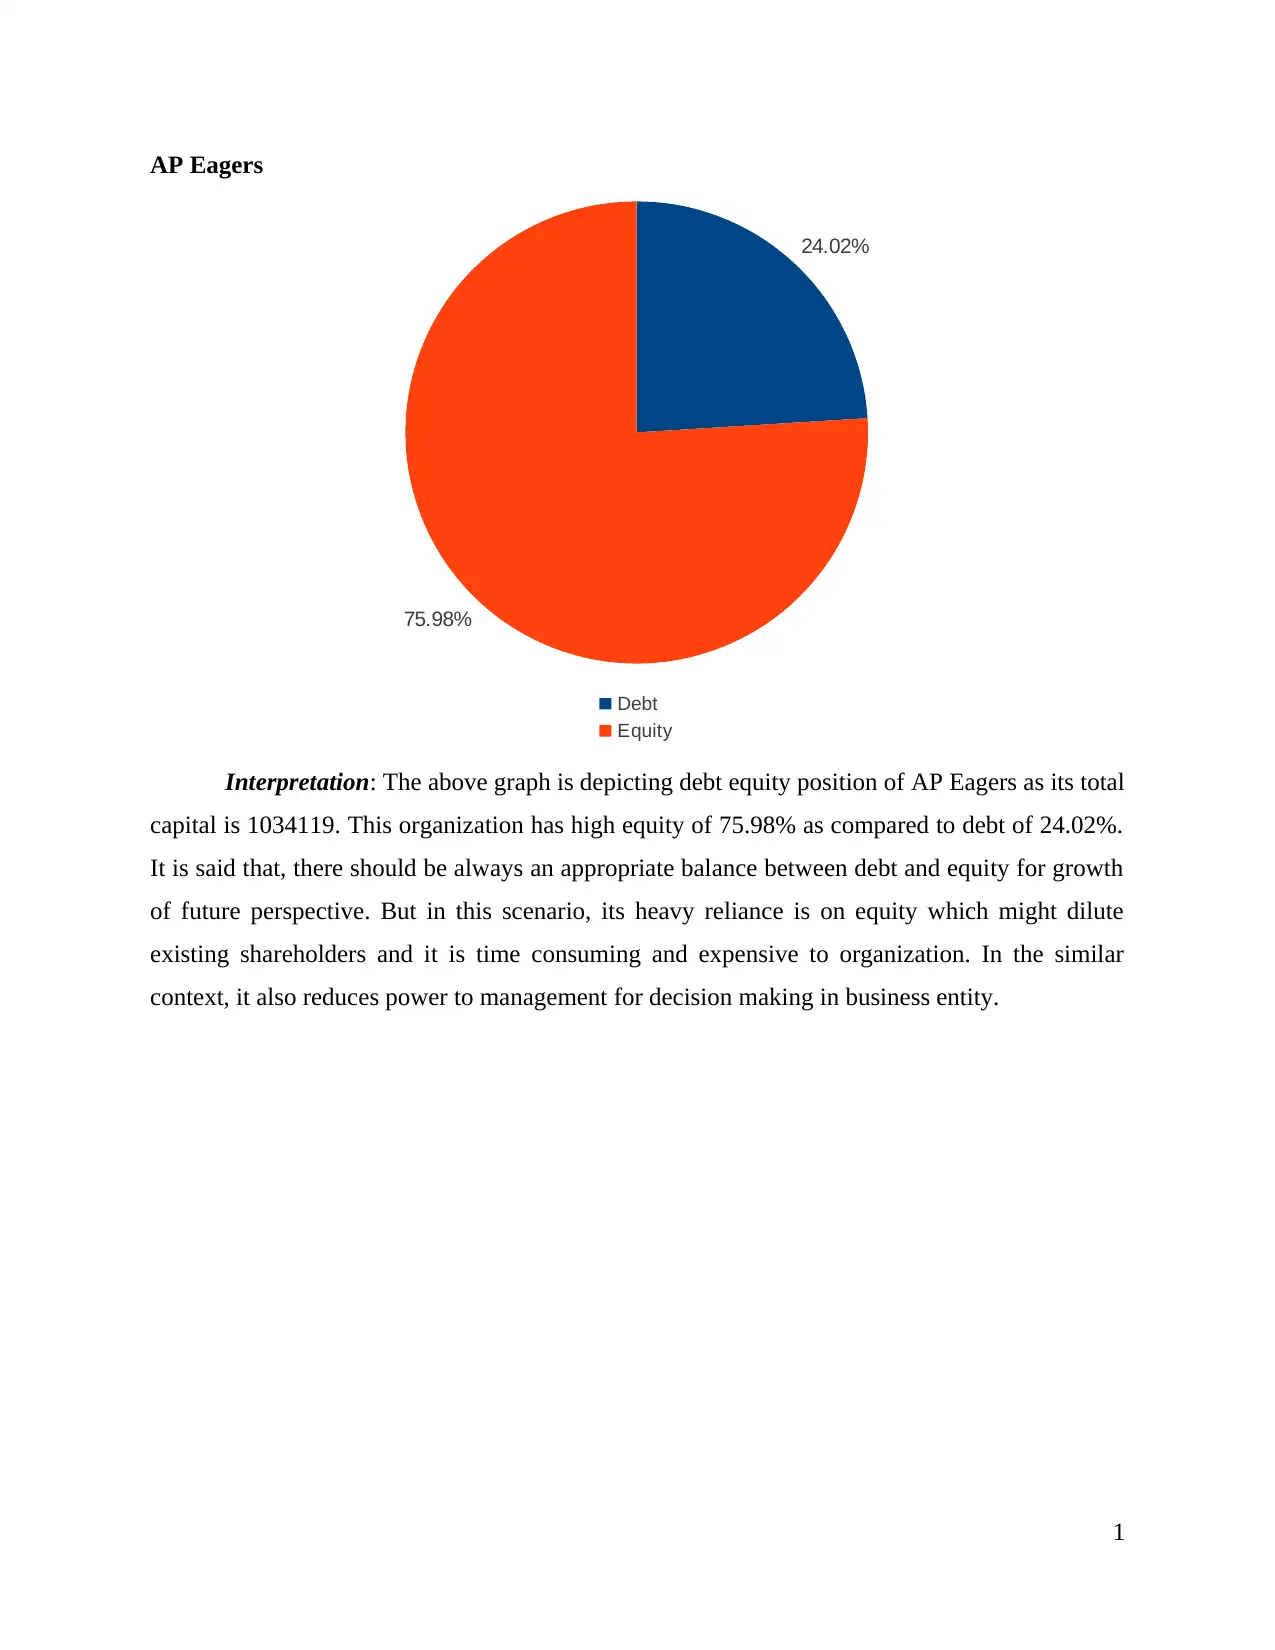
AP Eagers
24.02%
75.98%
Debt
Equity
Interpretation: The above graph is depicting debt equity position of AP Eagers as its total
capital is 1034119. This organization has high equity of 75.98% as compared to debt of 24.02%.
It is said that, there should be always an appropriate balance between debt and equity for growth
of future perspective. But in this scenario, its heavy reliance is on equity which might dilute
existing shareholders and it is time consuming and expensive to organization. In the similar
context, it also reduces power to management for decision making in business entity.
1
Paraphrase This Document
Need a fresh take? Get an instant paraphrase of this document with our AI Paraphraser
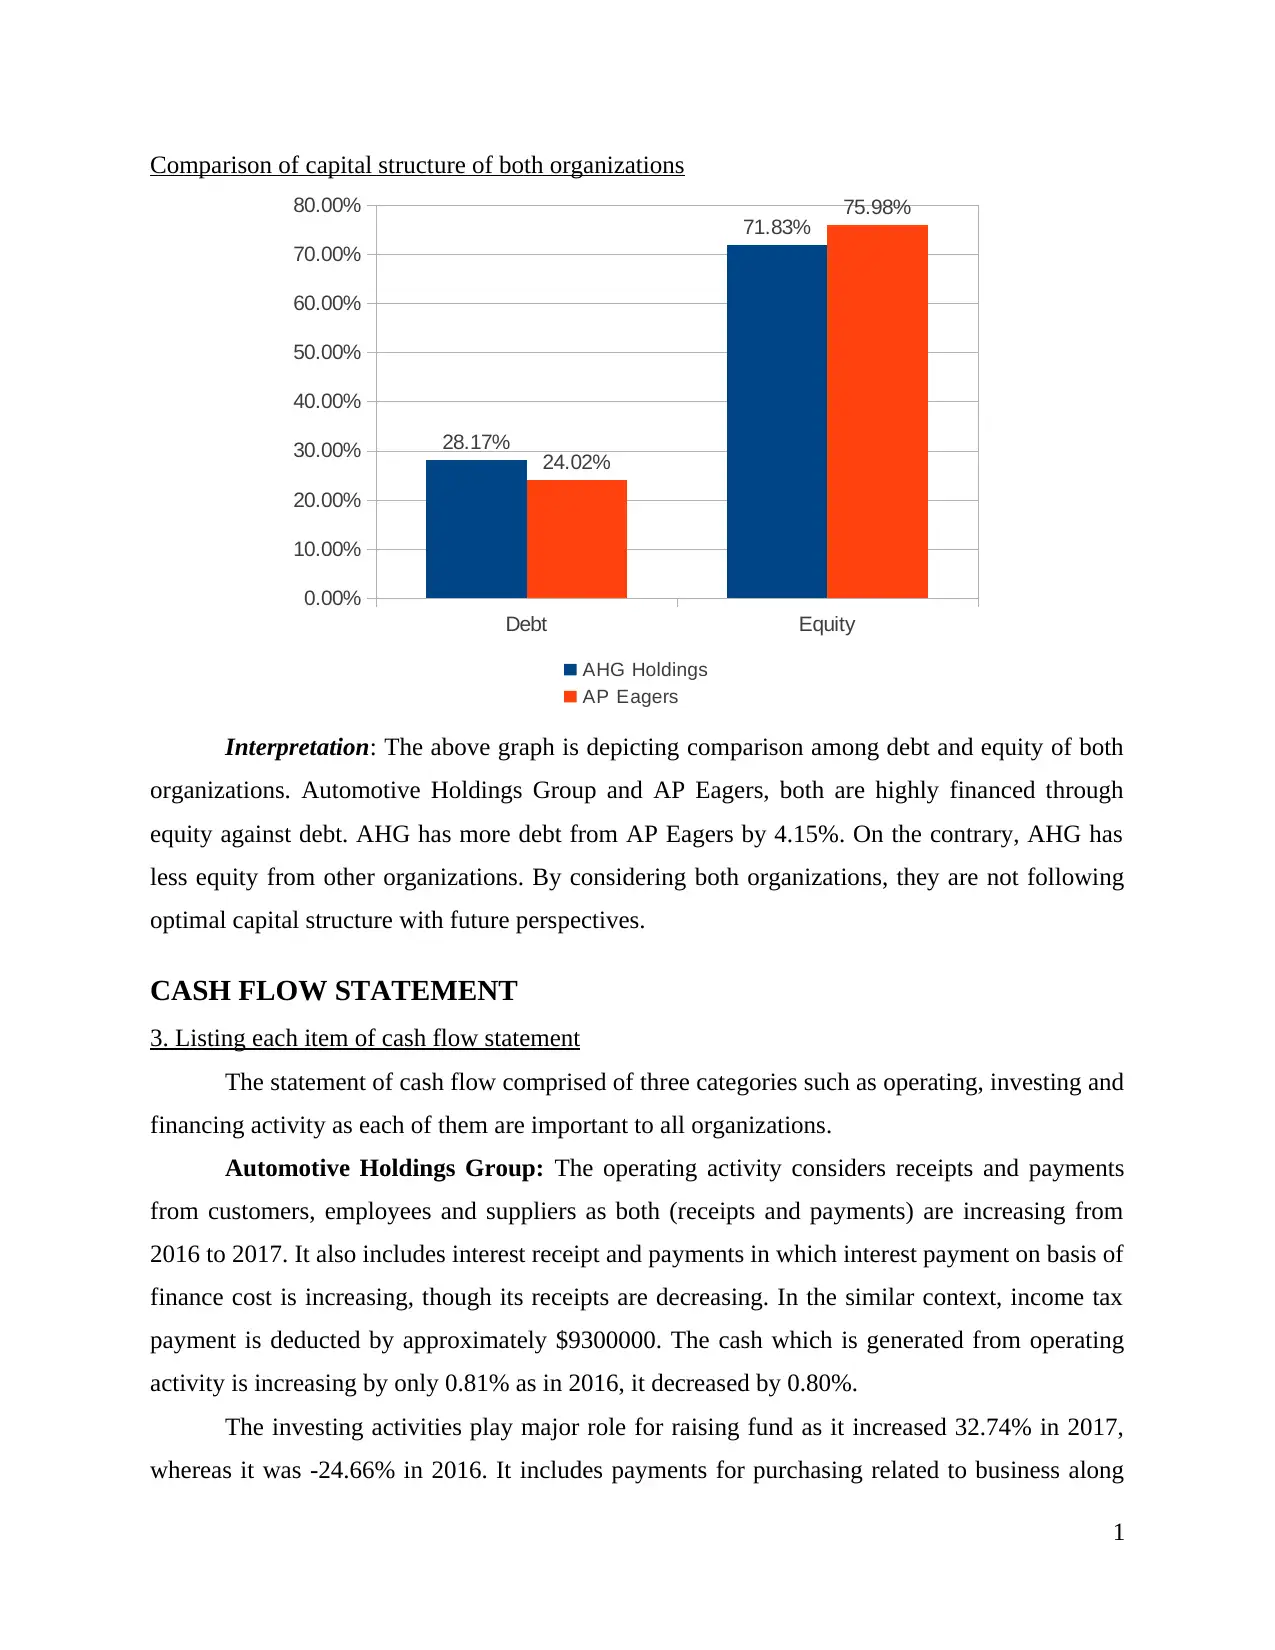
Comparison of capital structure of both organizations
Debt Equity
0.00%
10.00%
20.00%
30.00%
40.00%
50.00%
60.00%
70.00%
80.00%
28.17%
71.83%
24.02%
75.98%
AHG Holdings
AP Eagers
Interpretation: The above graph is depicting comparison among debt and equity of both
organizations. Automotive Holdings Group and AP Eagers, both are highly financed through
equity against debt. AHG has more debt from AP Eagers by 4.15%. On the contrary, AHG has
less equity from other organizations. By considering both organizations, they are not following
optimal capital structure with future perspectives.
CASH FLOW STATEMENT
3. Listing each item of cash flow statement
The statement of cash flow comprised of three categories such as operating, investing and
financing activity as each of them are important to all organizations.
Automotive Holdings Group: The operating activity considers receipts and payments
from customers, employees and suppliers as both (receipts and payments) are increasing from
2016 to 2017. It also includes interest receipt and payments in which interest payment on basis of
finance cost is increasing, though its receipts are decreasing. In the similar context, income tax
payment is deducted by approximately $9300000. The cash which is generated from operating
activity is increasing by only 0.81% as in 2016, it decreased by 0.80%.
The investing activities play major role for raising fund as it increased 32.74% in 2017,
whereas it was -24.66% in 2016. It includes payments for purchasing related to business along
1
with proceeds from sale with disposal of cash. These both payments and proceeds related to
business was decreased from 2016 to 2017.
In the similar context, property, plant and equipment payment is decreasing and
dividends distribution is raised. In the year 2017, they have ridden proceeds of sale of
investments and paid with context of purchasing investment (Annual report of Automotive
Holdings Group, 2016).
In the same series, it stated cash movements with context to financing activity in which
repayments of borrowings was done and proceeded from issuance of shares that had been
introduced in 2017. AHG has paid less dividends on the basis of non-controlling interest and
members were paid on high aspects as compared to the past year. By considering each financing
activity, it has extracted change of -262.09%.
AP Eagers: The receipts and payments from customers, employees and suppliers are
included in operating activities as it increased from 2016 to 2017. It has also considered an
insurance claim which was decreasing, but in less proportion.
In the similar aspect, it has stated receipt of interest along with payment of finance cost
where AP Eagers has received very less interest as compared to previous year but paid more
interest on basis of finance cost. Further, income tax payment and dividend received are also
stated in operating activities, which increased by 32.13% from 2016 to 2017.
In the series of second category of cash flow is related to investing activity on basis of
business entity. It consists of payment for business acquisition, property, plant and equipment as
well which are decreasing from previous year. This organization has huge decrement on
payments related to intangible assets but introduced proceeds from sale of business. It has raised
payments for shares in other business entities along with proceeds from selling financial assets.
The proceeds from selling plant, equipment and property is decreased by huge proportion from
2016 to 2017. Further, with aggregate of investing activity is decreased by more than 50% as
64.59%.
The activities of finance play important role in business entity but it was decreasing by
huge proportion from 2016 to 2017. It comprised issuing shares and various other securities
which got decreased with huge amount.
In the same series, it has included proceeds and repayment of borrowing in which
proceeds are decreasing but payment is increasing. AP Eagers had introduced transactions with
2
⊘ This is a preview!⊘
Do you want full access?
Subscribe today to unlock all pages.
Trusted by 1+ million students worldwide
non-controlling interest and paid dividends to its members and minority shareholder in increment
aspect (Annual report of AP Eagers, 2017).
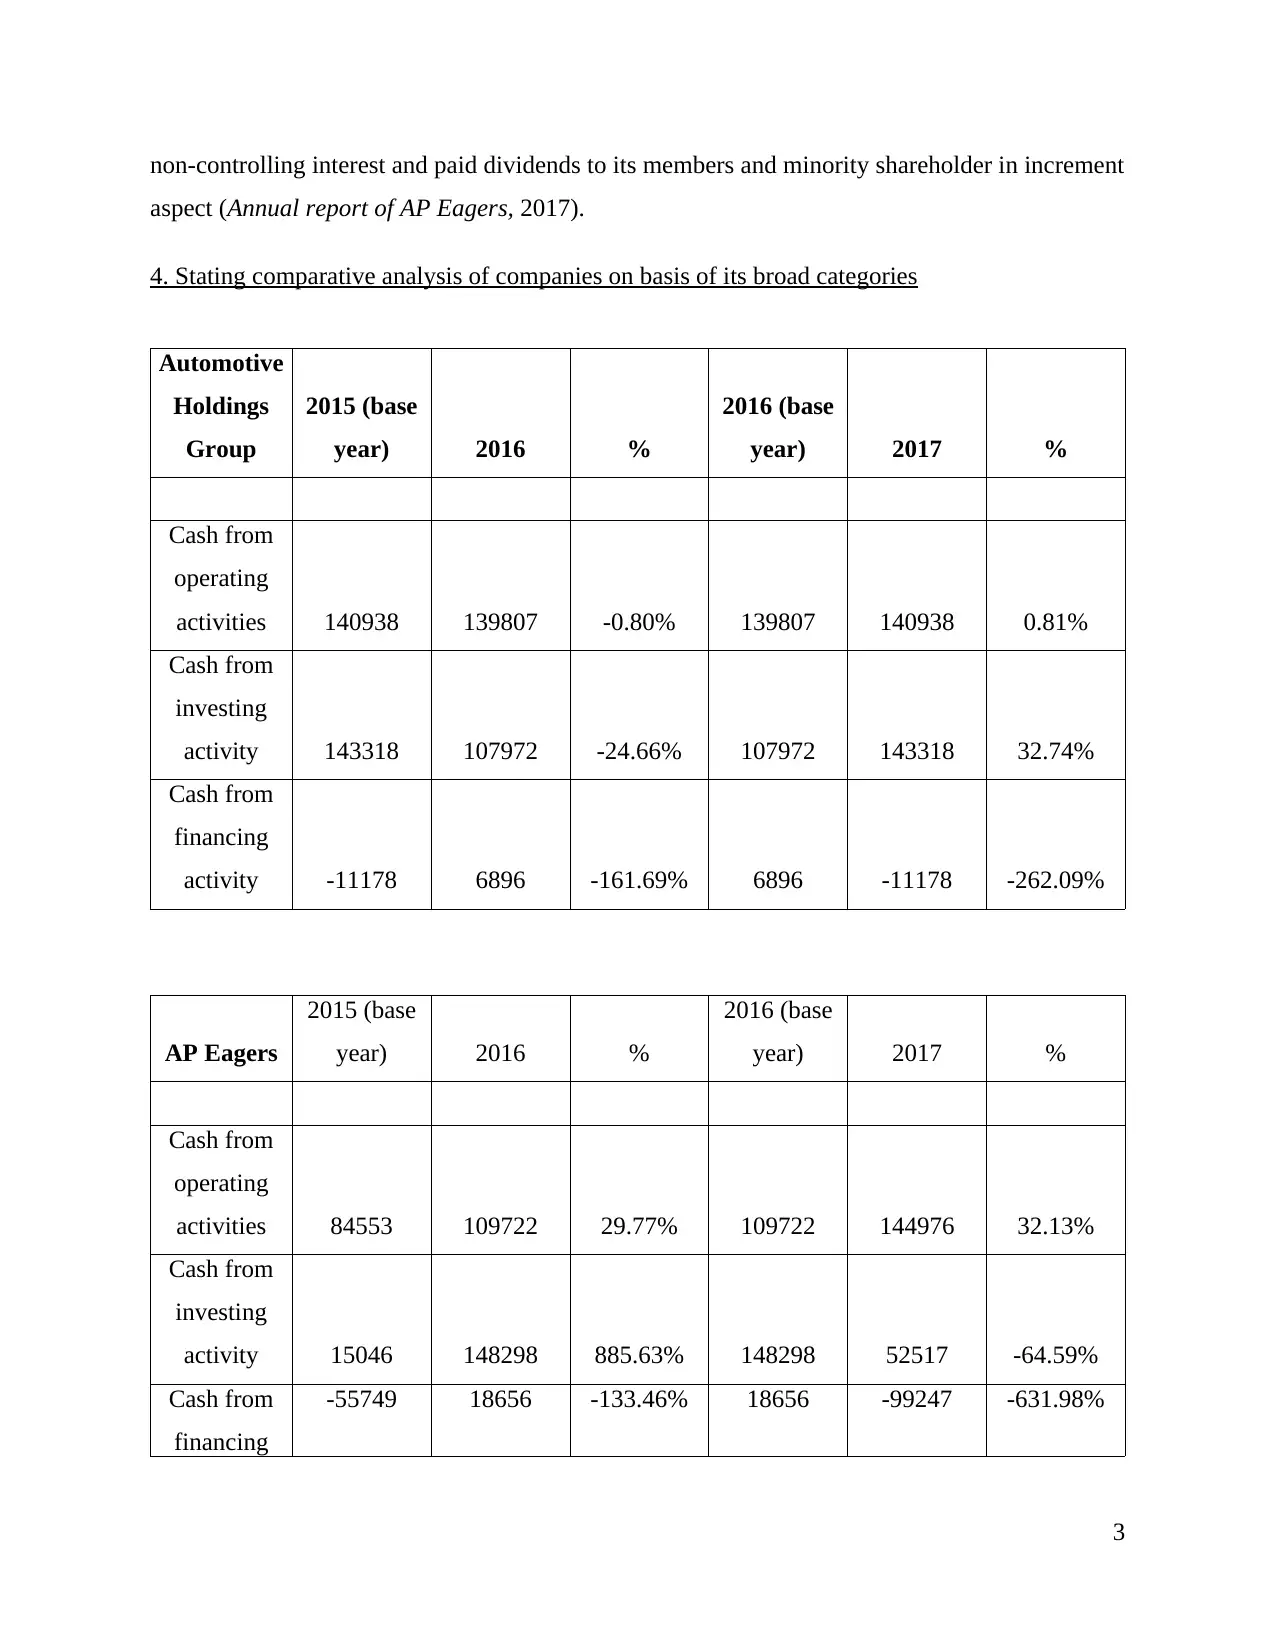
4. Stating comparative analysis of companies on basis of its broad categories
Automotive
Holdings
Group
2015 (base
year) 2016 %
2016 (base
year) 2017 %
Cash from
operating
activities 140938 139807 -0.80% 139807 140938 0.81%
Cash from
investing
activity 143318 107972 -24.66% 107972 143318 32.74%
Cash from
financing
activity -11178 6896 -161.69% 6896 -11178 -262.09%
AP Eagers
2015 (base
year) 2016 %
2016 (base
year) 2017 %
Cash from
operating
activities 84553 109722 29.77% 109722 144976 32.13%
Cash from
investing
activity 15046 148298 885.63% 148298 52517 -64.59%
Cash from
financing
-55749 18656 -133.46% 18656 -99247 -631.98%
3
aspect (Annual report of AP Eagers, 2017).
4. Stating comparative analysis of companies on basis of its broad categories
Automotive
Holdings
Group
2015 (base
year) 2016 %
2016 (base
year) 2017 %
Cash from
operating
activities 140938 139807 -0.80% 139807 140938 0.81%
Cash from
investing
activity 143318 107972 -24.66% 107972 143318 32.74%
Cash from
financing
activity -11178 6896 -161.69% 6896 -11178 -262.09%
AP Eagers
2015 (base
year) 2016 %
2016 (base
year) 2017 %
Cash from
operating
activities 84553 109722 29.77% 109722 144976 32.13%
Cash from
investing
activity 15046 148298 885.63% 148298 52517 -64.59%
Cash from
financing
-55749 18656 -133.46% 18656 -99247 -631.98%
3
Paraphrase This Document
Need a fresh take? Get an instant paraphrase of this document with our AI Paraphraser
activity
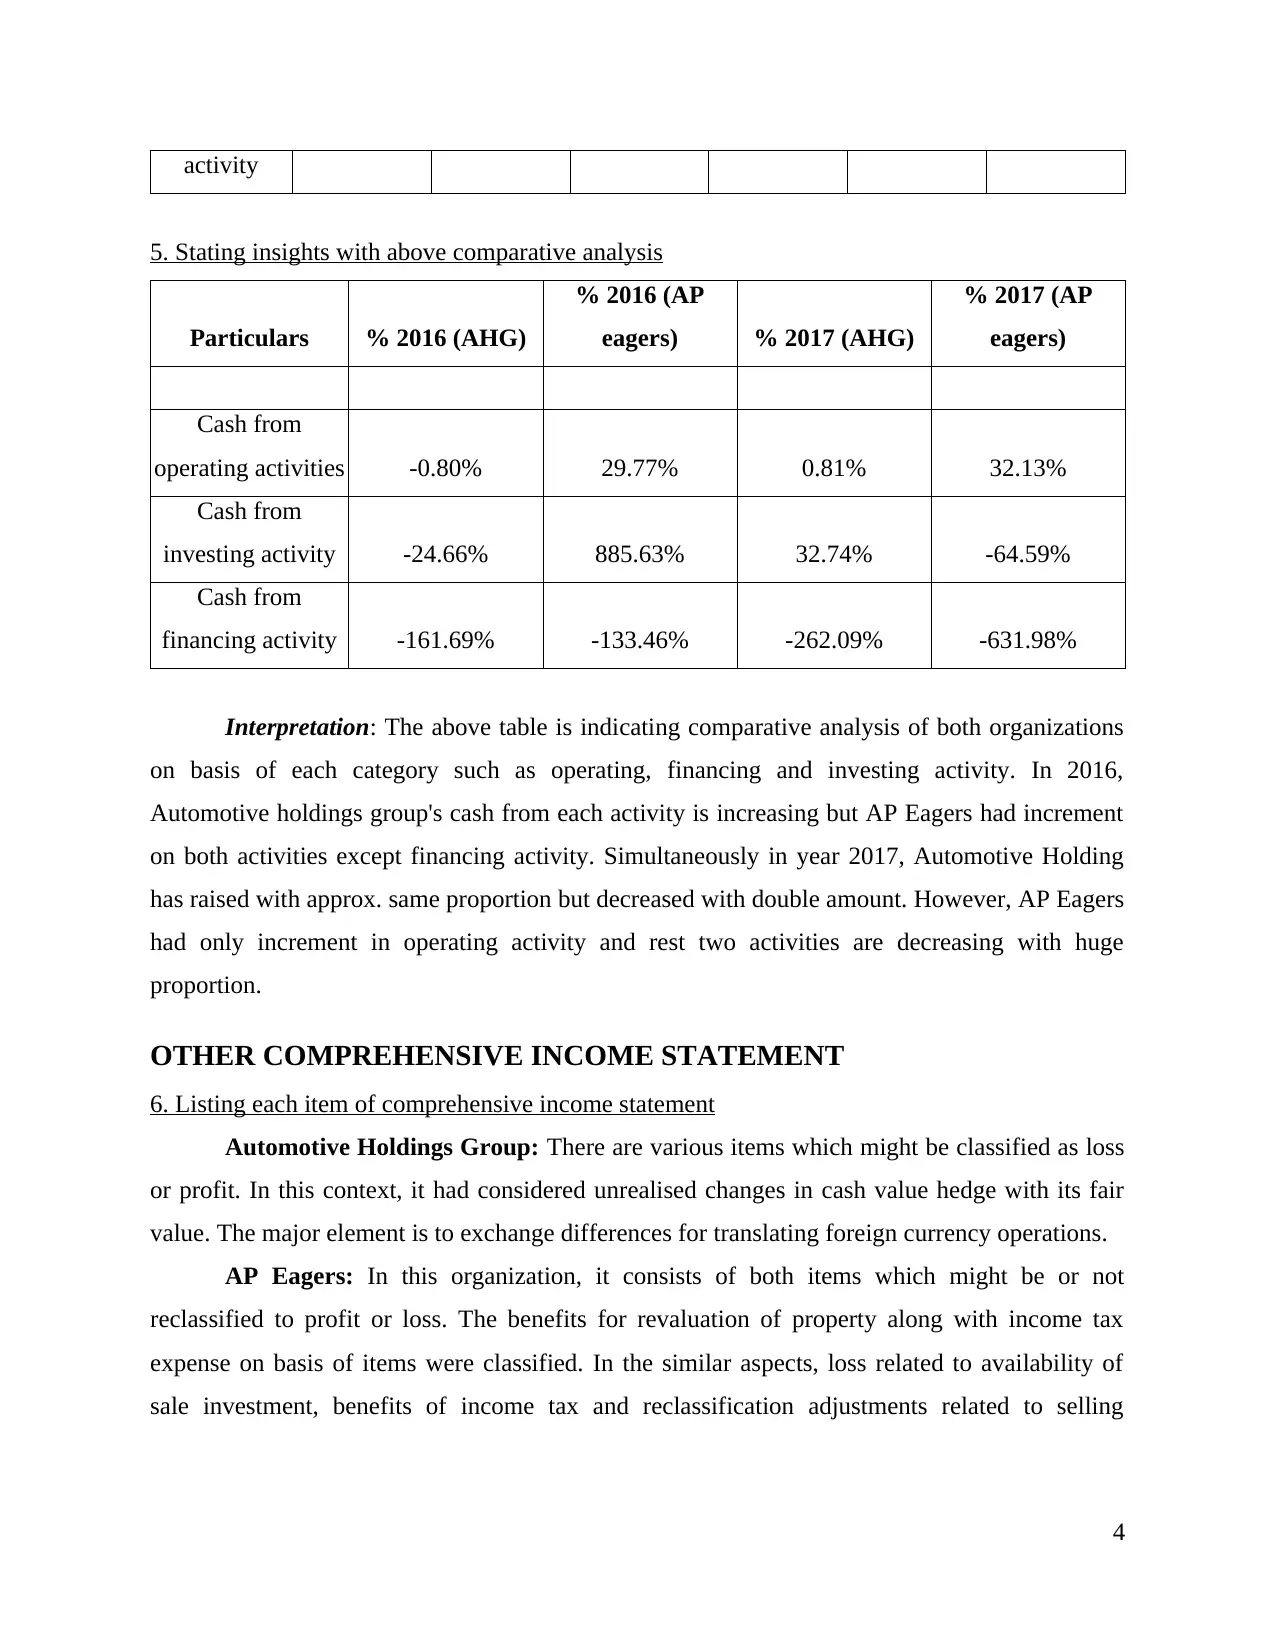
5. Stating insights with above comparative analysis
Particulars % 2016 (AHG)
% 2016 (AP
eagers) % 2017 (AHG)
% 2017 (AP
eagers)
Cash from
operating activities -0.80% 29.77% 0.81% 32.13%
Cash from
investing activity -24.66% 885.63% 32.74% -64.59%
Cash from
financing activity -161.69% -133.46% -262.09% -631.98%
Interpretation: The above table is indicating comparative analysis of both organizations
on basis of each category such as operating, financing and investing activity. In 2016,
Automotive holdings group's cash from each activity is increasing but AP Eagers had increment
on both activities except financing activity. Simultaneously in year 2017, Automotive Holding
has raised with approx. same proportion but decreased with double amount. However, AP Eagers
had only increment in operating activity and rest two activities are decreasing with huge
proportion.
OTHER COMPREHENSIVE INCOME STATEMENT
6. Listing each item of comprehensive income statement
Automotive Holdings Group: There are various items which might be classified as loss
or profit. In this context, it had considered unrealised changes in cash value hedge with its fair
value. The major element is to exchange differences for translating foreign currency operations.
AP Eagers: In this organization, it consists of both items which might be or not
reclassified to profit or loss. The benefits for revaluation of property along with income tax
expense on basis of items were classified. In the similar aspects, loss related to availability of
sale investment, benefits of income tax and reclassification adjustments related to selling
4
financial assets were disposed. The most important concern is of fair value gain which has arisen
from movement of cash flow hedge and its expense of income tax.
7. Stating reason for not including these items in income statement
OCI’s consists of various comprehensive items which are not included in the income
statement of balance sheet of a corporation. Moreover, it will be recorded in the comprehensive
income statement. The reason behind such variation is that it will not cause any changes in
organisational retained earnings. Moreover, it will cause changes in accumulated comprehensive
income which affected equity from investors. Along with this, there can be various examples
which are needed to be considered such as unrealized income from hedge instruments, foreign
currency gains as well as earnings from post retirement gain plans (Liu and et.al., 2017).
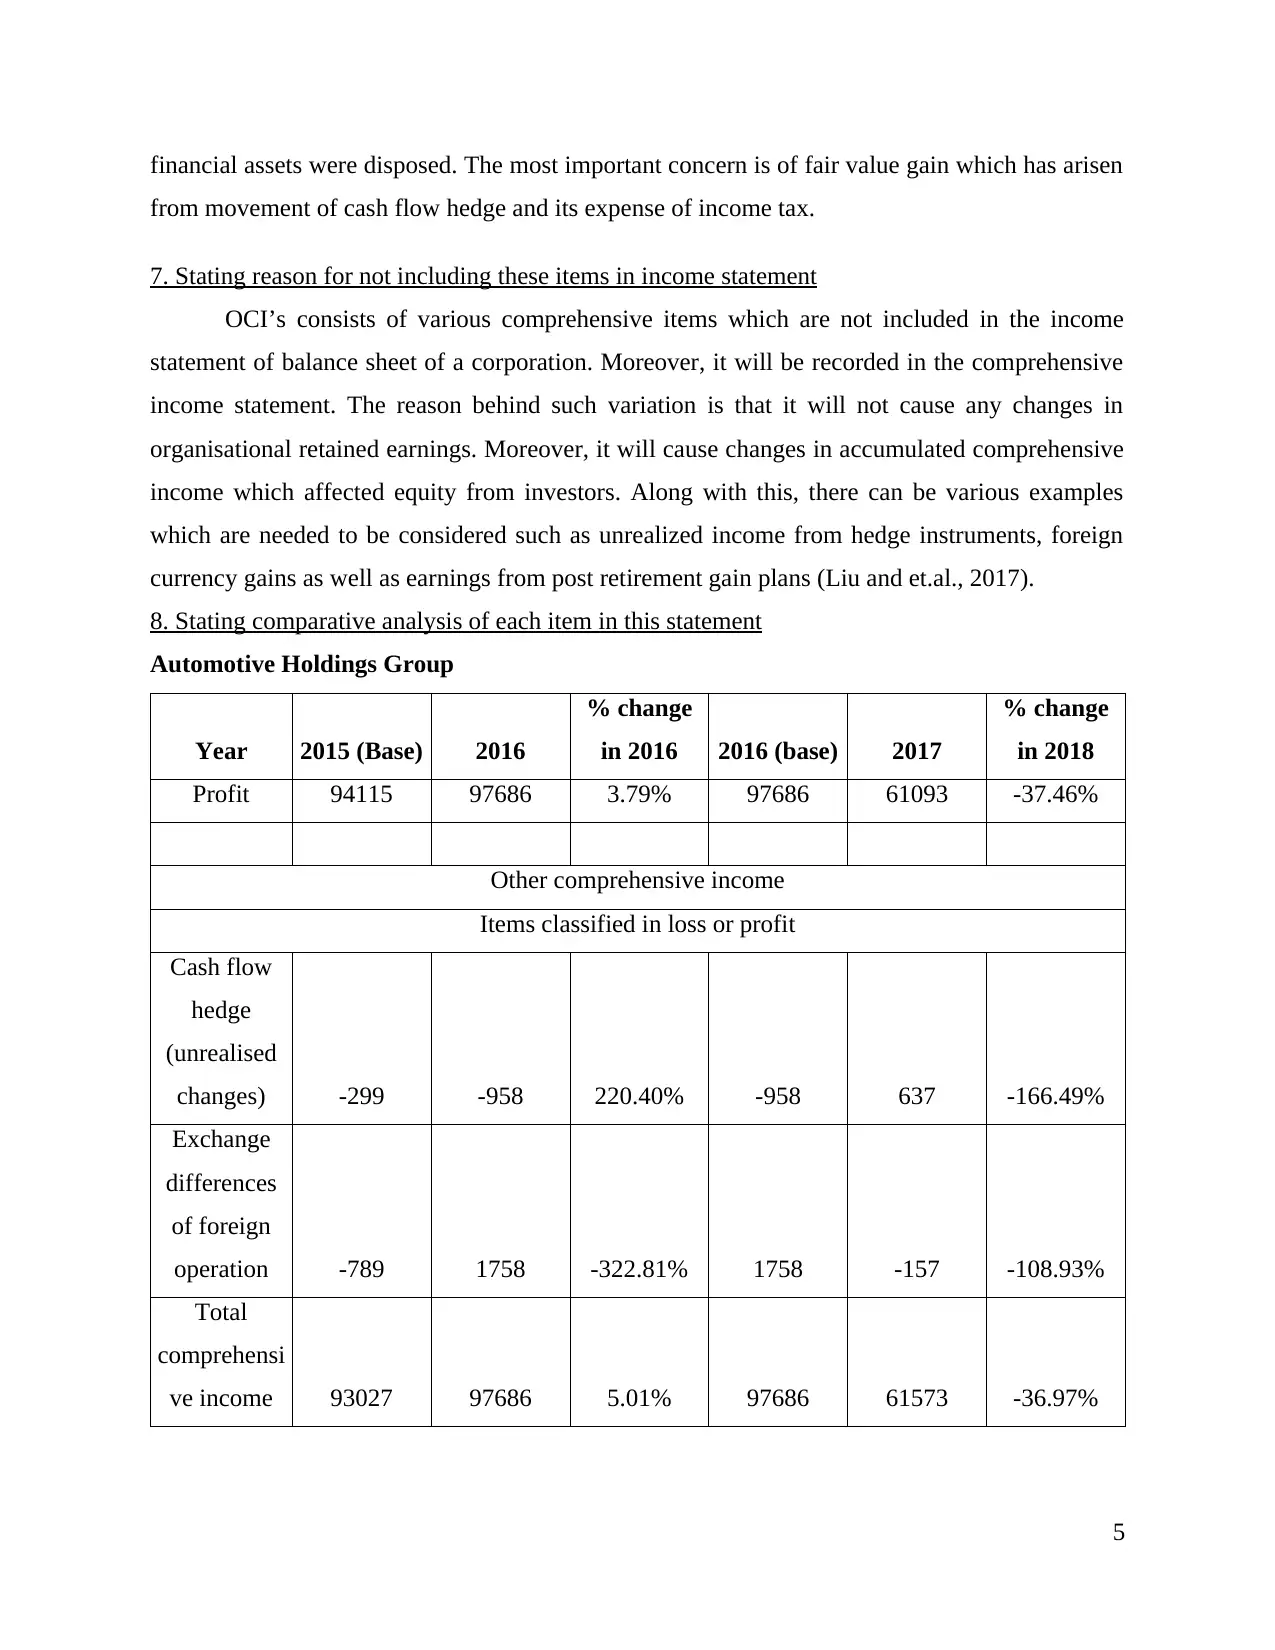
8. Stating comparative analysis of each item in this statement
Automotive Holdings Group
Year 2015 (Base) 2016
% change
in 2016 2016 (base) 2017
% change
in 2018
Profit 94115 97686 3.79% 97686 61093 -37.46%
Other comprehensive income
Items classified in loss or profit
Cash flow
hedge
(unrealised
changes) -299 -958 220.40% -958 637 -166.49%
Exchange
differences
of foreign
operation -789 1758 -322.81% 1758 -157 -108.93%
Total
comprehensi
ve income 93027 97686 5.01% 97686 61573 -36.97%
5
from movement of cash flow hedge and its expense of income tax.
7. Stating reason for not including these items in income statement
OCI’s consists of various comprehensive items which are not included in the income
statement of balance sheet of a corporation. Moreover, it will be recorded in the comprehensive
income statement. The reason behind such variation is that it will not cause any changes in
organisational retained earnings. Moreover, it will cause changes in accumulated comprehensive
income which affected equity from investors. Along with this, there can be various examples
which are needed to be considered such as unrealized income from hedge instruments, foreign
currency gains as well as earnings from post retirement gain plans (Liu and et.al., 2017).
8. Stating comparative analysis of each item in this statement
Automotive Holdings Group
Year 2015 (Base) 2016
% change
in 2016 2016 (base) 2017
% change
in 2018
Profit 94115 97686 3.79% 97686 61093 -37.46%
Other comprehensive income
Items classified in loss or profit
Cash flow
hedge
(unrealised
changes) -299 -958 220.40% -958 637 -166.49%
Exchange
differences
of foreign
operation -789 1758 -322.81% 1758 -157 -108.93%
Total
comprehensi
ve income 93027 97686 5.01% 97686 61573 -36.97%
5
⊘ This is a preview!⊘
Do you want full access?
Subscribe today to unlock all pages.
Trusted by 1+ million students worldwide
1 out of 18
Related Documents


Your All-in-One AI-Powered Toolkit for Academic Success.
+13062052269
info@desklib.com
Available 24*7 on WhatsApp / Email
![[object Object]](/_next/static/media/star-bottom.7253800d.svg)
Unlock your academic potential
Copyright © 2020–2026 A2Z Services. All Rights Reserved. Developed and managed by ZUCOL.