Corporate Accounting Report: Spark Infrastructure Financial Analysis
VerifiedAdded on 2021/05/31
|12
|2773
|20
Report
AI Summary
This report provides a detailed analysis of Spark Infrastructure's corporate accounting practices. It examines the changes in the cash flow statement over the past year, including operating, investing, and financing activities, highlighting the reasons for these changes. The report includes a comparative analysis of the three cash flow categories, providing insights into the company's financial performance. It also explores items within the other comprehensive income statement, explaining their nature and why they are not reported in the income statement. Furthermore, the report clarifies the firm's income tax expense, verifies its calculation, and discusses deferred tax liabilities and current tax assets. The analysis concludes with unique characteristics, new insights, and references to provide a comprehensive understanding of the company's financial reporting. The report offers valuable information for students studying accounting and finance, with detailed explanations and supporting data.
Running head: CORPORATE ACCOUNTING
Corporate Accounting
Name of the Student
Name of the University
Author Note
Corporate Accounting
Name of the Student
Name of the University
Author Note
Paraphrase This Document
Need a fresh take? Get an instant paraphrase of this document with our AI Paraphraser
1CORPORATE ACCOUNTING
Table of Contents
Changes in each item of cash flows statement for the firm over the past year along with the
reasons for the change................................................................................................................2
Comparative analysis of the company’s three broad categories of cash flows that is operating
activities, investing activities and financing activities:..............................................................4
Items of Other Comprehensive Income Statement....................................................................5
Insightful explanation of each item of Other Comprehensive Income Statement.....................5
Reasons for the items have not been reported in Income Statement/Profit and Loss Statement
....................................................................................................................................................6
Clear description of your firm’s income tax expense................................................................6
Verification of the figure of tax being same as the company tax rate times the firm’s
accounting income.....................................................................................................................6
Deferred tax that is reported in the balance sheet along with the reasons for the record...........7
Current tax assets or income tax payable recorded by the company.........................................7
Verification of the income tax expense shown in the income statement same as the income
tax paid shown in the cash flow statement.................................................................................7
Unique characteristics in the financial statements, new insights, and other information..........8
References..................................................................................................................................8
2CORPORATE ACCOUNTING
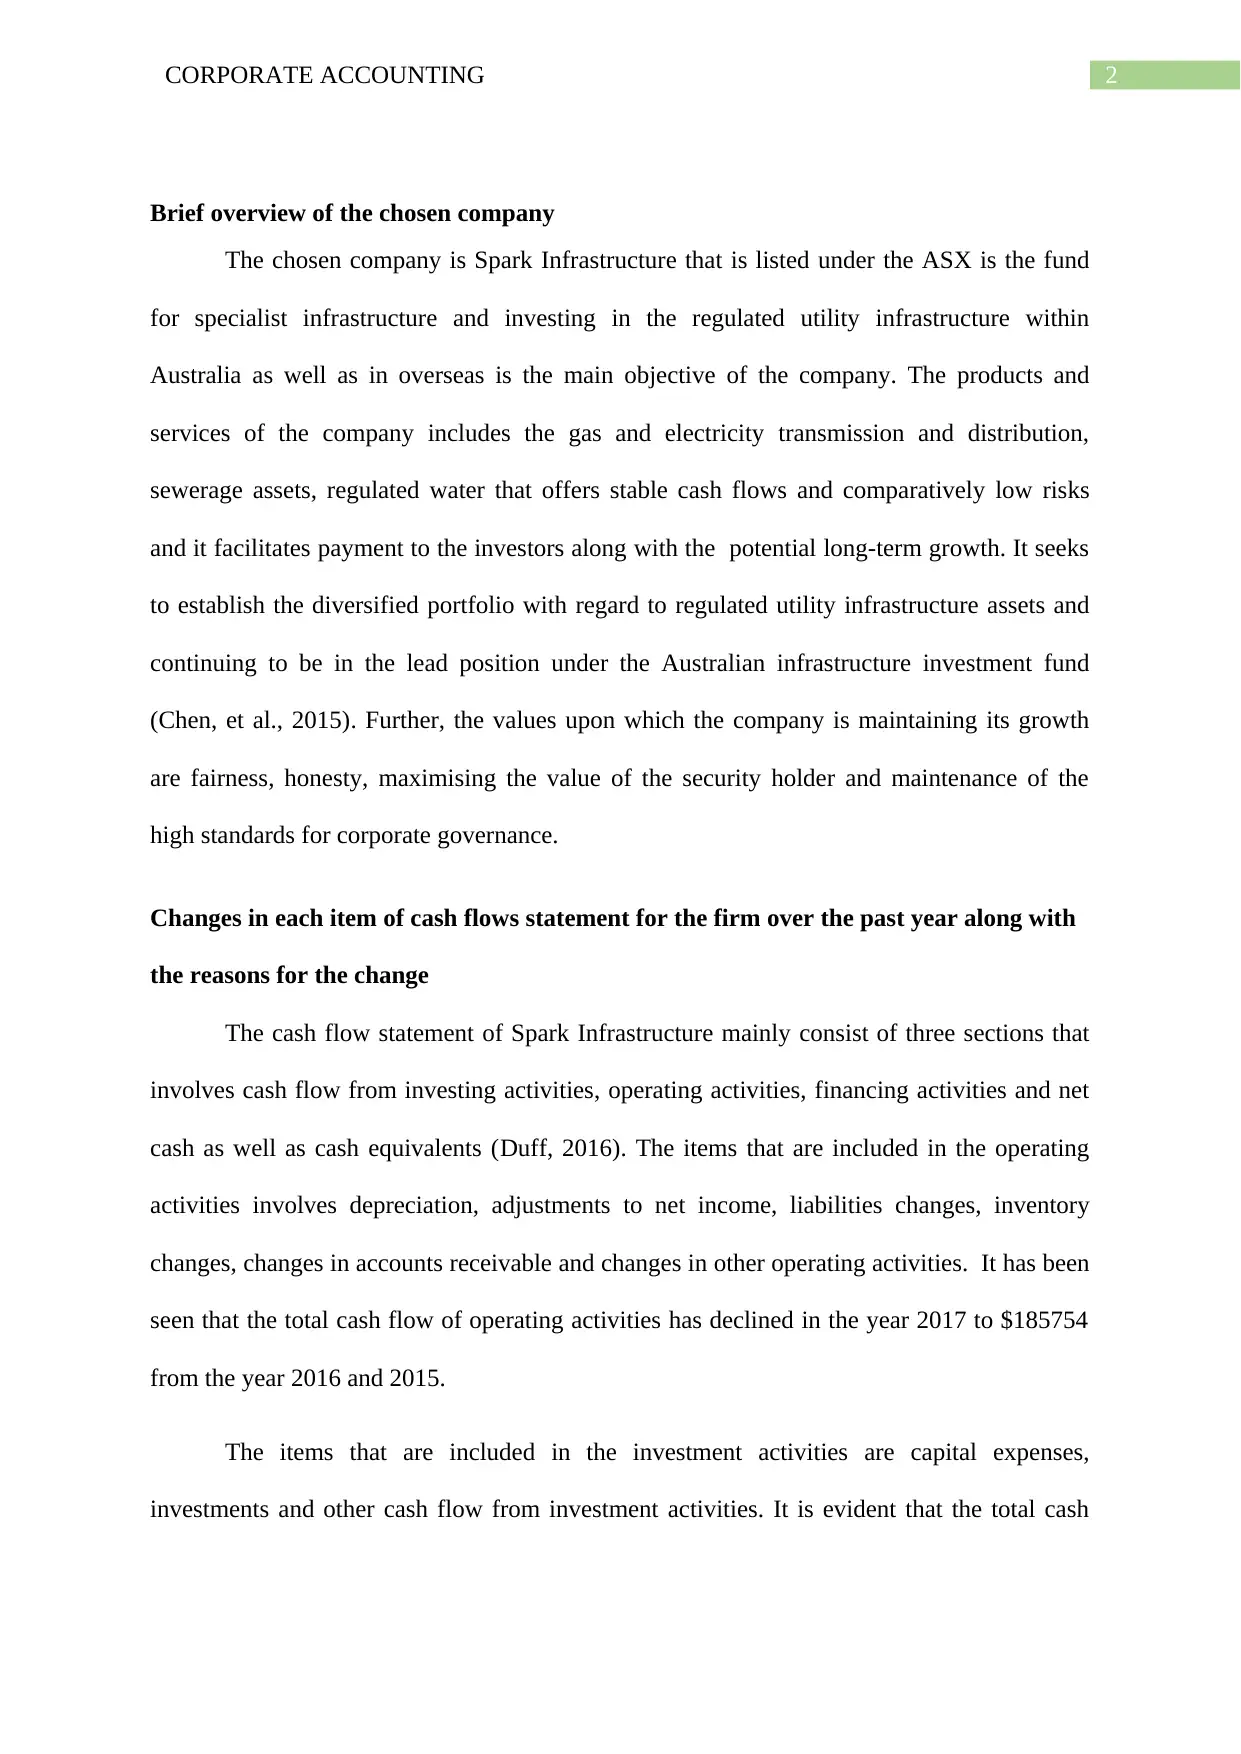
Brief overview of the chosen company
The chosen company is Spark Infrastructure that is listed under the ASX is the fund
for specialist infrastructure and investing in the regulated utility infrastructure within
Australia as well as in overseas is the main objective of the company. The products and
services of the company includes the gas and electricity transmission and distribution,
sewerage assets, regulated water that offers stable cash flows and comparatively low risks
and it facilitates payment to the investors along with the potential long-term growth. It seeks
to establish the diversified portfolio with regard to regulated utility infrastructure assets and
continuing to be in the lead position under the Australian infrastructure investment fund
(Chen, et al., 2015). Further, the values upon which the company is maintaining its growth
are fairness, honesty, maximising the value of the security holder and maintenance of the
high standards for corporate governance.
Changes in each item of cash flows statement for the firm over the past year along with
the reasons for the change
The cash flow statement of Spark Infrastructure mainly consist of three sections that
involves cash flow from investing activities, operating activities, financing activities and net
cash as well as cash equivalents (Duff, 2016). The items that are included in the operating
activities involves depreciation, adjustments to net income, liabilities changes, inventory
changes, changes in accounts receivable and changes in other operating activities. It has been
seen that the total cash flow of operating activities has declined in the year 2017 to $185754
from the year 2016 and 2015.
The items that are included in the investment activities are capital expenses,
investments and other cash flow from investment activities. It is evident that the total cash
⊘ This is a preview!⊘
Do you want full access?
Subscribe today to unlock all pages.
Trusted by 1+ million students worldwide
3CORPORATE ACCOUNTING
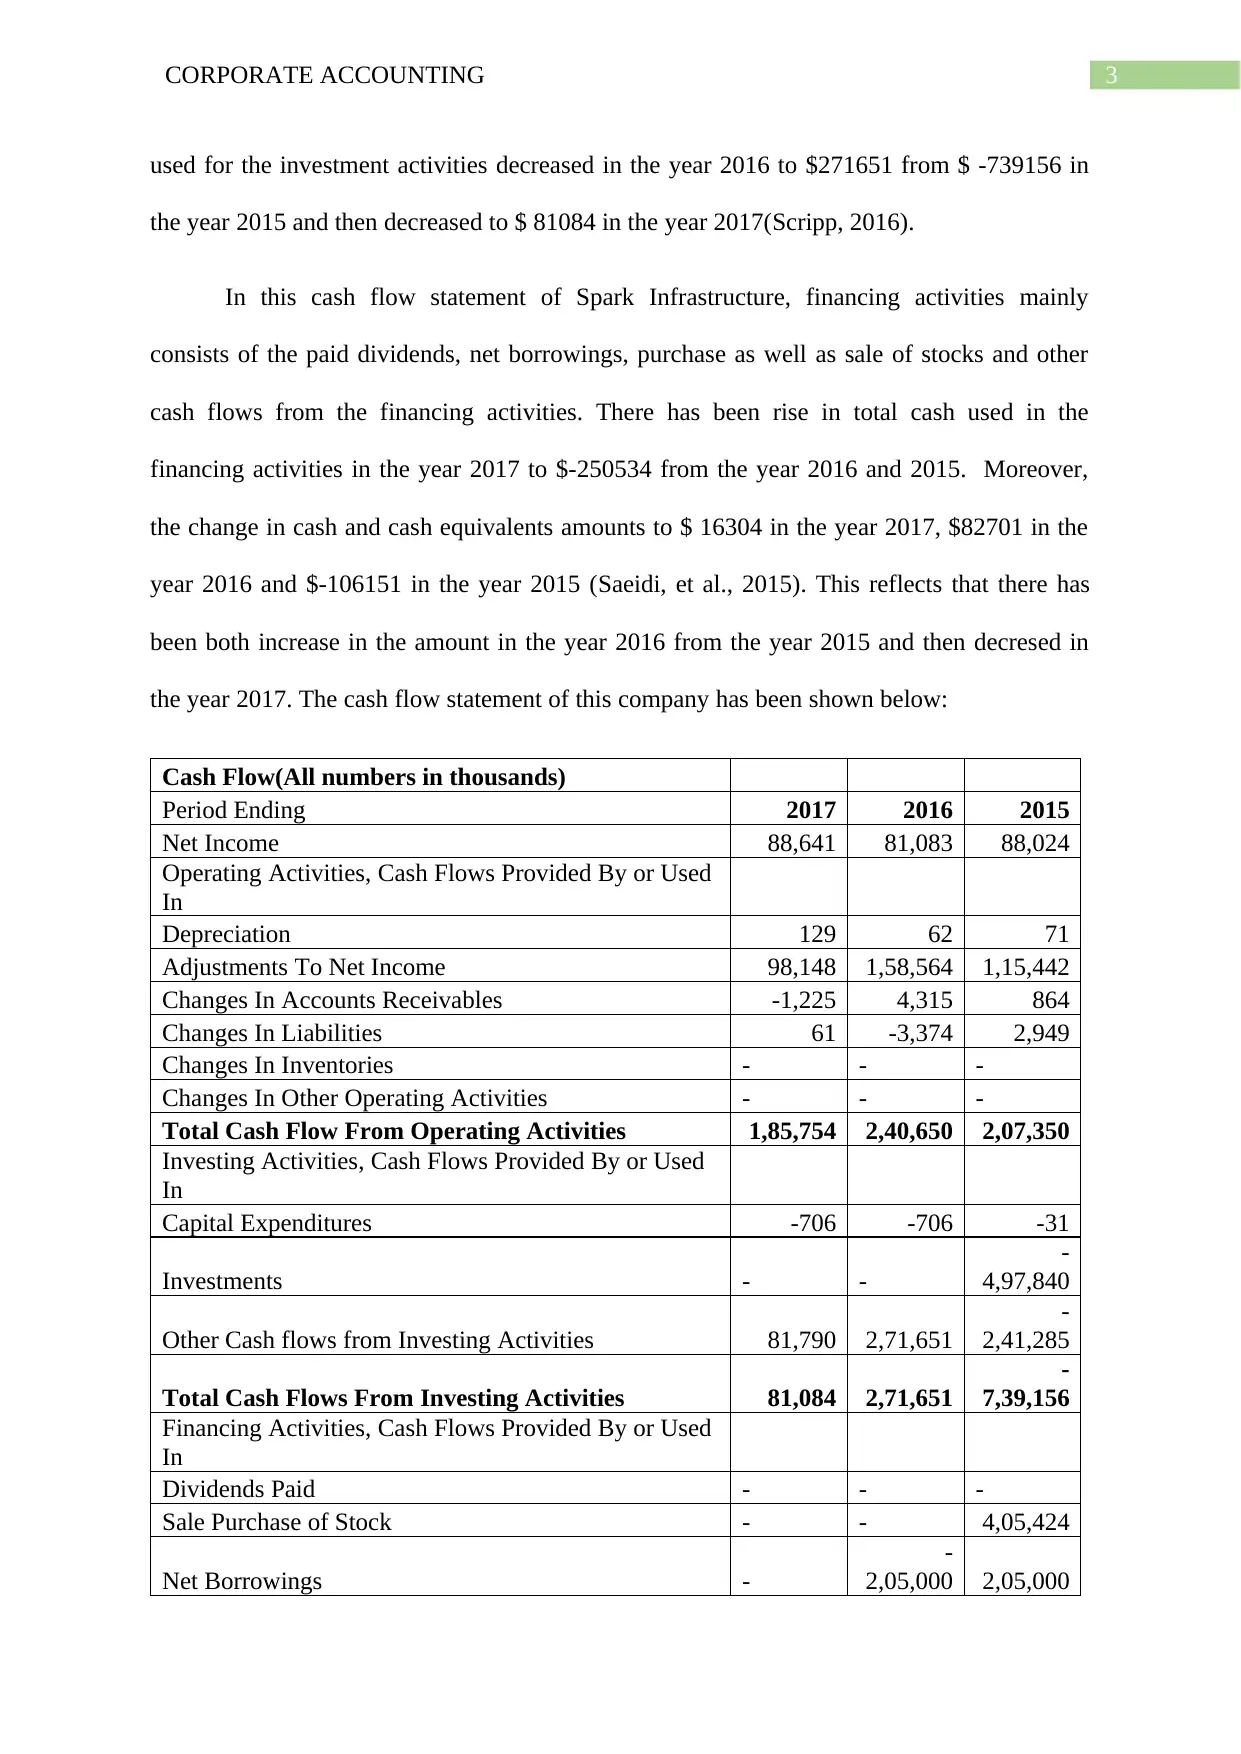
used for the investment activities decreased in the year 2016 to $271651 from $ -739156 in
the year 2015 and then decreased to $ 81084 in the year 2017(Scripp, 2016).
In this cash flow statement of Spark Infrastructure, financing activities mainly
consists of the paid dividends, net borrowings, purchase as well as sale of stocks and other
cash flows from the financing activities. There has been rise in total cash used in the
financing activities in the year 2017 to $-250534 from the year 2016 and 2015. Moreover,
the change in cash and cash equivalents amounts to $ 16304 in the year 2017, $82701 in the
year 2016 and $-106151 in the year 2015 (Saeidi, et al., 2015). This reflects that there has
been both increase in the amount in the year 2016 from the year 2015 and then decresed in
the year 2017. The cash flow statement of this company has been shown below:
Cash Flow(All numbers in thousands)
Period Ending 2017 2016 2015
Net Income 88,641 81,083 88,024
Operating Activities, Cash Flows Provided By or Used
In
Depreciation 129 62 71
Adjustments To Net Income 98,148 1,58,564 1,15,442
Changes In Accounts Receivables -1,225 4,315 864
Changes In Liabilities 61 -3,374 2,949
Changes In Inventories - - -
Changes In Other Operating Activities - - -
Total Cash Flow From Operating Activities 1,85,754 2,40,650 2,07,350
Investing Activities, Cash Flows Provided By or Used
In
Capital Expenditures -706 -706 -31
Investments - -
-
4,97,840
Other Cash flows from Investing Activities 81,790 2,71,651
-
2,41,285
Total Cash Flows From Investing Activities 81,084 2,71,651
-
7,39,156
Financing Activities, Cash Flows Provided By or Used
In
Dividends Paid - - -
Sale Purchase of Stock - - 4,05,424
Net Borrowings -
-
2,05,000 2,05,000
Paraphrase This Document
Need a fresh take? Get an instant paraphrase of this document with our AI Paraphraser
4CORPORATE ACCOUNTING
Other Cash Flows from Financing Activities
-
1,18,917
-
1,20,315
-
1,15,850
Total Cash Flows From Financing Activities
-
2,50,534
-
4,29,600 4,25,655
Effect Of Exchange Rate Changes - - -
Change In Cash and Cash Equivalents 16,304 82,701
-
1,06,151
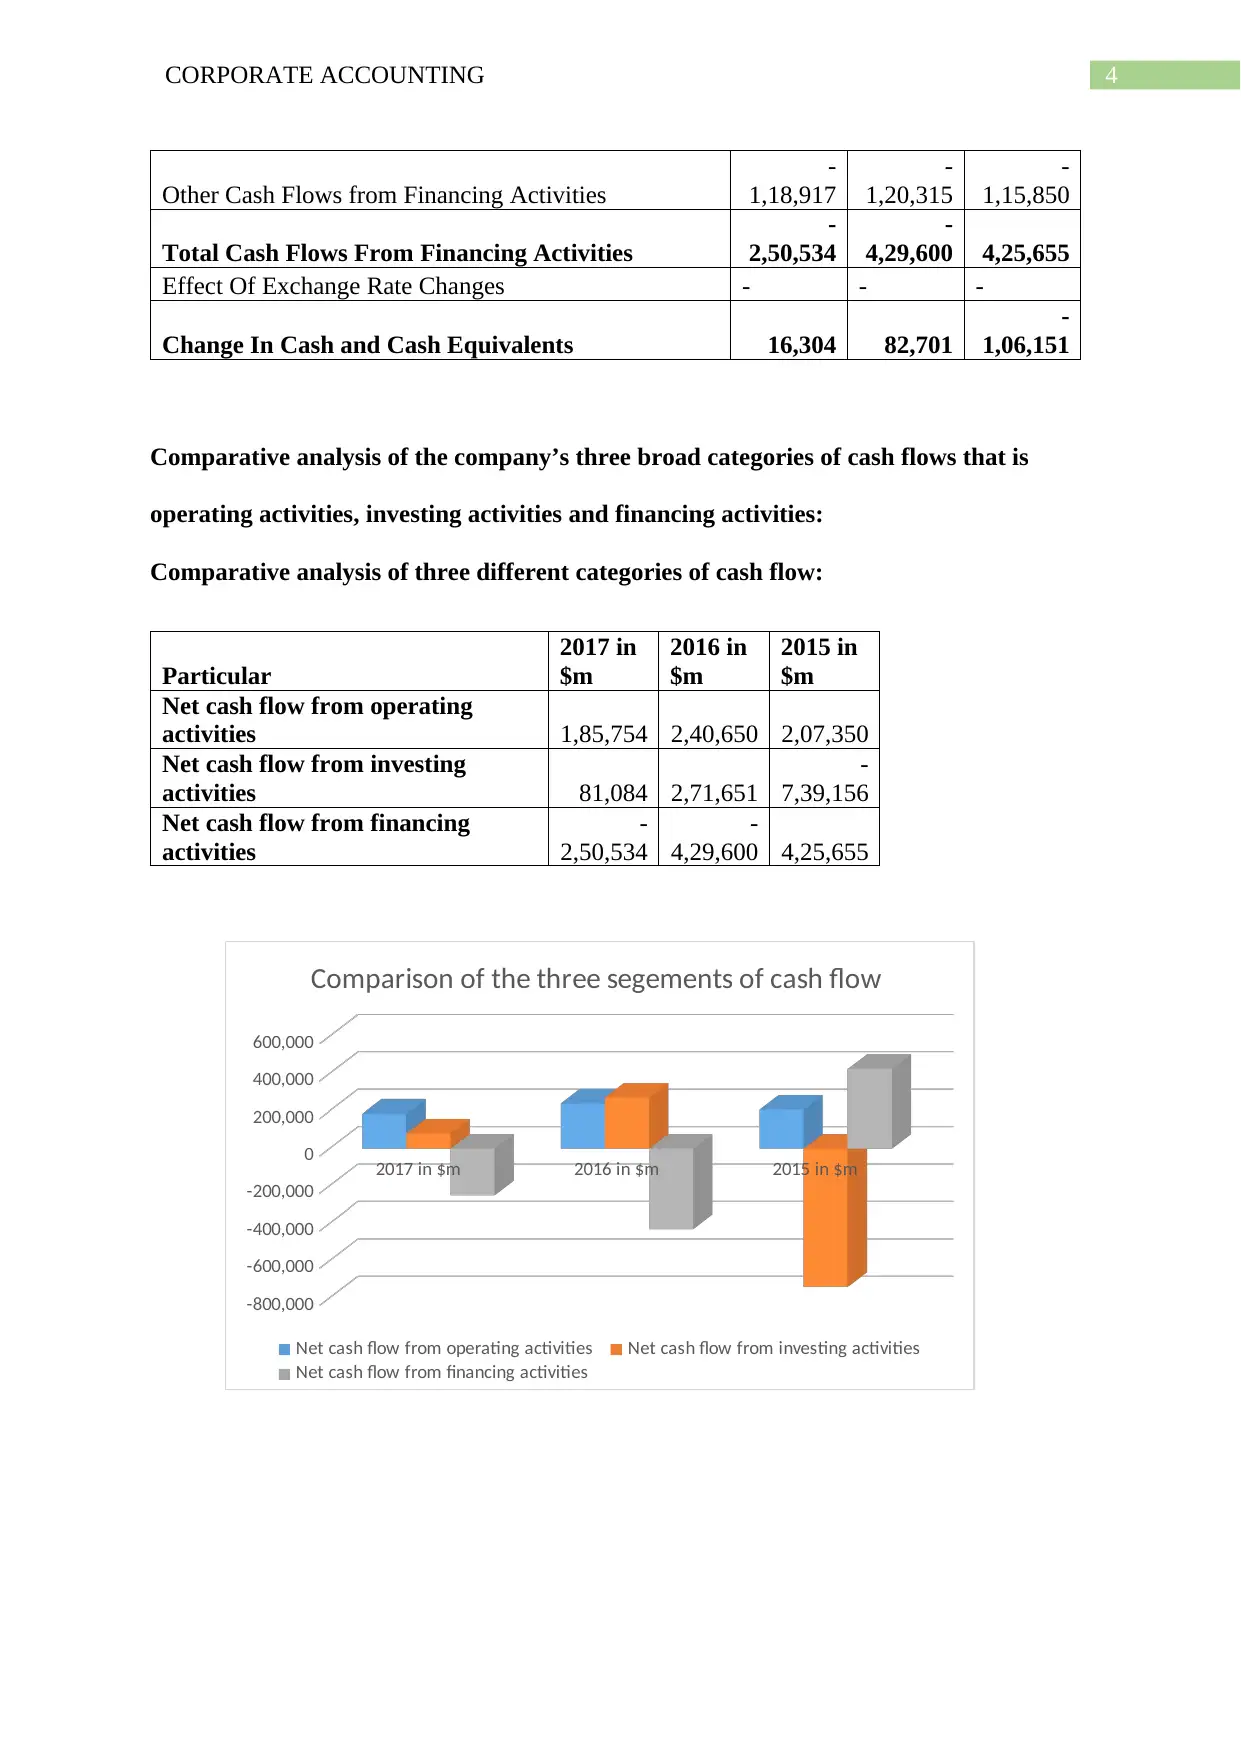
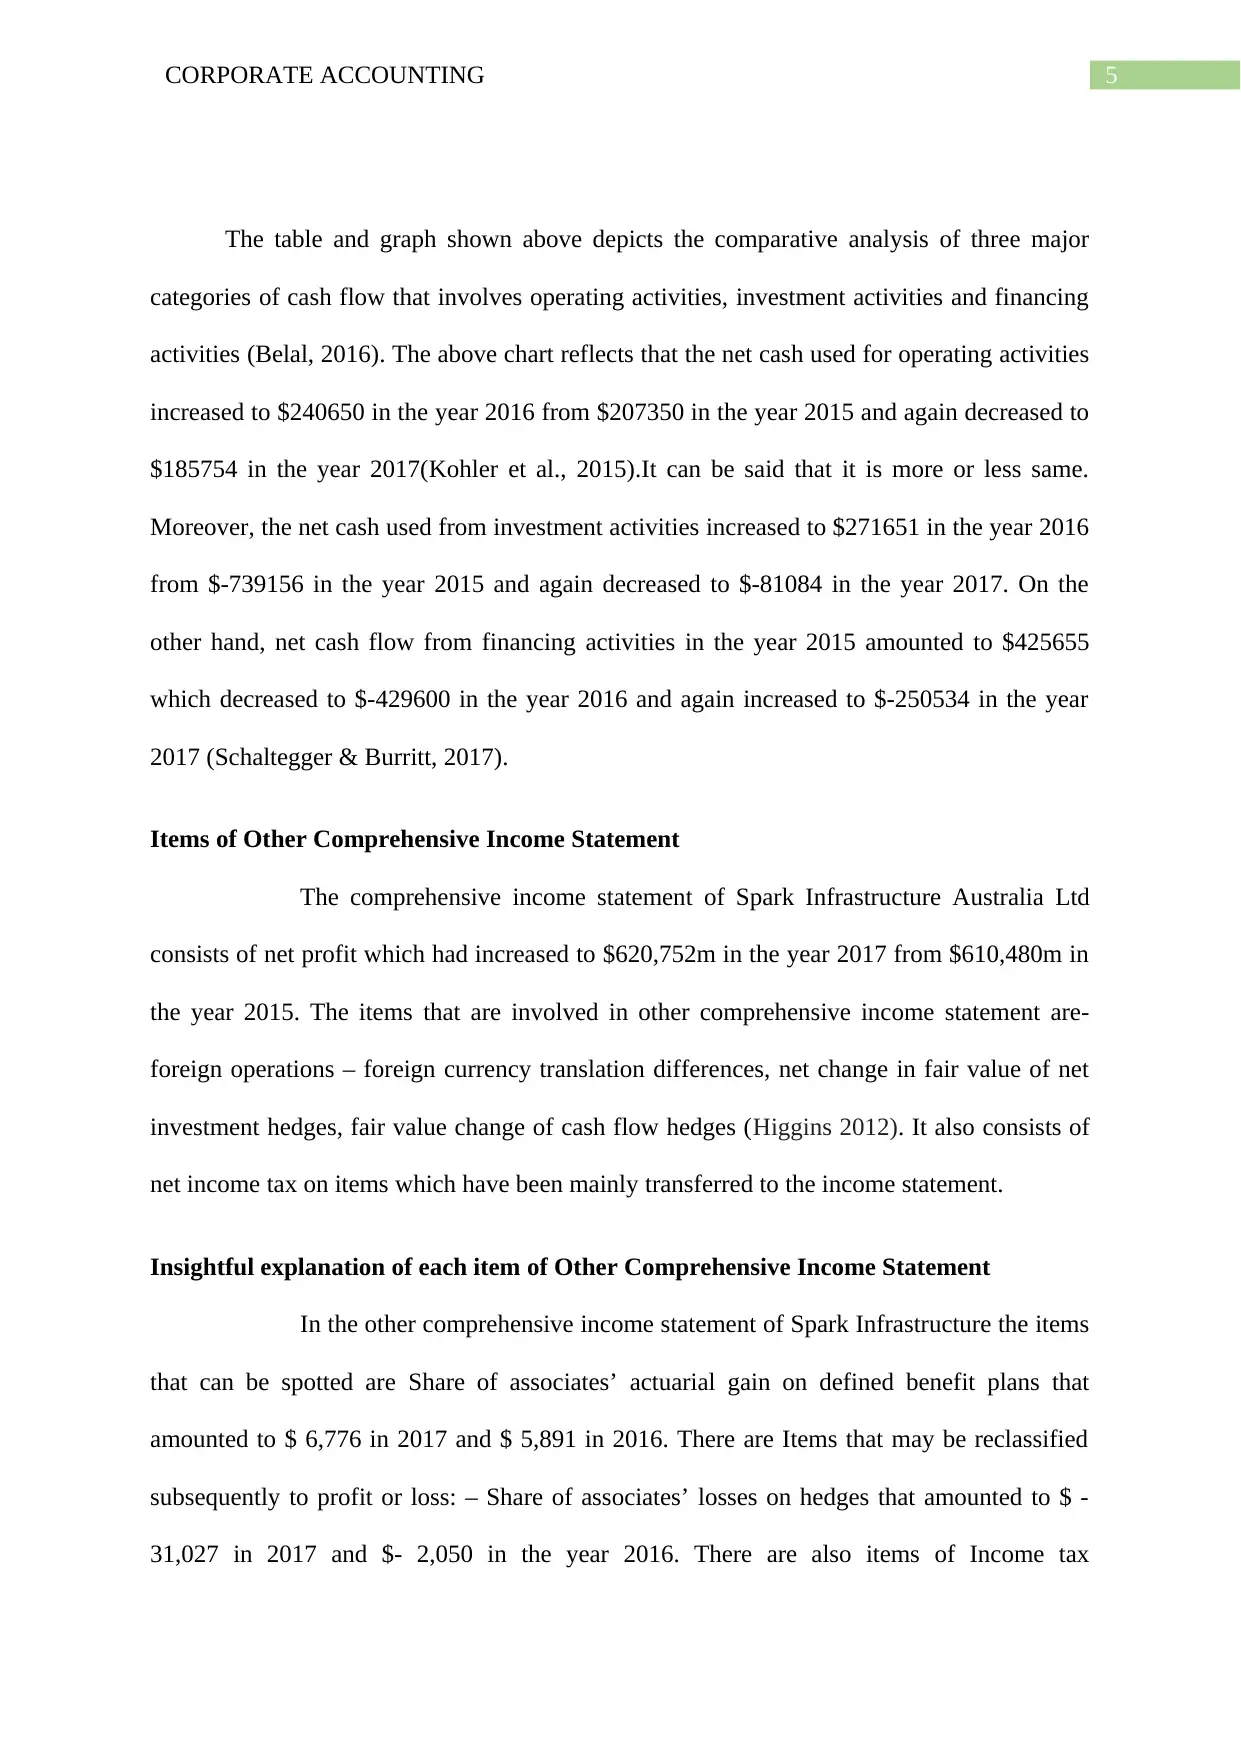
Comparative analysis of the company’s three broad categories of cash flows that is
operating activities, investing activities and financing activities:
Comparative analysis of three different categories of cash flow:
Particular
2017 in
$m
2016 in
$m
2015 in
$m
Net cash flow from operating
activities 1,85,754 2,40,650 2,07,350
Net cash flow from investing
activities 81,084 2,71,651
-
7,39,156
Net cash flow from financing
activities
-
2,50,534
-
4,29,600 4,25,655
2017 in $m 2016 in $m 2015 in $m
-800,000
-600,000
-400,000
-200,000
0
200,000
400,000
600,000
Comparison of the three segements of cash flow
Net cash flow from operating activities Net cash flow from investing activities
Net cash flow from financing activities
Other Cash Flows from Financing Activities
-
1,18,917
-
1,20,315
-
1,15,850
Total Cash Flows From Financing Activities
-
2,50,534
-
4,29,600 4,25,655
Effect Of Exchange Rate Changes - - -
Change In Cash and Cash Equivalents 16,304 82,701
-
1,06,151
Comparative analysis of the company’s three broad categories of cash flows that is
operating activities, investing activities and financing activities:
Comparative analysis of three different categories of cash flow:
Particular
2017 in
$m
2016 in
$m
2015 in
$m
Net cash flow from operating
activities 1,85,754 2,40,650 2,07,350
Net cash flow from investing
activities 81,084 2,71,651
-
7,39,156
Net cash flow from financing
activities
-
2,50,534
-
4,29,600 4,25,655
2017 in $m 2016 in $m 2015 in $m
-800,000
-600,000
-400,000
-200,000
0
200,000
400,000
600,000
Comparison of the three segements of cash flow
Net cash flow from operating activities Net cash flow from investing activities
Net cash flow from financing activities
5CORPORATE ACCOUNTING
The table and graph shown above depicts the comparative analysis of three major
categories of cash flow that involves operating activities, investment activities and financing
activities (Belal, 2016). The above chart reflects that the net cash used for operating activities
increased to $240650 in the year 2016 from $207350 in the year 2015 and again decreased to
$185754 in the year 2017(Kohler et al., 2015).It can be said that it is more or less same.
Moreover, the net cash used from investment activities increased to $271651 in the year 2016
from $-739156 in the year 2015 and again decreased to $-81084 in the year 2017. On the
other hand, net cash flow from financing activities in the year 2015 amounted to $425655
which decreased to $-429600 in the year 2016 and again increased to $-250534 in the year
2017 (Schaltegger & Burritt, 2017).
Items of Other Comprehensive Income Statement
The comprehensive income statement of Spark Infrastructure Australia Ltd
consists of net profit which had increased to $620,752m in the year 2017 from $610,480m in
the year 2015. The items that are involved in other comprehensive income statement are-
foreign operations – foreign currency translation differences, net change in fair value of net
investment hedges, fair value change of cash flow hedges (Higgins 2012). It also consists of
net income tax on items which have been mainly transferred to the income statement.
Insightful explanation of each item of Other Comprehensive Income Statement
In the other comprehensive income statement of Spark Infrastructure the items
that can be spotted are Share of associates’ actuarial gain on defined benefit plans that
amounted to $ 6,776 in 2017 and $ 5,891 in 2016. There are Items that may be reclassified
subsequently to profit or loss: – Share of associates’ losses on hedges that amounted to $ -
31,027 in 2017 and $- 2,050 in the year 2016. There are also items of Income tax
⊘ This is a preview!⊘
Do you want full access?
Subscribe today to unlock all pages.
Trusted by 1+ million students worldwide
6CORPORATE ACCOUNTING
benefit/(expense) related to components of other comprehensive income that amounted to $
6,020in 2017 and -$700 in 2016. It can be said overall analysing the other comprehensive
income statement that there has been a decrease og the amount from $ 3,141 in 2016 to $-
8,231 in 2017.
Reasons for the items have not been reported in Income Statement/Profit and Loss
Statement
According to Jagannath and Koller (2013) that, comprehensive income statement is
mainly used for measurement of change in owner’s interest in the business. It generally
incorporates income as well as expenditure which have not yet realized and is utilized for
bypassing income statement. In addition to this, other comprehensive income mainly
considers items that involve debt security on the unrealized profits and losses, changes in
transactions of foreign currency, profit or loss obtained from the derivative instruments and
any other pension profits or losses (Ryerson, et al., 2016).
Clear description of your firm’s income tax expense
The income tax expenditure declined to -$58,581m in the year 2017 from -$26,151m
in the year 2016 as given in the company’s income statement. This tax was mainly calculated
by dividing income tax expenditure to profit before income tax expenses from continued as
well as discontinued operations (Mowry et al., 2015).
Verification of the figure of tax being same as the company tax rate times the firm’s
accounting income
The amount of income tax has been computed by using tax rates, which have been
mainly ratified significantly from the statement of companies financial. The present income
tax expenditure amounted to around -$26,151m in the year 2016 and -$58,581m in the year
2017 as given in the financial statement. This shows that the income tax amount had
Paraphrase This Document
Need a fresh take? Get an instant paraphrase of this document with our AI Paraphraser
7CORPORATE ACCOUNTING
decreased considerably in the year 2017. However, it cannot be estimated that whether the
income tax expenditures figures are same as that of tax rate times this company’s accounting
income.
Deferred tax that is reported in the balance sheet along with the reasons for the record
The Deferred tax is accounted by the method of balance sheet asset resulting from
temporary differences between the tax bases of liabilities and assets and their carrying
amount in the financial statements (Chen, et al., 2014). Recognition of deferred tax liabilities
are done to the extent that the availability of taxable profit in future is probable against the
temporary differences that are deductible. In current year, there has been deferred tax
liabilities are $313,739 in 2017 and $261,167 in 2016.
Current tax assets or income tax payable recorded by the company
In Spark Infrastructure the income tax expenditure declined to 4,263m in the year
2017 from -$ 241m in the year 2016. The Income tax expenses is the amount that is
calculated based on the standard accounting rules and on the amount of tax that is owed by
company to tax authorities. Income tax payable is the amount that the company owes in terms
of tax based on tax code rules (Beekes, Brown & Zhang, 2015). Until the company makes the
payment of tax, the amount of income tax payable appears on the balance sheet section as
liability.
Verification of the income tax expense shown in the income statement same as the
income tax paid shown in the cash flow statement
The income tax expense shown in the income statement is not same as the income tax
paid shown in the cash flow statement that as there is no tax expenses pointed out in the cash
flow statement. However, income left after meeting all these expenses are taxed at the rate of
8CORPORATE ACCOUNTING
30% as per the Australian tax code that amounted to -$58,581m in the year 2017 from -
$26,151m in the year 2016.
Unique characteristics in the financial statements, new insights, and other information
From the Spark Infrastructure Australian Ltd annual report, it can be recognized that
the total amount for income tax has been basically made based on the adjusted profits which
are generally attributable for non- assessable or disallowed items (Kirklin, et al., 2014). It can
be seen from the above discussion that this enterprise has followed all the basic requirements
of the Australian Tax Office (ATO) while estimating different taxes that has been included in
the financial statement of the company.
⊘ This is a preview!⊘
Do you want full access?
Subscribe today to unlock all pages.
Trusted by 1+ million students worldwide
9CORPORATE ACCOUNTING
References
Beekes, W., Brown, P., & Zhang, Q. (2015). Corporate governance and the informativeness
of disclosures in Australia: A re‐examination. Accounting & Finance, 55(4), 931-963.
Belal, A. R. (2016). Corporate social responsibility reporting in developing countries: The
case of Bangladesh. Routledge.
Chen, W., Zheng, R., Zeng, H., Zhang, S., & He, J. (2015). Annual report on status of cancer
in China, 2011. Chinese journal of cancer research, 27(1), 2.
Chen, W., Zheng, R., Zhang, S., Zhao, P., Zeng, H., Zou, X., & He, J. (2014). Annual report
on status of cancer in China, 2010. Chinese journal of cancer research, 26(1), 48.
Duff, A. (2016). Corporate social responsibility reporting in professional accounting
firms. The British Accounting Review, 48(1), 74-86.
Kirklin, J. K., Naftel, D. C., Pagani, F. D., Kormos, R. L., Stevenson, L. W., Blume, E. D., ...
& Young, J. B. (2014). Sixth INTERMACS annual report: a 10,000-patient
database. The Journal of Heart and Lung Transplantation, 33(6), 555-564.
Kirklin, J. K., Naftel, D. C., Pagani, F. D., Kormos, R. L., Stevenson, L. W., Blume, E. D., ...
& Young, J. B. (2015). Seventh INTERMACS annual report: 15,000 patients and
counting. The Journal of Heart and Lung Transplantation, 34(12), 1495-1504.
Kohler, B. A., Sherman, R. L., Howlader, N., Jemal, A., Ryerson, A. B., Henry, K. A., ... &
Henley, S. J. (2015). Annual report to the nation on the status of cancer, 1975-2011,
featuring incidence of breast cancer subtypes by race/ethnicity, poverty, and
state. Journal of the National Cancer Institute, 107(6), djv048.
Paraphrase This Document
Need a fresh take? Get an instant paraphrase of this document with our AI Paraphraser
10CORPORATE ACCOUNTING
Mowry, J. B., Spyker, D. A., Brooks, D. E., McMillan, N., & Schauben, J. L. (2015). 2014
annual report of the american association of poison control centers’ national poison
data system (NPDS): 32nd annual report. Clinical toxicology, 53(10), 962-1147.
Ryerson, A. B., Eheman, C. R., Altekruse, S. F., Ward, J. W., Jemal, A., Sherman, R. L., ... &
Anderson, R. N. (2016). Annual report to the nation on the status of cancer, 1975‐
2012, featuring the increasing incidence of liver cancer. Cancer, 122(9), 1312-1337.
Saeidi, S. P., Sofian, S., Saeidi, P., Saeidi, S. P., & Saaeidi, S. A. (2015). How does corporate
social responsibility contribute to firm financial performance? The mediating role of
competitive advantage, reputation, and customer satisfaction. Journal of Business
Research, 68(2), 341-350.
Schaltegger, S., & Burritt, R. (2017). Contemporary environmental accounting: issues,
concepts and practice. Routledge.
Scripp, L. (2016). Annual Report to the Massachusetts Department of Education: An
Analysis of 2016 Annual Music Literacy Skills Test Results at the Conservatory Lab
Charter School (CLCS).

11CORPORATE ACCOUNTING
⊘ This is a preview!⊘
Do you want full access?
Subscribe today to unlock all pages.
Trusted by 1+ million students worldwide
1 out of 12
Related Documents


Your All-in-One AI-Powered Toolkit for Academic Success.
+13062052269
info@desklib.com
Available 24*7 on WhatsApp / Email
![[object Object]](/_next/static/media/star-bottom.7253800d.svg)
Unlock your academic potential
Copyright © 2020–2026 A2Z Services. All Rights Reserved. Developed and managed by ZUCOL.