HI5020 Corporate Accounting: BHP Billiton & South 32 Financial Report
VerifiedAdded on 2023/06/04
|15
|4001
|423
Report
AI Summary
This corporate accounting report provides a comparative financial analysis of BHP Billiton and South 32, two Australian companies listed on the ASX, for the years 2015-2017. The report examines changes in equity and debt, describing items in the statement of changes in equity, equity shareholders account, and cash flow statement. It analyzes cash flow segments and discusses the comprehensive income statement's importance. Additionally, it covers taxation aspects, including effective, book, and corporate tax rates, deferred tax assets, and liabilities. The analysis reveals insights into the companies' financial strategies, debt management, and investment activities during the analyzed period. Desklib offers a variety of solved assignments and study resources for students.
–
Corporate Accounting
Assignment
Corporate Accounting
Assignment
Paraphrase This Document
Need a fresh take? Get an instant paraphrase of this document with our AI Paraphraser
1
By student name
Professor
University
Date: August 2018.
1 | P a g e
By student name
Professor
University
Date: August 2018.
1 | P a g e
2
Executive Summary
A financial analysis report has been prepared on two of the Australian companies which are listed on the
Australian Stock Exchange. The comparative analysis for the last 3 years 2017, 2016 and 2015 has been
done. The report covers the changes in the equity as well as debt over these years and how the
composition of debt and equity has affected the company. It also gives a brief description of all the
items shown in the statement of changes in equity, the equity shareholders account and the cash flow
statement. The report shows the changes in the 3 types of cash flow segments over years for both the
companies. It also mentions the reasons as to why the the comprehensive income statement is also
prepared over and above the normal profit and loss account and if this should be included for
performance assessment of the employees. Lastly, the report also covers various aspects of taxation as
to what is the effective rate, the book rate and corporate rate of taxation, what is the tax being paid by
company and what s meant by deferred tax assets and deferred tax liabilities, etc.
2 | P a g e
⊘ This is a preview!⊘
Do you want full access?
Subscribe today to unlock all pages.
Trusted by 1+ million students worldwide
3
Contents
Executive Summary.....................................................................................................................................2
Introduction.................................................................................................................................................4
Owner’s Equity............................................................................................................................................4
Cash Flow Statement...................................................................................................................................7
Other comprehensive income statement....................................................................................................9
Accounting for Corporate Income Tax.......................................................................................................11
Conclusion.................................................................................................................................................13
References.................................................................................................................................................13
3 | P a g e
Paraphrase This Document
Need a fresh take? Get an instant paraphrase of this document with our AI Paraphraser
4
Introduction
The two companies which have been considered here for analysis is BHP Billition and the South 32.
South 32 is a company dealing in mining and metallurgy industry. It is also listed in London and in
Johannesberg Stock exchanges and employs more than 15000 people. It is one of the chief producers of
mica, nickel, zinc, lead, thermal coal, coking coal, aluminium, alumina, silver, etc. off late the company
has been in the growing phase (Arnott, et al., 2017).
On the other hand, BHP Billition is one of the largest companies in Australia and is engaged in mining
and metal and petroleum industry. It is listed on a a number of Stock exchanges over the world namely
New York Stock exchange, London and Johannesberg Stock Exchange and Financial Times Stock
Exchange 100. In terms of mining, this is the largest in world and in terms of revenue, it ranks 3 rd in
Australia. It has customers over the globe and gives employement to more than 65000 people.
Owner’s Equity
i. The owners’ capital which is also known as the own capital represents the capital of the
shareholders of the company. This is high cost and high risk and therefore higher returns are
expected out of it. On the other hand, debt or the loan capital comes at lower cost and low
risk is involved and hence the returns are only in the form of interest (Carlin, 2011). The
equity has got many components like the share capital –equity and preference, retained
earnings, dividend, net profit, and various other reserves, all these belong to equity
shareholders, all of which has been defined below:
a. Share capital: The capital of the company is divided in small denominations or parts
whicha are known as shares, alltgether it is called the share capital. It is traded in market
and its holders are called the shareholders. For BHP, the balance of share capital
remained constant during 3 years whereas South 32 made a buy back of equity shares in
2017, which led to the decrease in equity shares balance.
b. Treasury Shares: These are mainly preferential shares which belongs to employees as
part of dividend reinvestment plan or ESOP. For BHP Billiton, the balanace of the
4 | P a g e
5
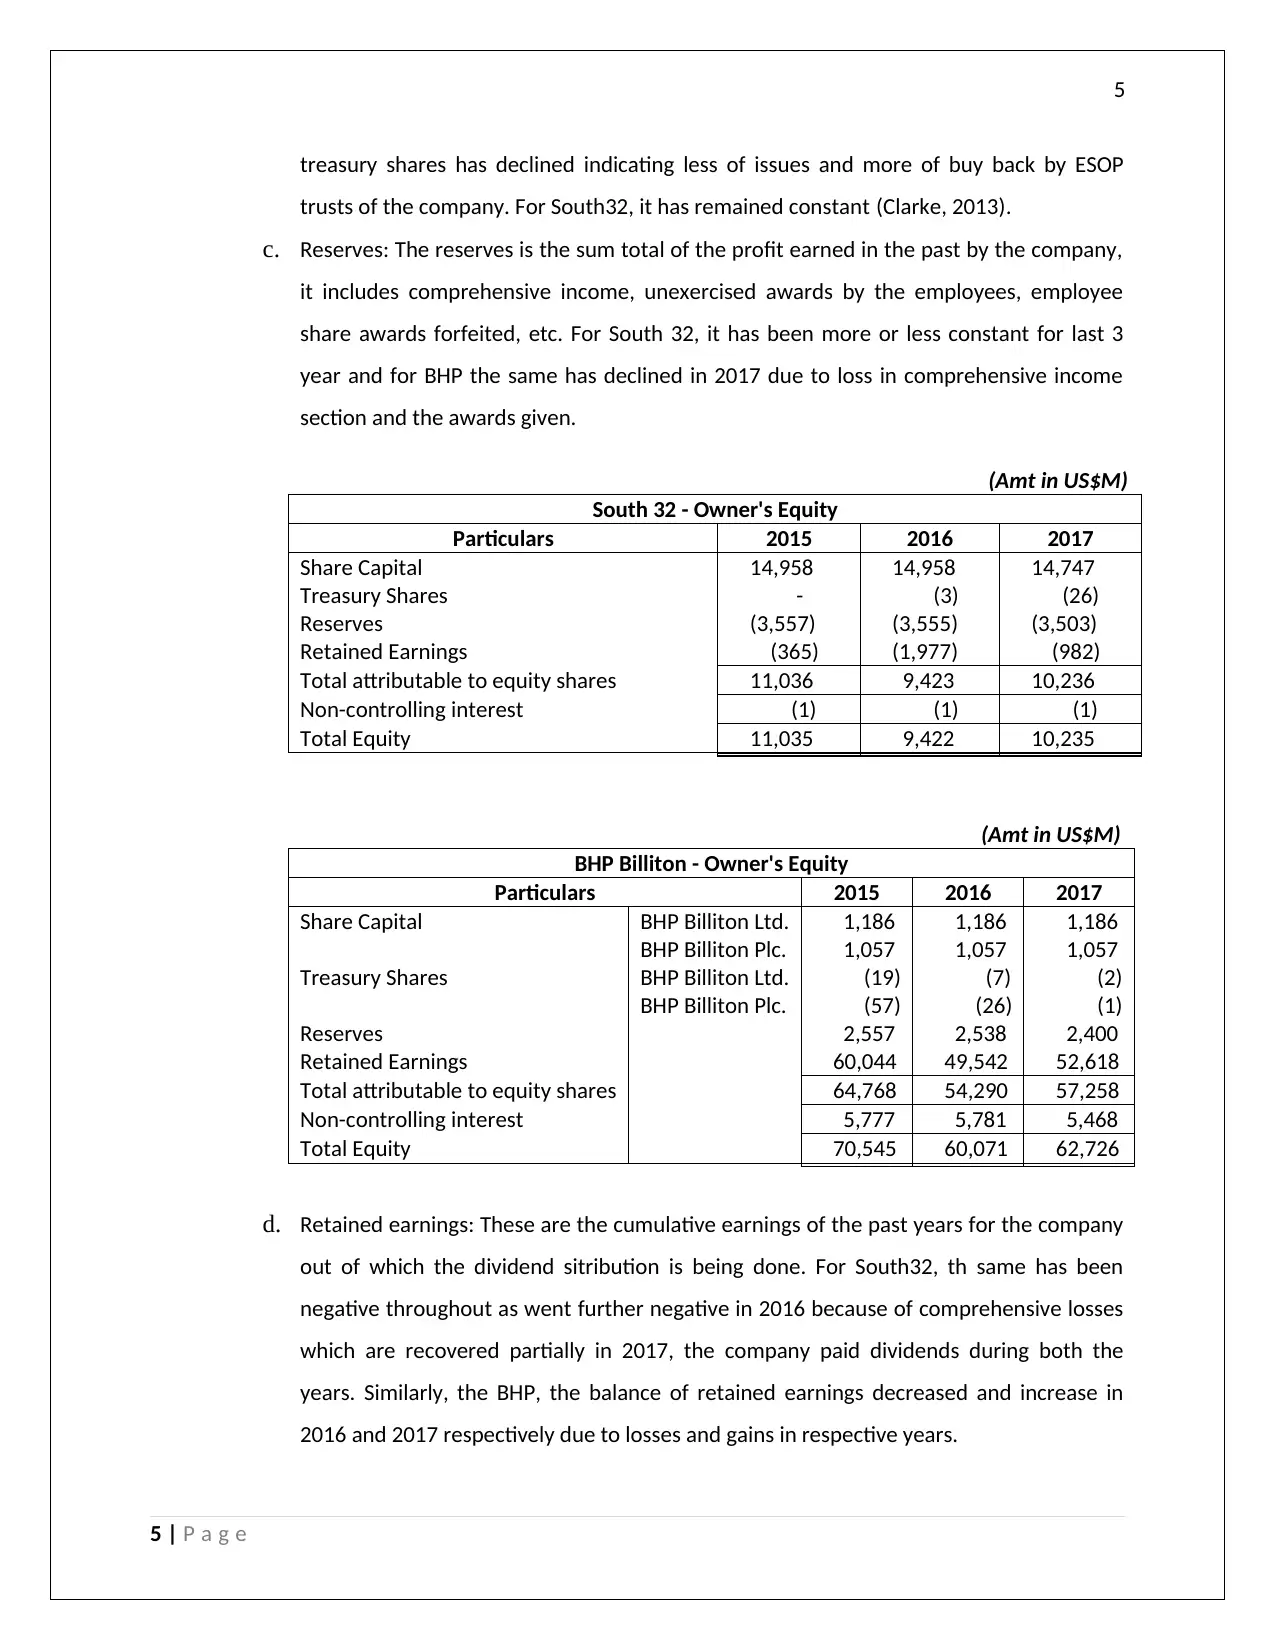
treasury shares has declined indicating less of issues and more of buy back by ESOP
trusts of the company. For South32, it has remained constant (Clarke, 2013).
c. Reserves: The reserves is the sum total of the profit earned in the past by the company,
it includes comprehensive income, unexercised awards by the employees, employee
share awards forfeited, etc. For South 32, it has been more or less constant for last 3
year and for BHP the same has declined in 2017 due to loss in comprehensive income
section and the awards given.
(Amt in US$M)
South 32 - Owner's Equity
Particulars 2015 2016 2017
Share Capital 14,958 14,958 14,747
Treasury Shares - (3) (26)
Reserves (3,557) (3,555) (3,503)
Retained Earnings (365) (1,977) (982)
Total attributable to equity shares 11,036 9,423 10,236
Non-controlling interest (1) (1) (1)
Total Equity 11,035 9,422 10,235
(Amt in US$M)
BHP Billiton - Owner's Equity
Particulars 2015 2016 2017
Share Capital BHP Billiton Ltd. 1,186 1,186 1,186
BHP Billiton Plc. 1,057 1,057 1,057
Treasury Shares BHP Billiton Ltd. (19) (7) (2)
BHP Billiton Plc. (57) (26) (1)
Reserves 2,557 2,538 2,400
Retained Earnings 60,044 49,542 52,618
Total attributable to equity shares 64,768 54,290 57,258
Non-controlling interest 5,777 5,781 5,468
Total Equity 70,545 60,071 62,726
d. Retained earnings: These are the cumulative earnings of the past years for the company
out of which the dividend sitribution is being done. For South32, th same has been
negative throughout as went further negative in 2016 because of comprehensive losses
which are recovered partially in 2017, the company paid dividends during both the
years. Similarly, the BHP, the balance of retained earnings decreased and increase in
2016 and 2017 respectively due to losses and gains in respective years.
5 | P a g e
⊘ This is a preview!⊘
Do you want full access?
Subscribe today to unlock all pages.
Trusted by 1+ million students worldwide
6
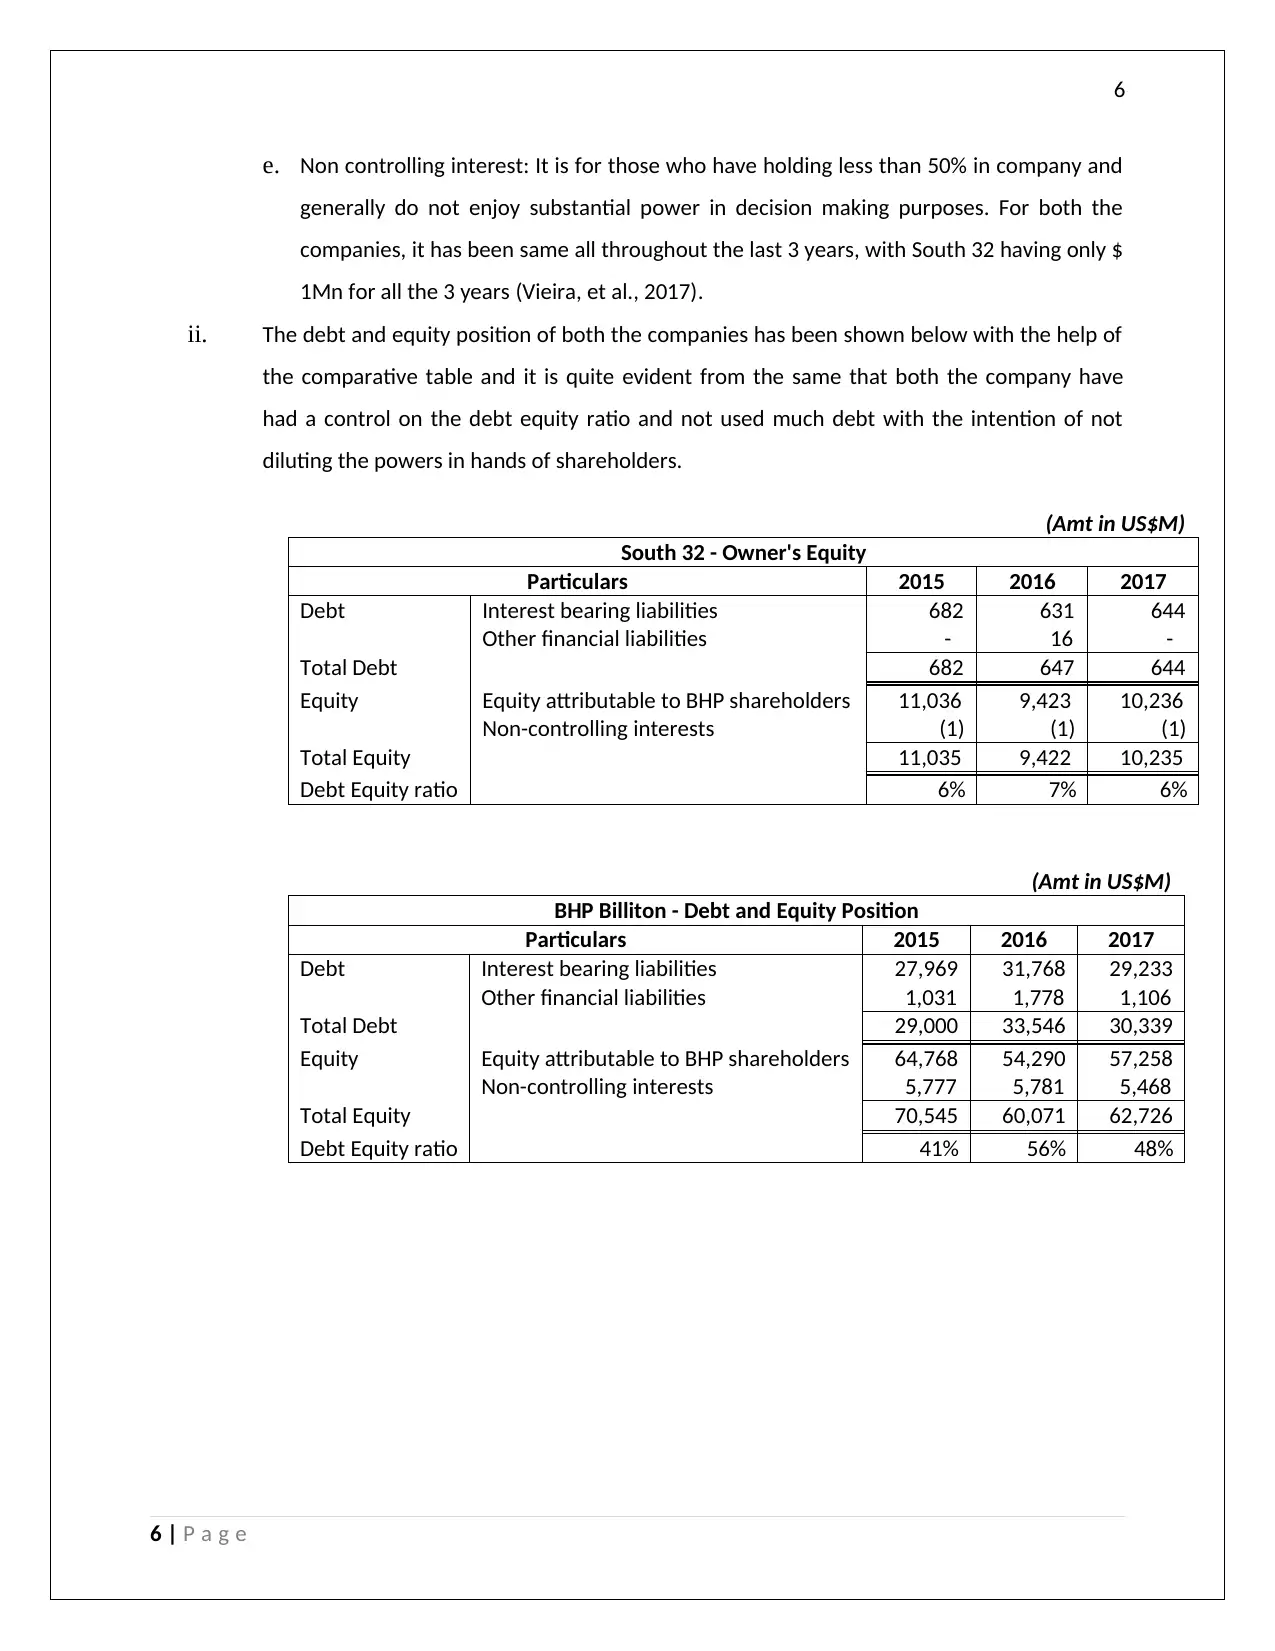
e. Non controlling interest: It is for those who have holding less than 50% in company and
generally do not enjoy substantial power in decision making purposes. For both the
companies, it has been same all throughout the last 3 years, with South 32 having only $
1Mn for all the 3 years (Vieira, et al., 2017).
ii. The debt and equity position of both the companies has been shown below with the help of
the comparative table and it is quite evident from the same that both the company have
had a control on the debt equity ratio and not used much debt with the intention of not
diluting the powers in hands of shareholders.
(Amt in US$M)
South 32 - Owner's Equity
Particulars 2015 2016 2017
Debt Interest bearing liabilities 682 631 644
Other financial liabilities - 16 -
Total Debt 682 647 644
Equity Equity attributable to BHP shareholders 11,036 9,423 10,236
Non-controlling interests (1) (1) (1)
Total Equity 11,035 9,422 10,235
Debt Equity ratio 6% 7% 6%
(Amt in US$M)
BHP Billiton - Debt and Equity Position
Particulars 2015 2016 2017
Debt Interest bearing liabilities 27,969 31,768 29,233
Other financial liabilities 1,031 1,778 1,106
Total Debt 29,000 33,546 30,339
Equity Equity attributable to BHP shareholders 64,768 54,290 57,258
Non-controlling interests 5,777 5,781 5,468
Total Equity 70,545 60,071 62,726
Debt Equity ratio 41% 56% 48%
6 | P a g e
Paraphrase This Document
Need a fresh take? Get an instant paraphrase of this document with our AI Paraphraser
7
Cash Flow Statement
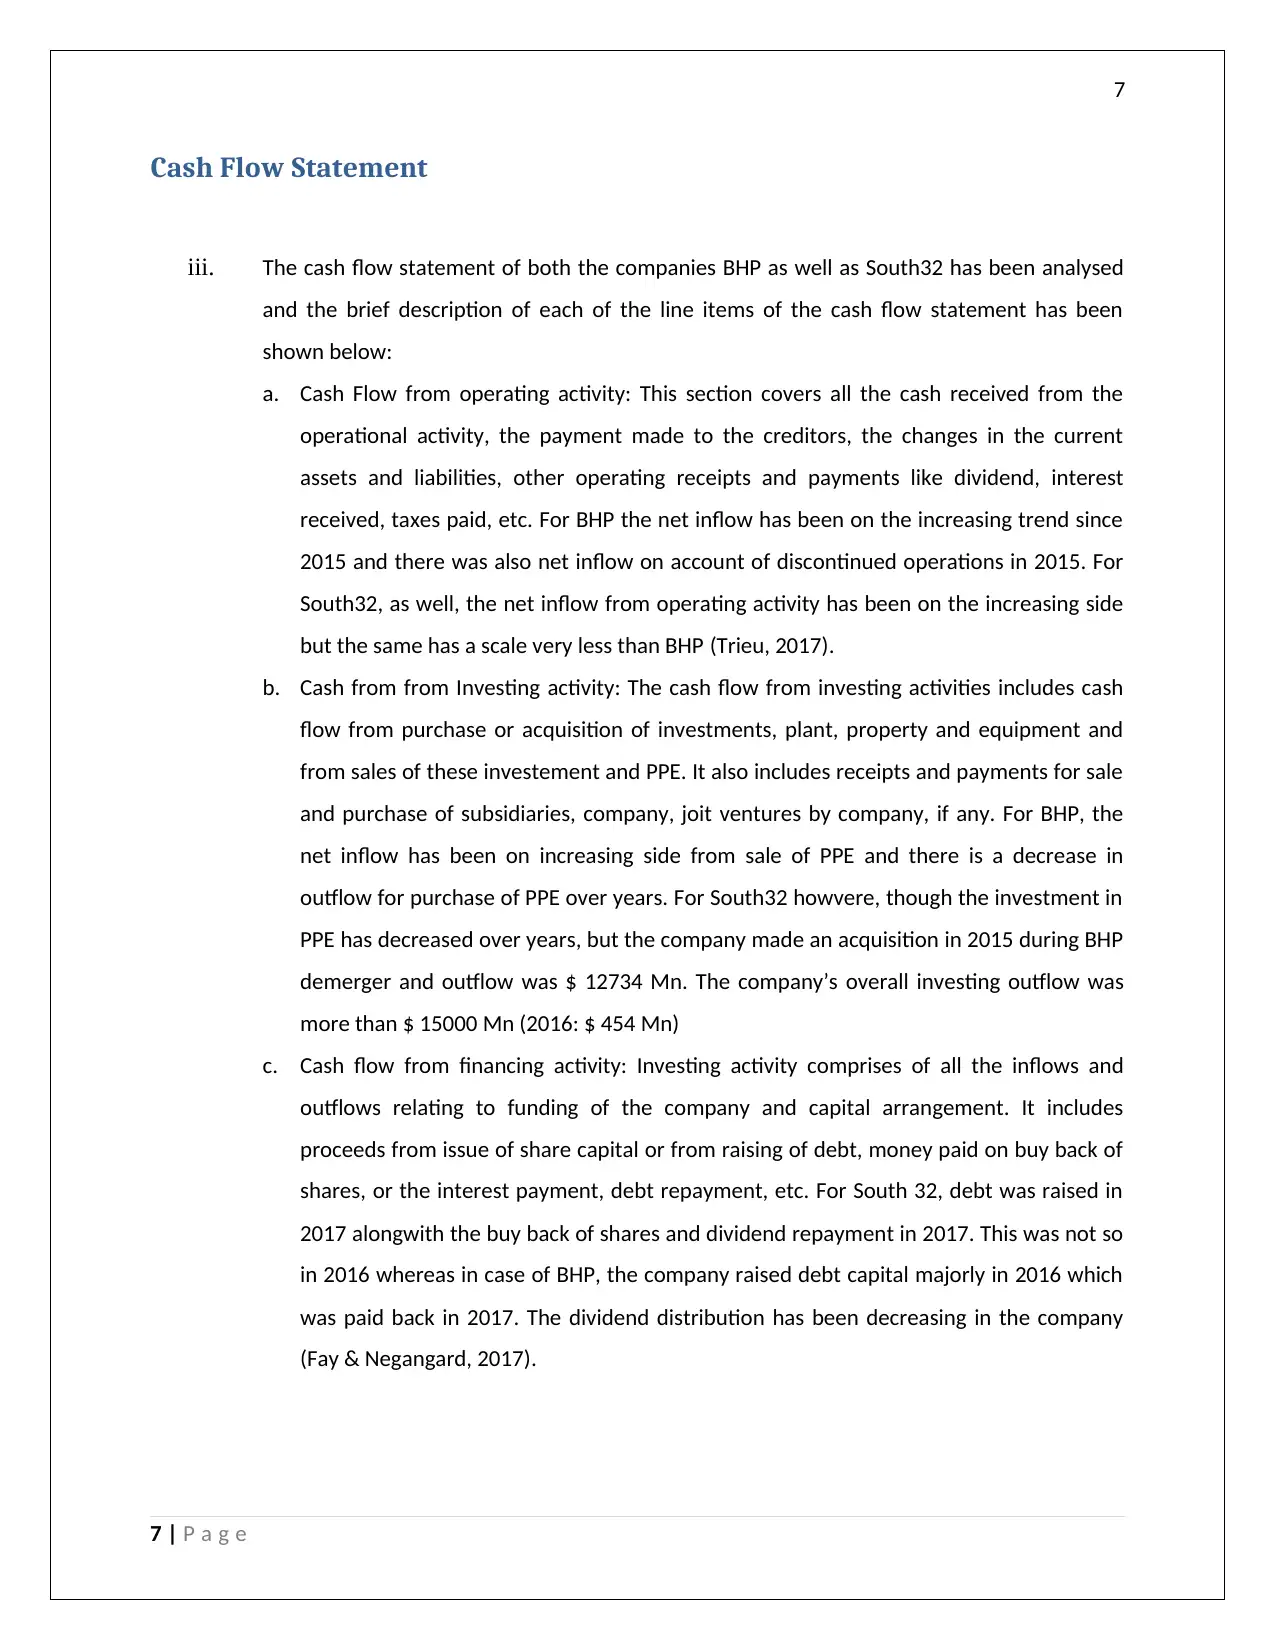
iii. The cash flow statement of both the companies BHP as well as South32 has been analysed
and the brief description of each of the line items of the cash flow statement has been
shown below:
a. Cash Flow from operating activity: This section covers all the cash received from the
operational activity, the payment made to the creditors, the changes in the current
assets and liabilities, other operating receipts and payments like dividend, interest
received, taxes paid, etc. For BHP the net inflow has been on the increasing trend since
2015 and there was also net inflow on account of discontinued operations in 2015. For
South32, as well, the net inflow from operating activity has been on the increasing side
but the same has a scale very less than BHP (Trieu, 2017).
b. Cash from from Investing activity: The cash flow from investing activities includes cash
flow from purchase or acquisition of investments, plant, property and equipment and
from sales of these investement and PPE. It also includes receipts and payments for sale
and purchase of subsidiaries, company, joit ventures by company, if any. For BHP, the
net inflow has been on increasing side from sale of PPE and there is a decrease in
outflow for purchase of PPE over years. For South32 howvere, though the investment in
PPE has decreased over years, but the company made an acquisition in 2015 during BHP
demerger and outflow was $ 12734 Mn. The company’s overall investing outflow was
more than $ 15000 Mn (2016: $ 454 Mn)
c. Cash flow from financing activity: Investing activity comprises of all the inflows and
outflows relating to funding of the company and capital arrangement. It includes
proceeds from issue of share capital or from raising of debt, money paid on buy back of
shares, or the interest payment, debt repayment, etc. For South 32, debt was raised in
2017 alongwith the buy back of shares and dividend repayment in 2017. This was not so
in 2016 whereas in case of BHP, the company raised debt capital majorly in 2016 which
was paid back in 2017. The dividend distribution has been decreasing in the company
(Fay & Negangard, 2017).
7 | P a g e
Cash Flow Statement
iii. The cash flow statement of both the companies BHP as well as South32 has been analysed
and the brief description of each of the line items of the cash flow statement has been
shown below:
a. Cash Flow from operating activity: This section covers all the cash received from the
operational activity, the payment made to the creditors, the changes in the current
assets and liabilities, other operating receipts and payments like dividend, interest
received, taxes paid, etc. For BHP the net inflow has been on the increasing trend since
2015 and there was also net inflow on account of discontinued operations in 2015. For
South32, as well, the net inflow from operating activity has been on the increasing side
but the same has a scale very less than BHP (Trieu, 2017).
b. Cash from from Investing activity: The cash flow from investing activities includes cash
flow from purchase or acquisition of investments, plant, property and equipment and
from sales of these investement and PPE. It also includes receipts and payments for sale
and purchase of subsidiaries, company, joit ventures by company, if any. For BHP, the
net inflow has been on increasing side from sale of PPE and there is a decrease in
outflow for purchase of PPE over years. For South32 howvere, though the investment in
PPE has decreased over years, but the company made an acquisition in 2015 during BHP
demerger and outflow was $ 12734 Mn. The company’s overall investing outflow was
more than $ 15000 Mn (2016: $ 454 Mn)
c. Cash flow from financing activity: Investing activity comprises of all the inflows and
outflows relating to funding of the company and capital arrangement. It includes
proceeds from issue of share capital or from raising of debt, money paid on buy back of
shares, or the interest payment, debt repayment, etc. For South 32, debt was raised in
2017 alongwith the buy back of shares and dividend repayment in 2017. This was not so
in 2016 whereas in case of BHP, the company raised debt capital majorly in 2016 which
was paid back in 2017. The dividend distribution has been decreasing in the company
(Fay & Negangard, 2017).
7 | P a g e
8
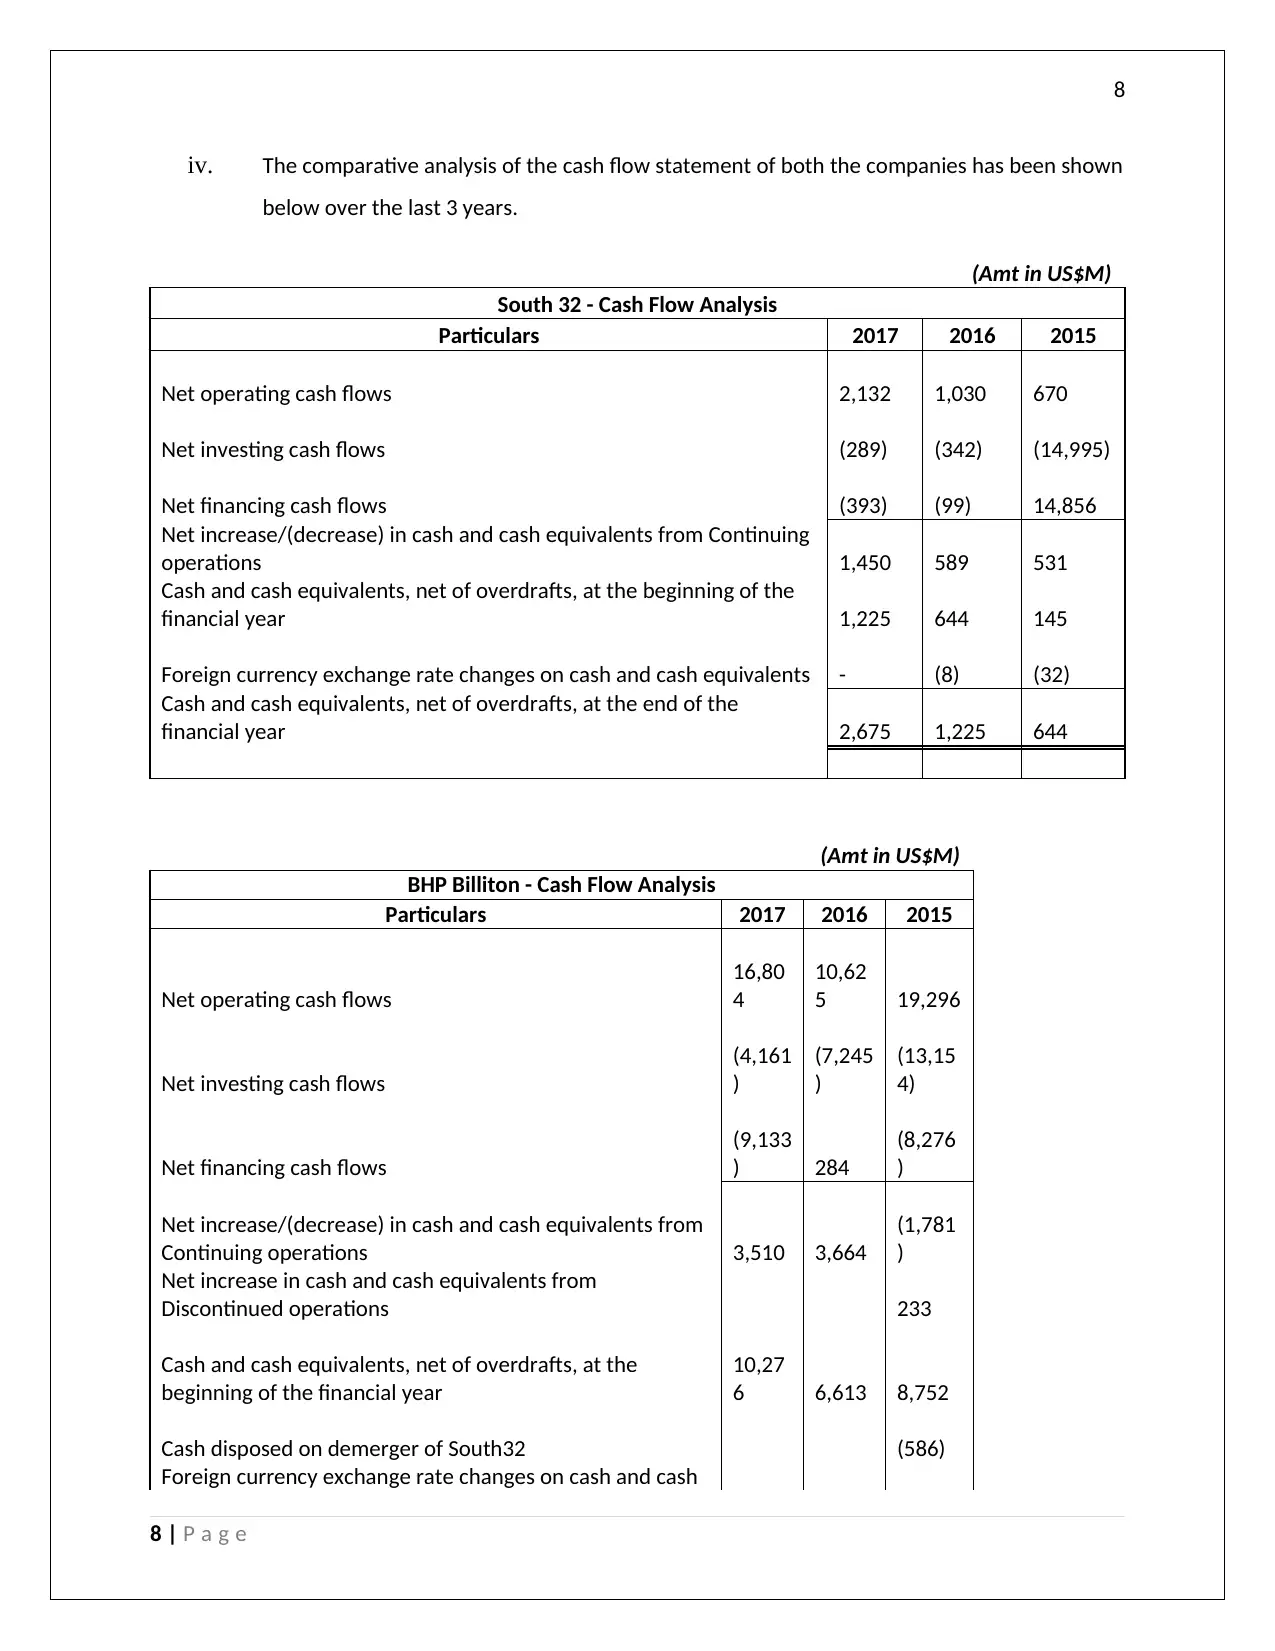
iv. The comparative analysis of the cash flow statement of both the companies has been shown
below over the last 3 years.
(Amt in US$M)
South 32 - Cash Flow Analysis
Particulars 2017 2016 2015
Net operating cash flows 2,132 1,030 670
Net investing cash flows (289) (342) (14,995)
Net financing cash flows (393) (99) 14,856
Net increase/(decrease) in cash and cash equivalents from Continuing
operations 1,450 589 531
Cash and cash equivalents, net of overdrafts, at the beginning of the
financial year 1,225 644 145
Foreign currency exchange rate changes on cash and cash equivalents - (8) (32)
Cash and cash equivalents, net of overdrafts, at the end of the
financial year 2,675 1,225 644
(Amt in US$M)
BHP Billiton - Cash Flow Analysis
Particulars 2017 2016 2015
Net operating cash flows
16,80
4
10,62
5 19,296
Net investing cash flows
(4,161
)
(7,245
)
(13,15
4)
Net financing cash flows
(9,133
) 284
(8,276
)
Net increase/(decrease) in cash and cash equivalents from
Continuing operations 3,510 3,664
(1,781
)
Net increase in cash and cash equivalents from
Discontinued operations 233
Cash and cash equivalents, net of overdrafts, at the
beginning of the financial year
10,27
6 6,613 8,752
Cash disposed on demerger of South32 (586)
Foreign currency exchange rate changes on cash and cash
8 | P a g e
⊘ This is a preview!⊘
Do you want full access?
Subscribe today to unlock all pages.
Trusted by 1+ million students worldwide
9
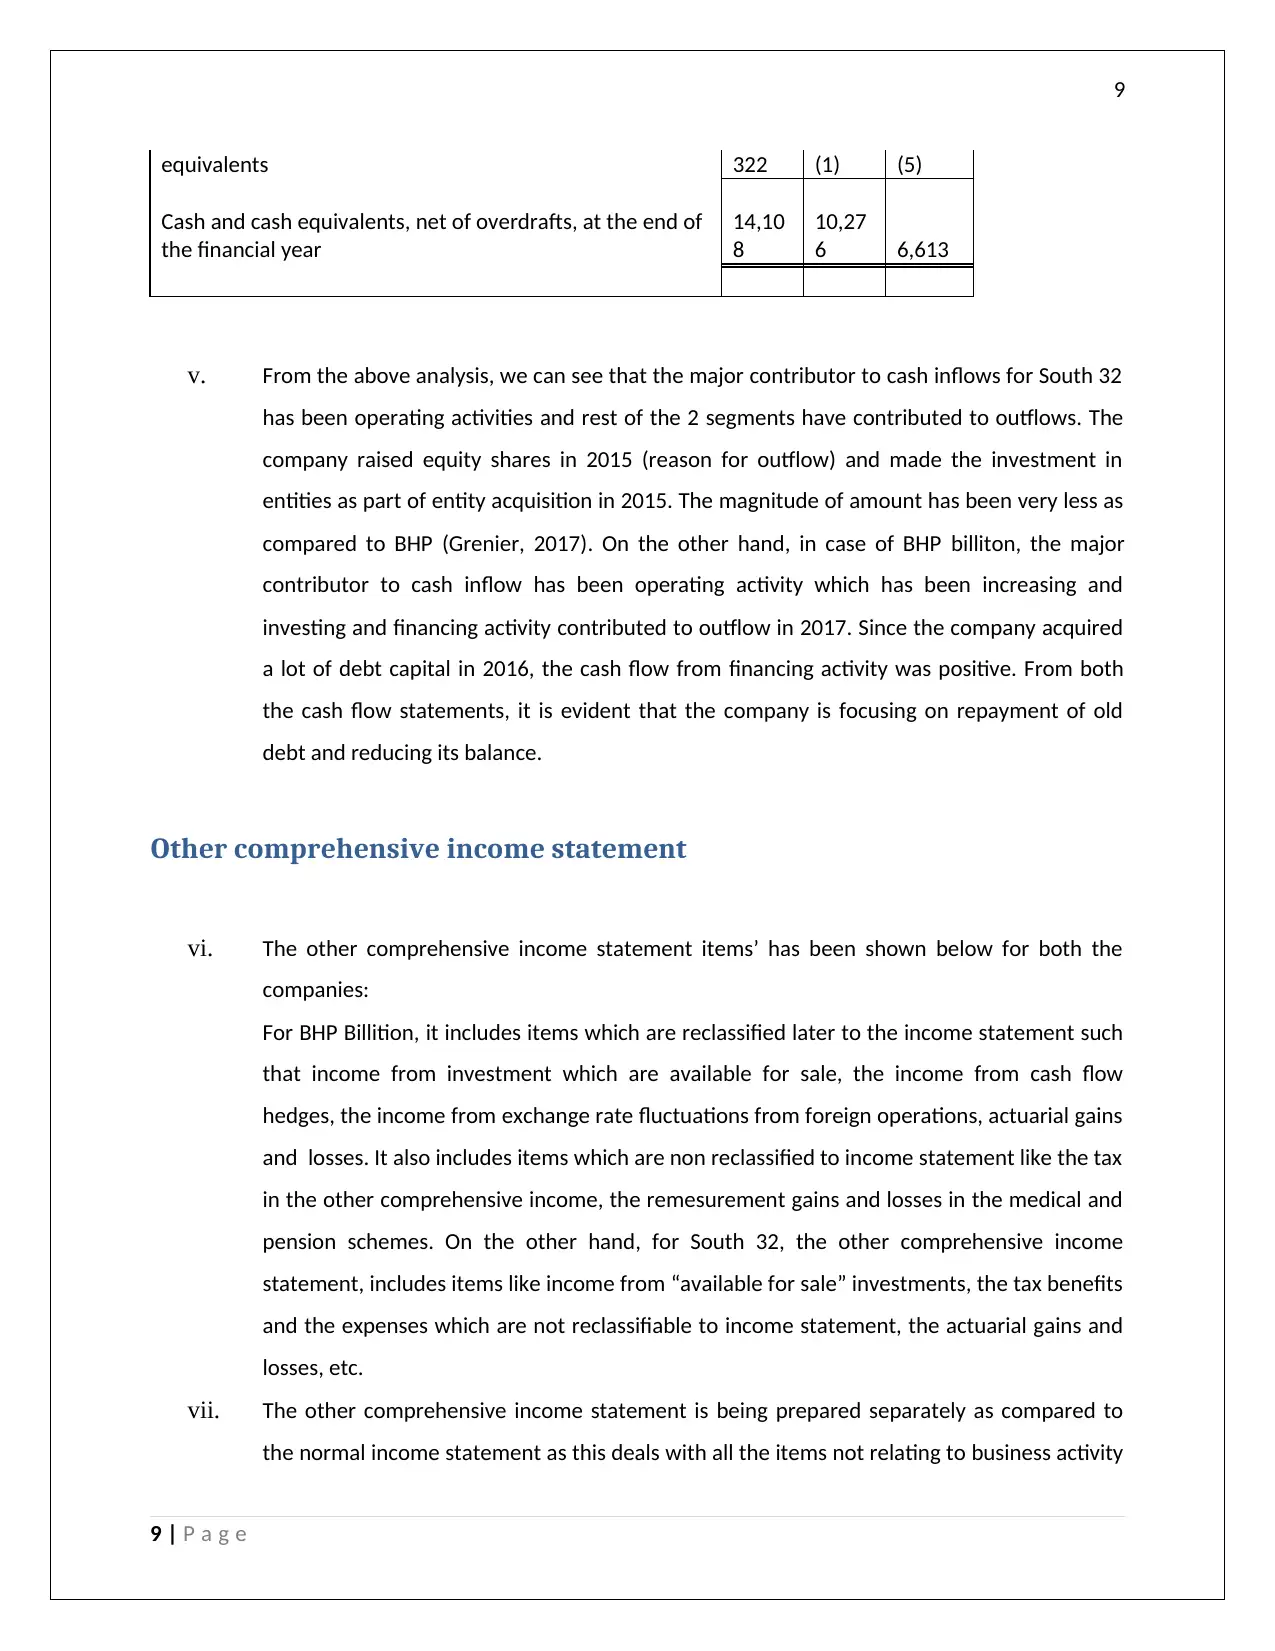
equivalents 322 (1) (5)
Cash and cash equivalents, net of overdrafts, at the end of
the financial year
14,10
8
10,27
6 6,613
v. From the above analysis, we can see that the major contributor to cash inflows for South 32
has been operating activities and rest of the 2 segments have contributed to outflows. The
company raised equity shares in 2015 (reason for outflow) and made the investment in
entities as part of entity acquisition in 2015. The magnitude of amount has been very less as
compared to BHP (Grenier, 2017). On the other hand, in case of BHP billiton, the major
contributor to cash inflow has been operating activity which has been increasing and
investing and financing activity contributed to outflow in 2017. Since the company acquired
a lot of debt capital in 2016, the cash flow from financing activity was positive. From both
the cash flow statements, it is evident that the company is focusing on repayment of old
debt and reducing its balance.
Other comprehensive income statement
vi. The other comprehensive income statement items’ has been shown below for both the
companies:
For BHP Billition, it includes items which are reclassified later to the income statement such
that income from investment which are available for sale, the income from cash flow
hedges, the income from exchange rate fluctuations from foreign operations, actuarial gains
and losses. It also includes items which are non reclassified to income statement like the tax
in the other comprehensive income, the remesurement gains and losses in the medical and
pension schemes. On the other hand, for South 32, the other comprehensive income
statement, includes items like income from “available for sale” investments, the tax benefits
and the expenses which are not reclassifiable to income statement, the actuarial gains and
losses, etc.
vii. The other comprehensive income statement is being prepared separately as compared to
the normal income statement as this deals with all the items not relating to business activity
9 | P a g e
Paraphrase This Document
Need a fresh take? Get an instant paraphrase of this document with our AI Paraphraser
10
but anciliary activities. Some of it can be later on classified to income statement when it is
actually realised, some cannot be done so. Moreover, it has also been stated as one of the
requirements of the IFRS that the OCI should be shown separately as per the new
accounting guidelines and therefore the same is being done (Kew & Stredwick, 2017).
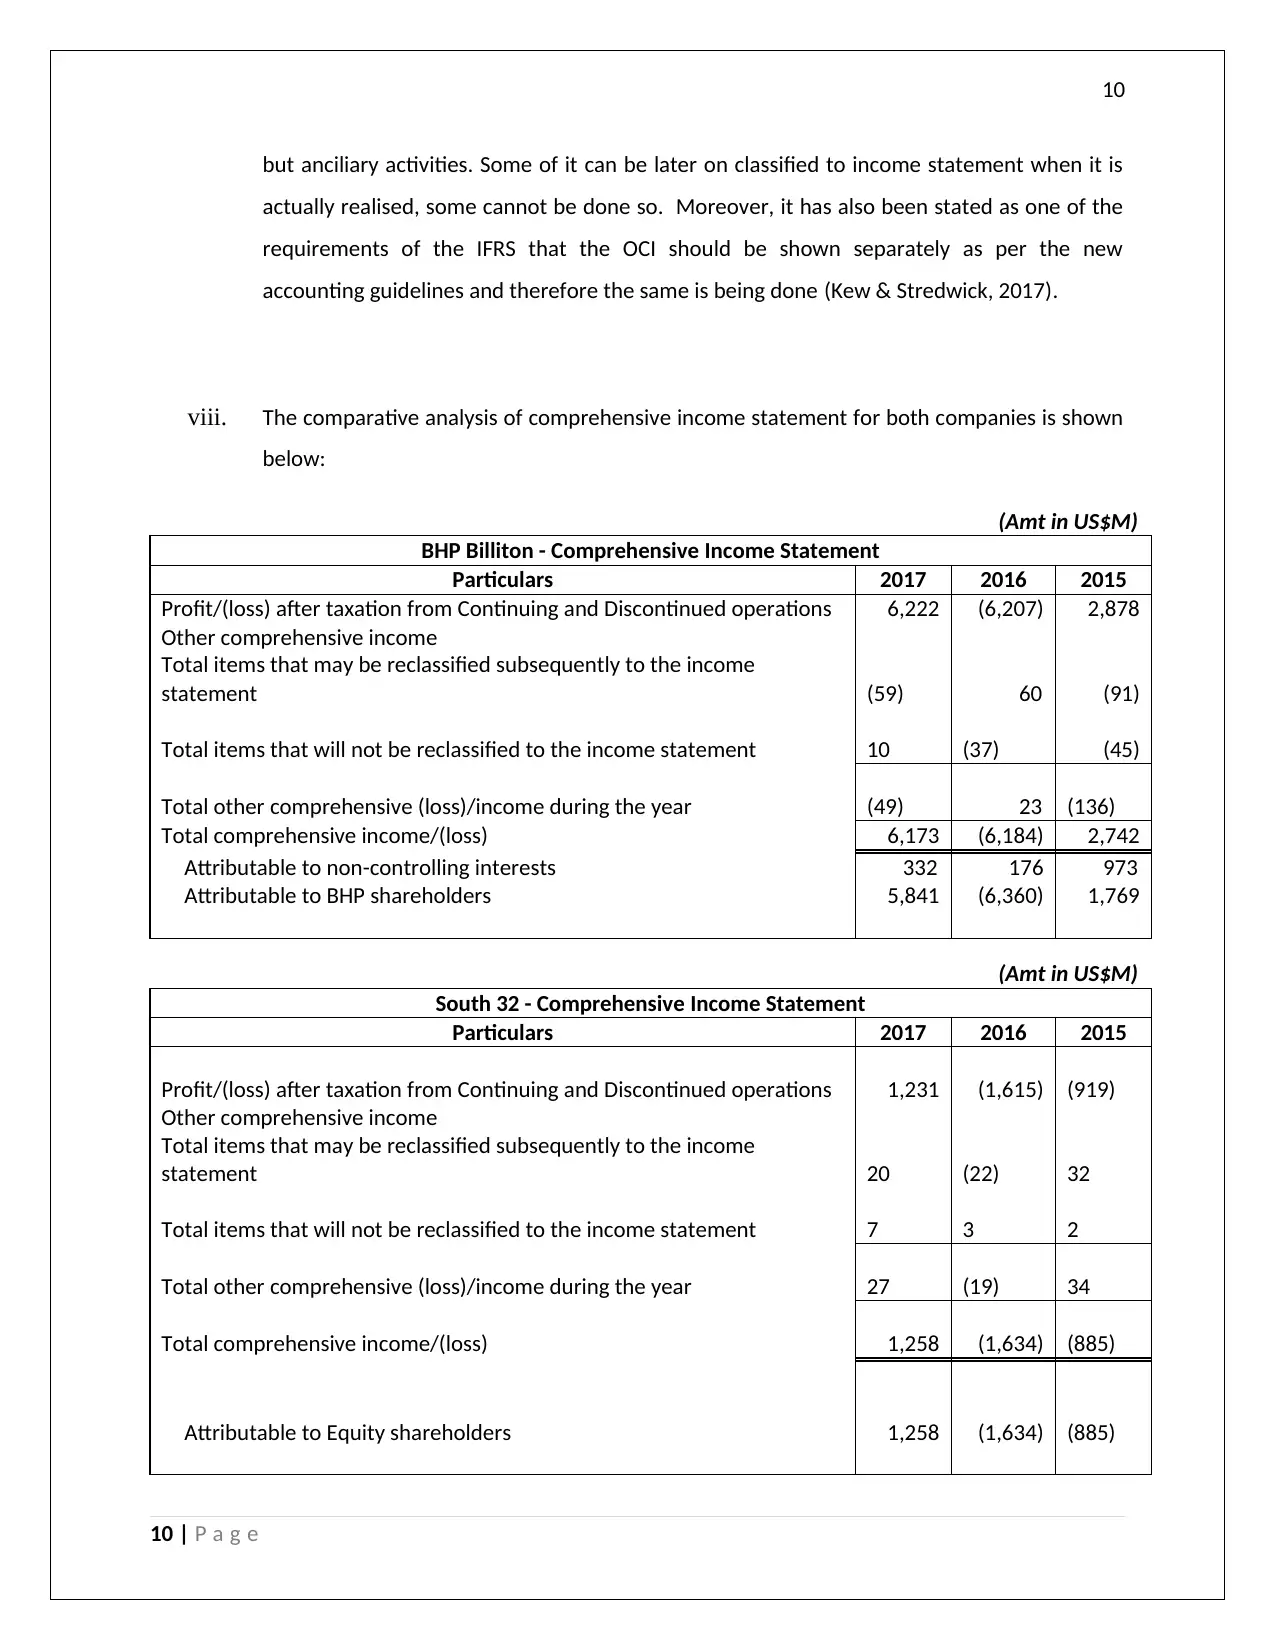
viii. The comparative analysis of comprehensive income statement for both companies is shown
below:
(Amt in US$M)
BHP Billiton - Comprehensive Income Statement
Particulars 2017 2016 2015
Profit/(loss) after taxation from Continuing and Discontinued operations 6,222 (6,207) 2,878
Other comprehensive income
Total items that may be reclassified subsequently to the income
statement (59) 60 (91)
Total items that will not be reclassified to the income statement 10 (37) (45)
Total other comprehensive (loss)/income during the year (49) 23 (136)
Total comprehensive income/(loss) 6,173 (6,184) 2,742
Attributable to non-controlling interests 332 176 973
Attributable to BHP shareholders 5,841 (6,360) 1,769
(Amt in US$M)
South 32 - Comprehensive Income Statement
Particulars 2017 2016 2015
Profit/(loss) after taxation from Continuing and Discontinued operations 1,231 (1,615) (919)
Other comprehensive income
Total items that may be reclassified subsequently to the income
statement 20 (22) 32
Total items that will not be reclassified to the income statement 7 3 2
Total other comprehensive (loss)/income during the year 27 (19) 34
Total comprehensive income/(loss) 1,258 (1,634) (885)
Attributable to Equity shareholders 1,258 (1,634) (885)
10 | P a g e
but anciliary activities. Some of it can be later on classified to income statement when it is
actually realised, some cannot be done so. Moreover, it has also been stated as one of the
requirements of the IFRS that the OCI should be shown separately as per the new
accounting guidelines and therefore the same is being done (Kew & Stredwick, 2017).
viii. The comparative analysis of comprehensive income statement for both companies is shown
below:
(Amt in US$M)
BHP Billiton - Comprehensive Income Statement
Particulars 2017 2016 2015
Profit/(loss) after taxation from Continuing and Discontinued operations 6,222 (6,207) 2,878
Other comprehensive income
Total items that may be reclassified subsequently to the income
statement (59) 60 (91)
Total items that will not be reclassified to the income statement 10 (37) (45)
Total other comprehensive (loss)/income during the year (49) 23 (136)
Total comprehensive income/(loss) 6,173 (6,184) 2,742
Attributable to non-controlling interests 332 176 973
Attributable to BHP shareholders 5,841 (6,360) 1,769
(Amt in US$M)
South 32 - Comprehensive Income Statement
Particulars 2017 2016 2015
Profit/(loss) after taxation from Continuing and Discontinued operations 1,231 (1,615) (919)
Other comprehensive income
Total items that may be reclassified subsequently to the income
statement 20 (22) 32
Total items that will not be reclassified to the income statement 7 3 2
Total other comprehensive (loss)/income during the year 27 (19) 34
Total comprehensive income/(loss) 1,258 (1,634) (885)
Attributable to Equity shareholders 1,258 (1,634) (885)
10 | P a g e
11
In the abvove comprehensive income would be considated along with the income
statement, the overall income would fall and there would be less profit available for
distribution.
ix. The items which forms a part of the other comprehensive income statement include
hedging gains and losses, actuarial gains and losses, the income and losses on fair valuation
of assets and liabilities all of which is not related to normal business operation and hence no
person can be made directly responsible for the same and hence it should not be included in
evaluation criteria for managers (Kim, et al., 2017).
Accounting for Corporate Income Tax
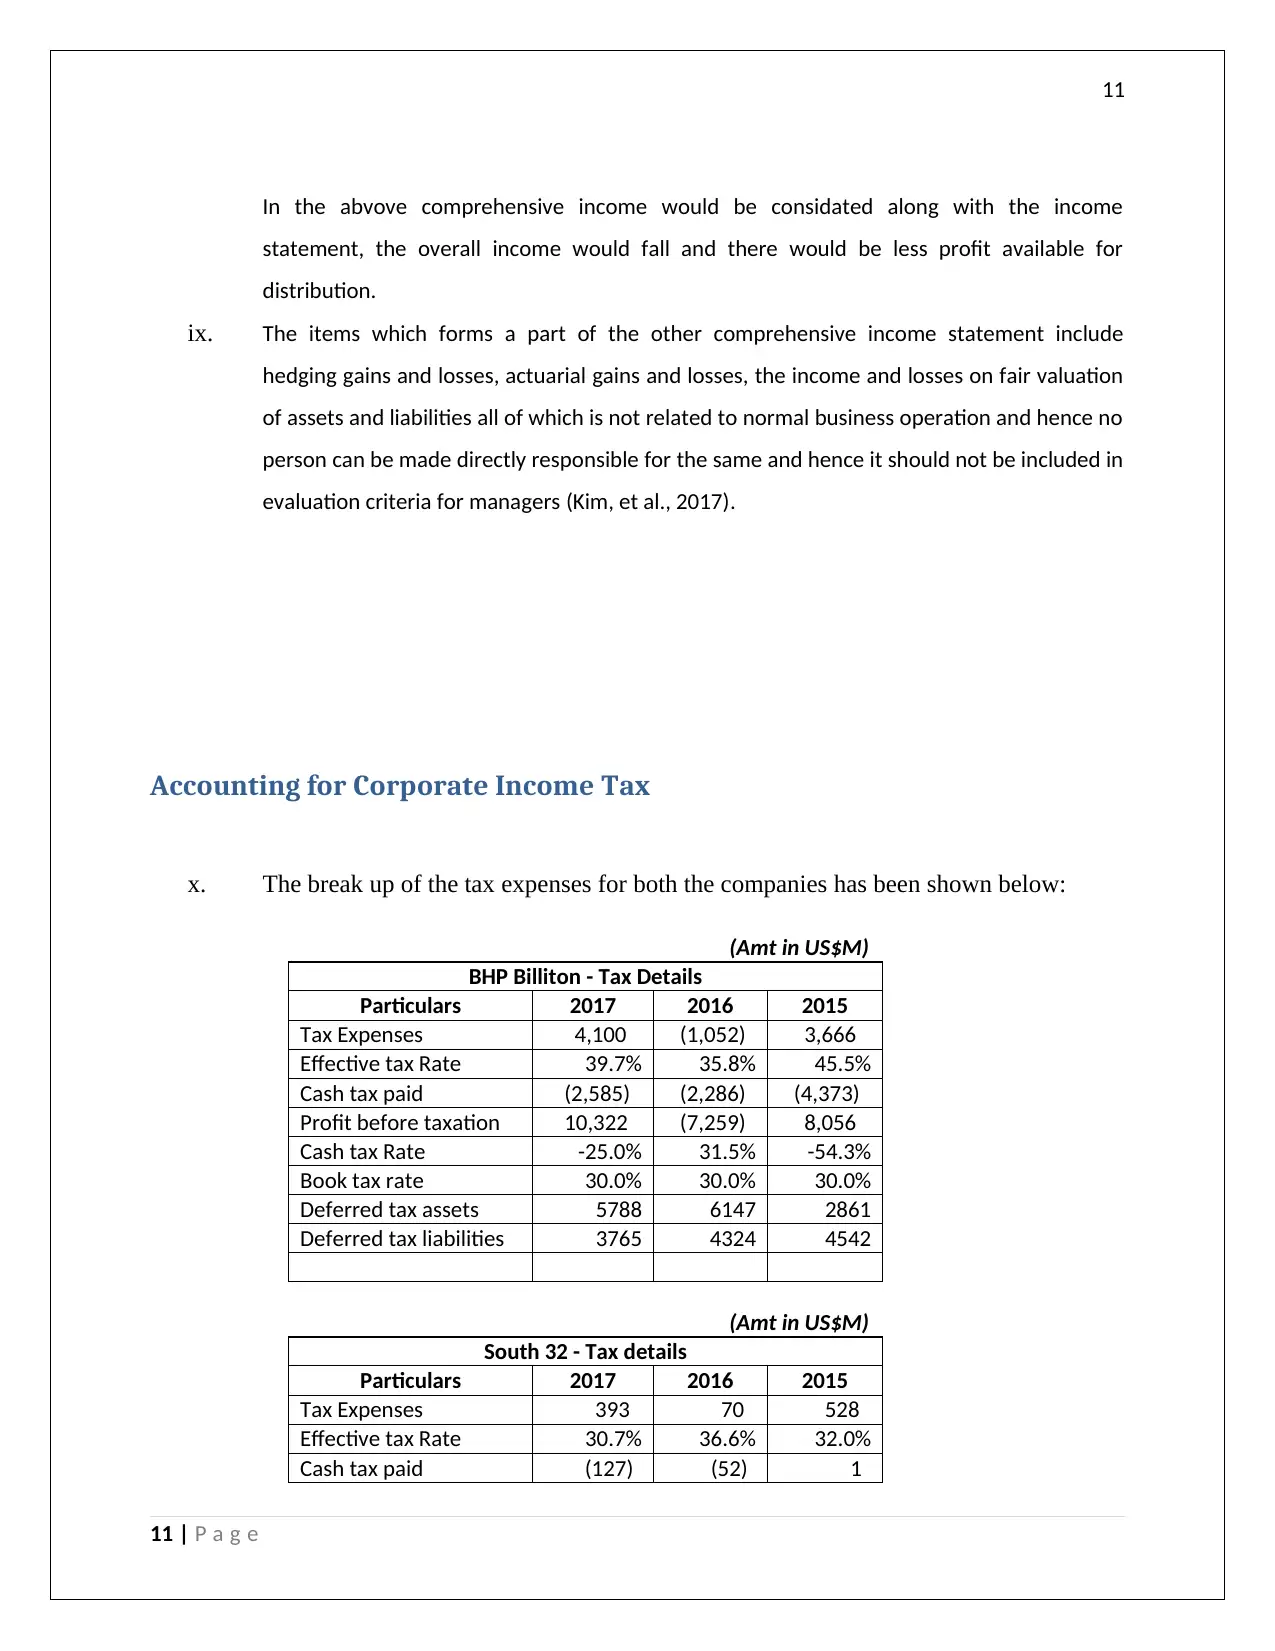
x. The break up of the tax expenses for both the companies has been shown below:
(Amt in US$M)
BHP Billiton - Tax Details
Particulars 2017 2016 2015
Tax Expenses 4,100 (1,052) 3,666
Effective tax Rate 39.7% 35.8% 45.5%
Cash tax paid (2,585) (2,286) (4,373)
Profit before taxation 10,322 (7,259) 8,056
Cash tax Rate -25.0% 31.5% -54.3%
Book tax rate 30.0% 30.0% 30.0%
Deferred tax assets 5788 6147 2861
Deferred tax liabilities 3765 4324 4542
(Amt in US$M)
South 32 - Tax details
Particulars 2017 2016 2015
Tax Expenses 393 70 528
Effective tax Rate 30.7% 36.6% 32.0%
Cash tax paid (127) (52) 1
11 | P a g e
In the abvove comprehensive income would be considated along with the income
statement, the overall income would fall and there would be less profit available for
distribution.
ix. The items which forms a part of the other comprehensive income statement include
hedging gains and losses, actuarial gains and losses, the income and losses on fair valuation
of assets and liabilities all of which is not related to normal business operation and hence no
person can be made directly responsible for the same and hence it should not be included in
evaluation criteria for managers (Kim, et al., 2017).
Accounting for Corporate Income Tax
x. The break up of the tax expenses for both the companies has been shown below:
(Amt in US$M)
BHP Billiton - Tax Details
Particulars 2017 2016 2015
Tax Expenses 4,100 (1,052) 3,666
Effective tax Rate 39.7% 35.8% 45.5%
Cash tax paid (2,585) (2,286) (4,373)
Profit before taxation 10,322 (7,259) 8,056
Cash tax Rate -25.0% 31.5% -54.3%
Book tax rate 30.0% 30.0% 30.0%
Deferred tax assets 5788 6147 2861
Deferred tax liabilities 3765 4324 4542
(Amt in US$M)
South 32 - Tax details
Particulars 2017 2016 2015
Tax Expenses 393 70 528
Effective tax Rate 30.7% 36.6% 32.0%
Cash tax paid (127) (52) 1
11 | P a g e
⊘ This is a preview!⊘
Do you want full access?
Subscribe today to unlock all pages.
Trusted by 1+ million students worldwide
1 out of 15
Related Documents


Your All-in-One AI-Powered Toolkit for Academic Success.
+13062052269
info@desklib.com
Available 24*7 on WhatsApp / Email
![[object Object]](/_next/static/media/star-bottom.7253800d.svg)
Unlock your academic potential
Copyright © 2020–2026 A2Z Services. All Rights Reserved. Developed and managed by ZUCOL.