Corporate Accounting Solutions - Finance Module Assignment, Semester 1

Verified

Added on  2020/05/08

|11
|1820
|239
Homework Assignment
AI Summary
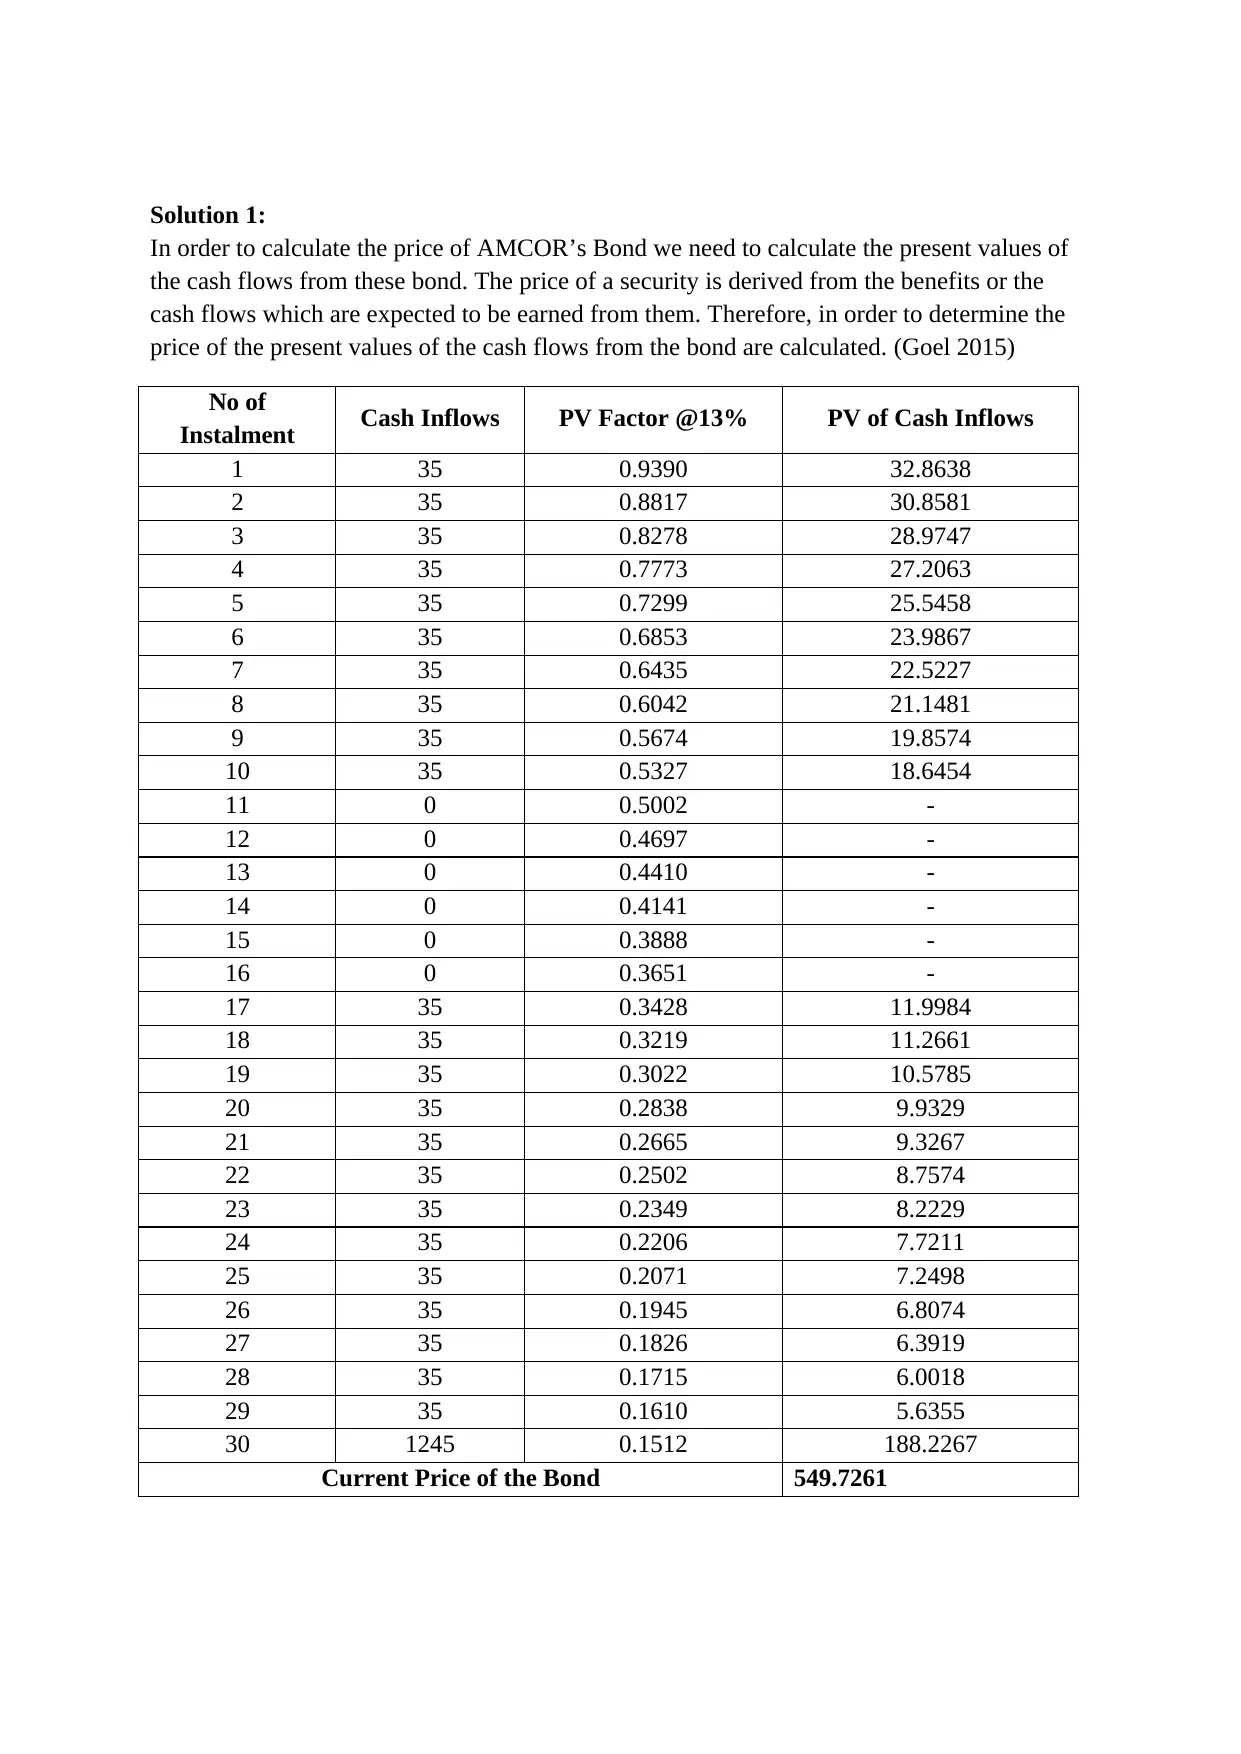
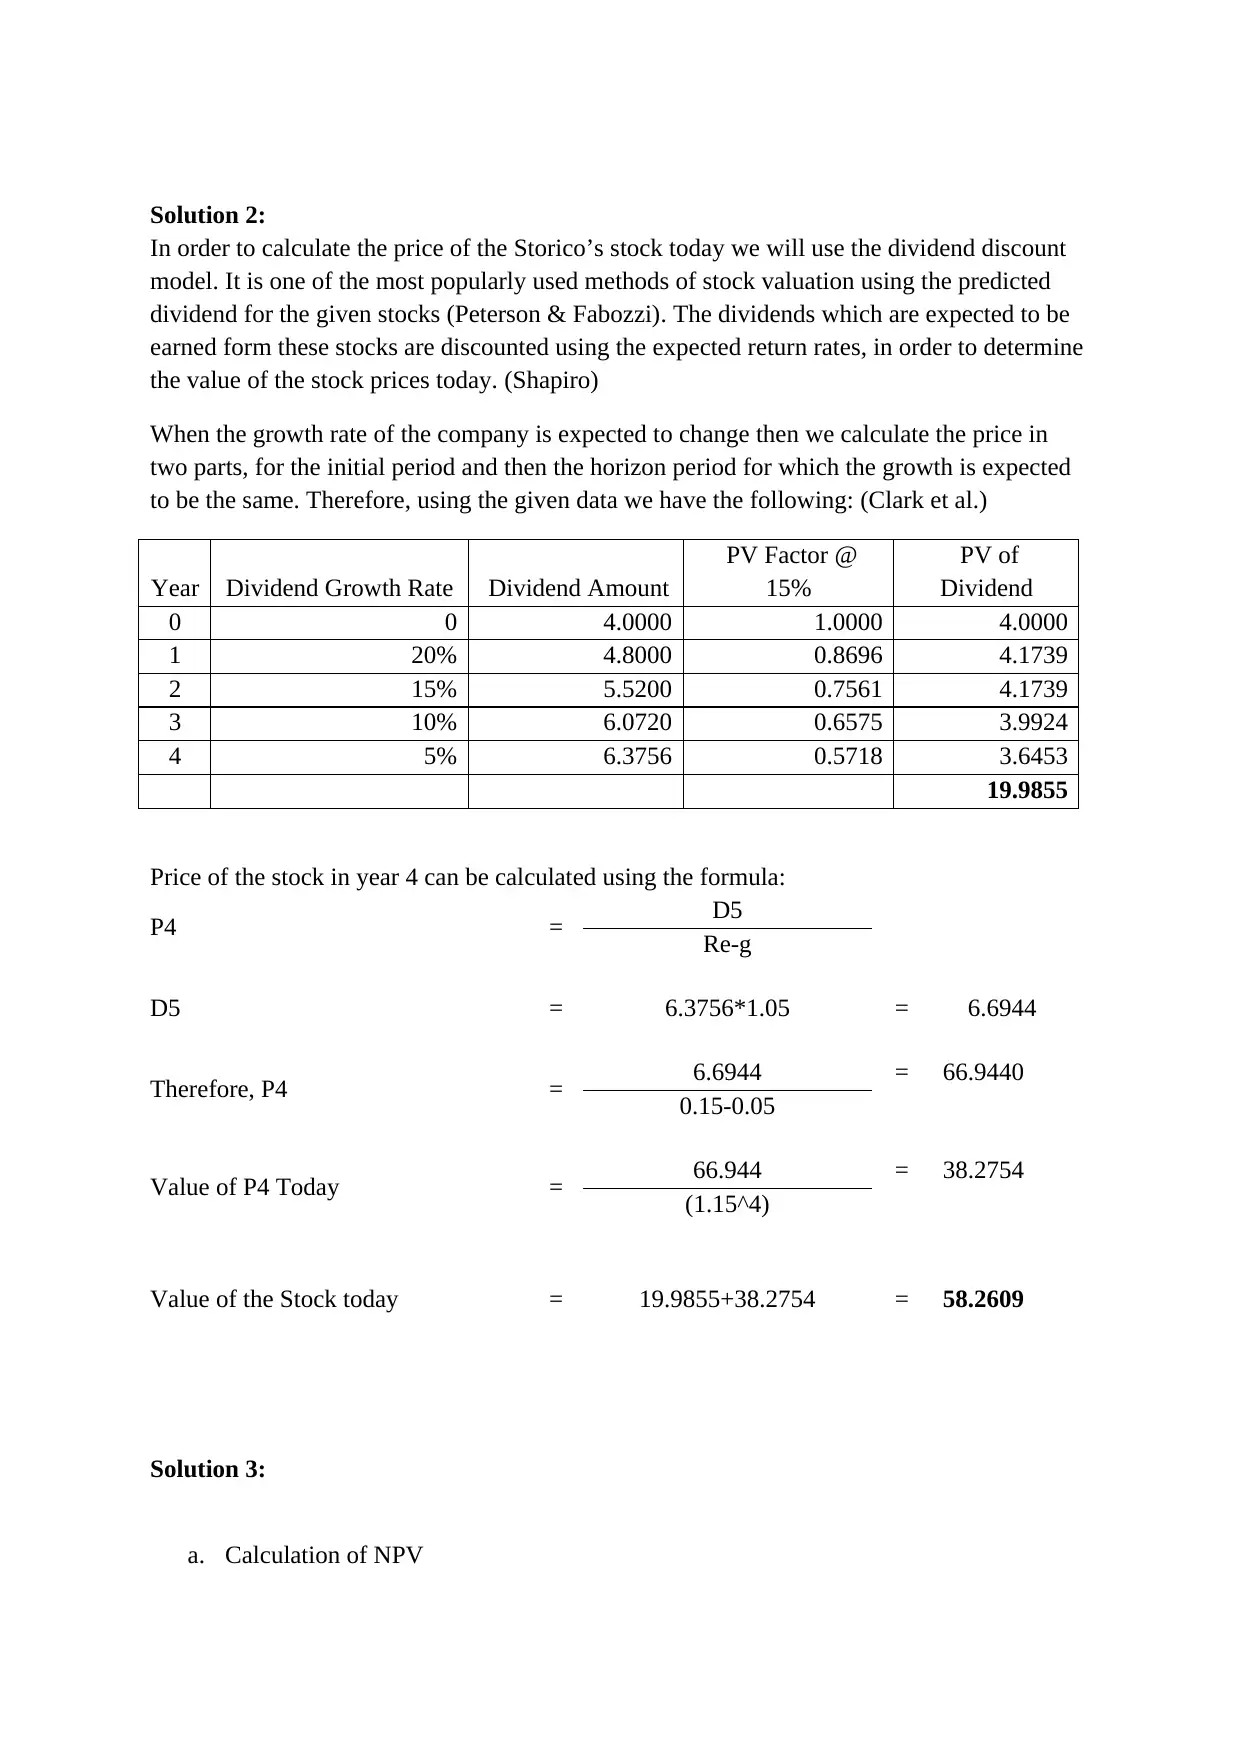
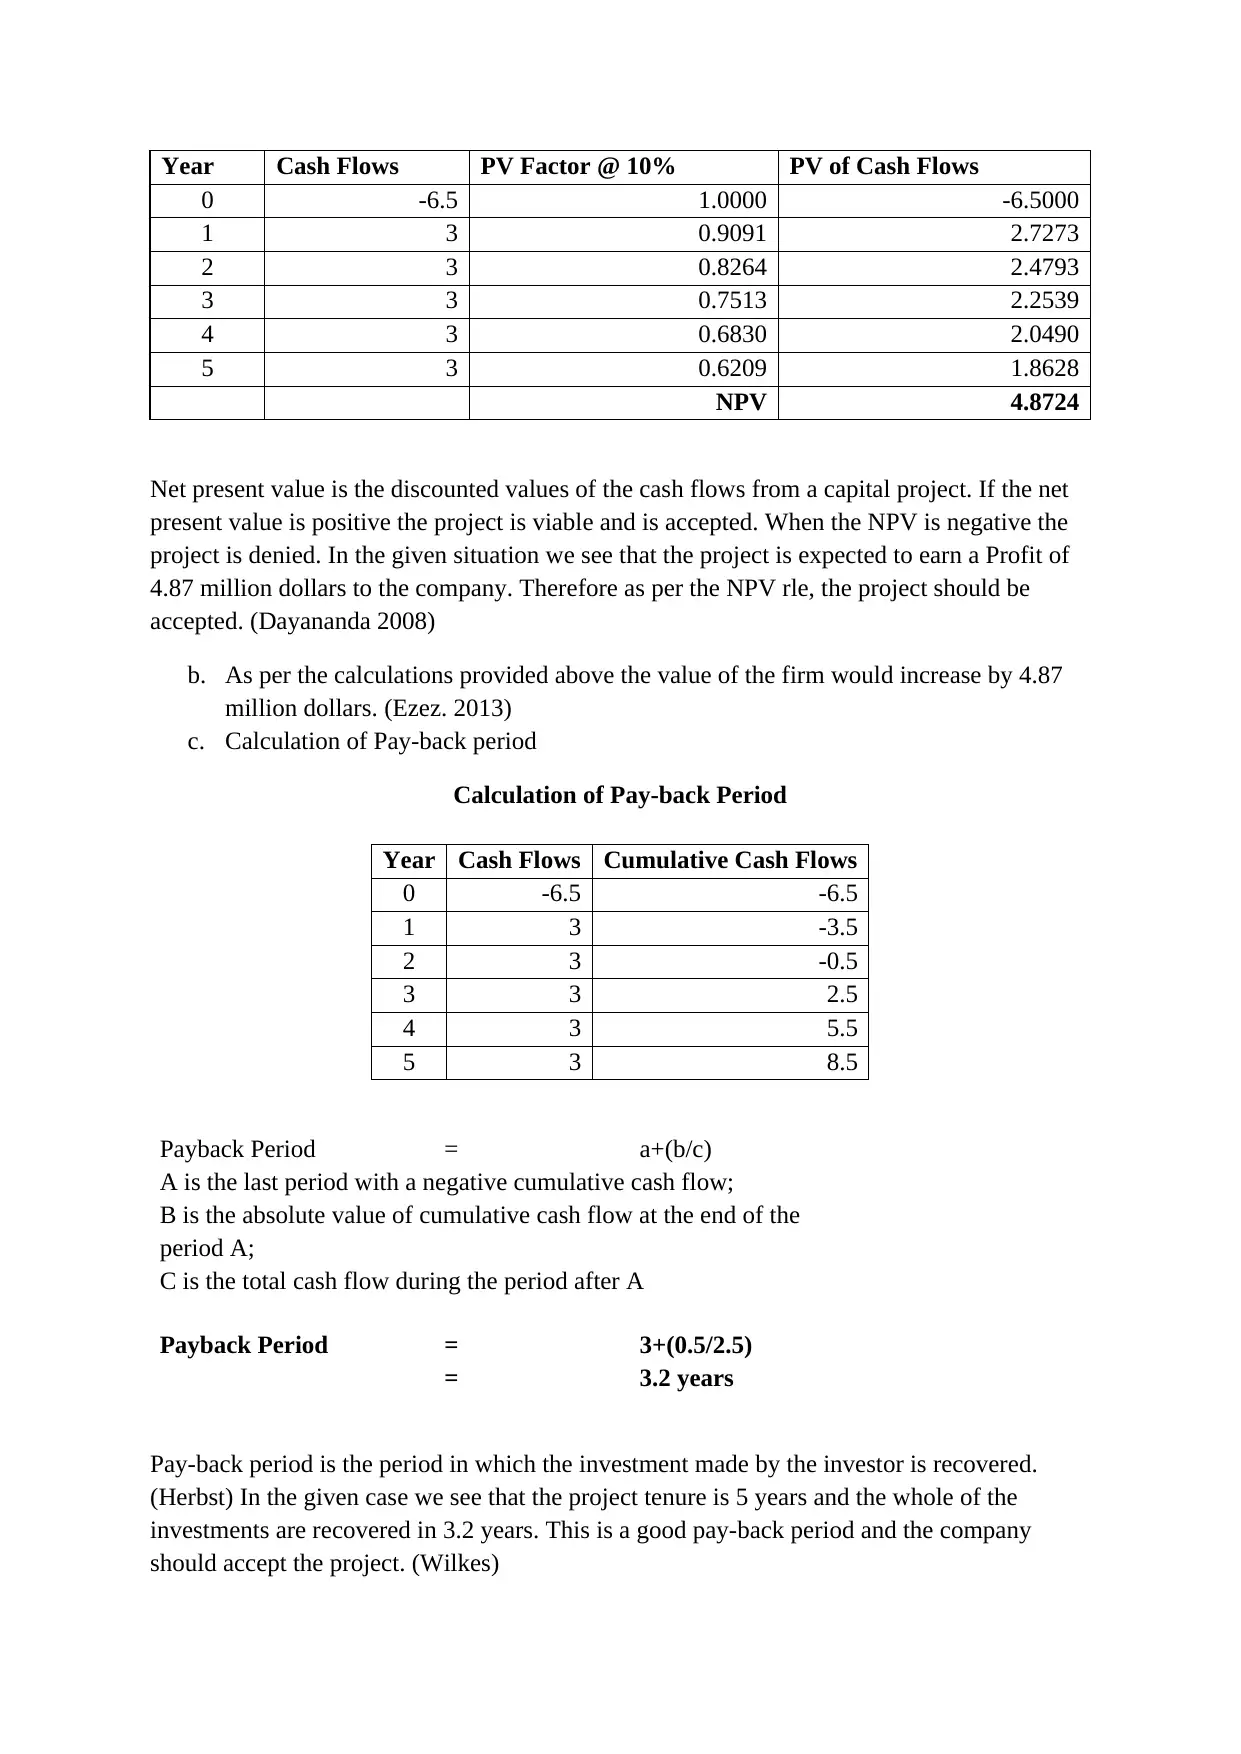
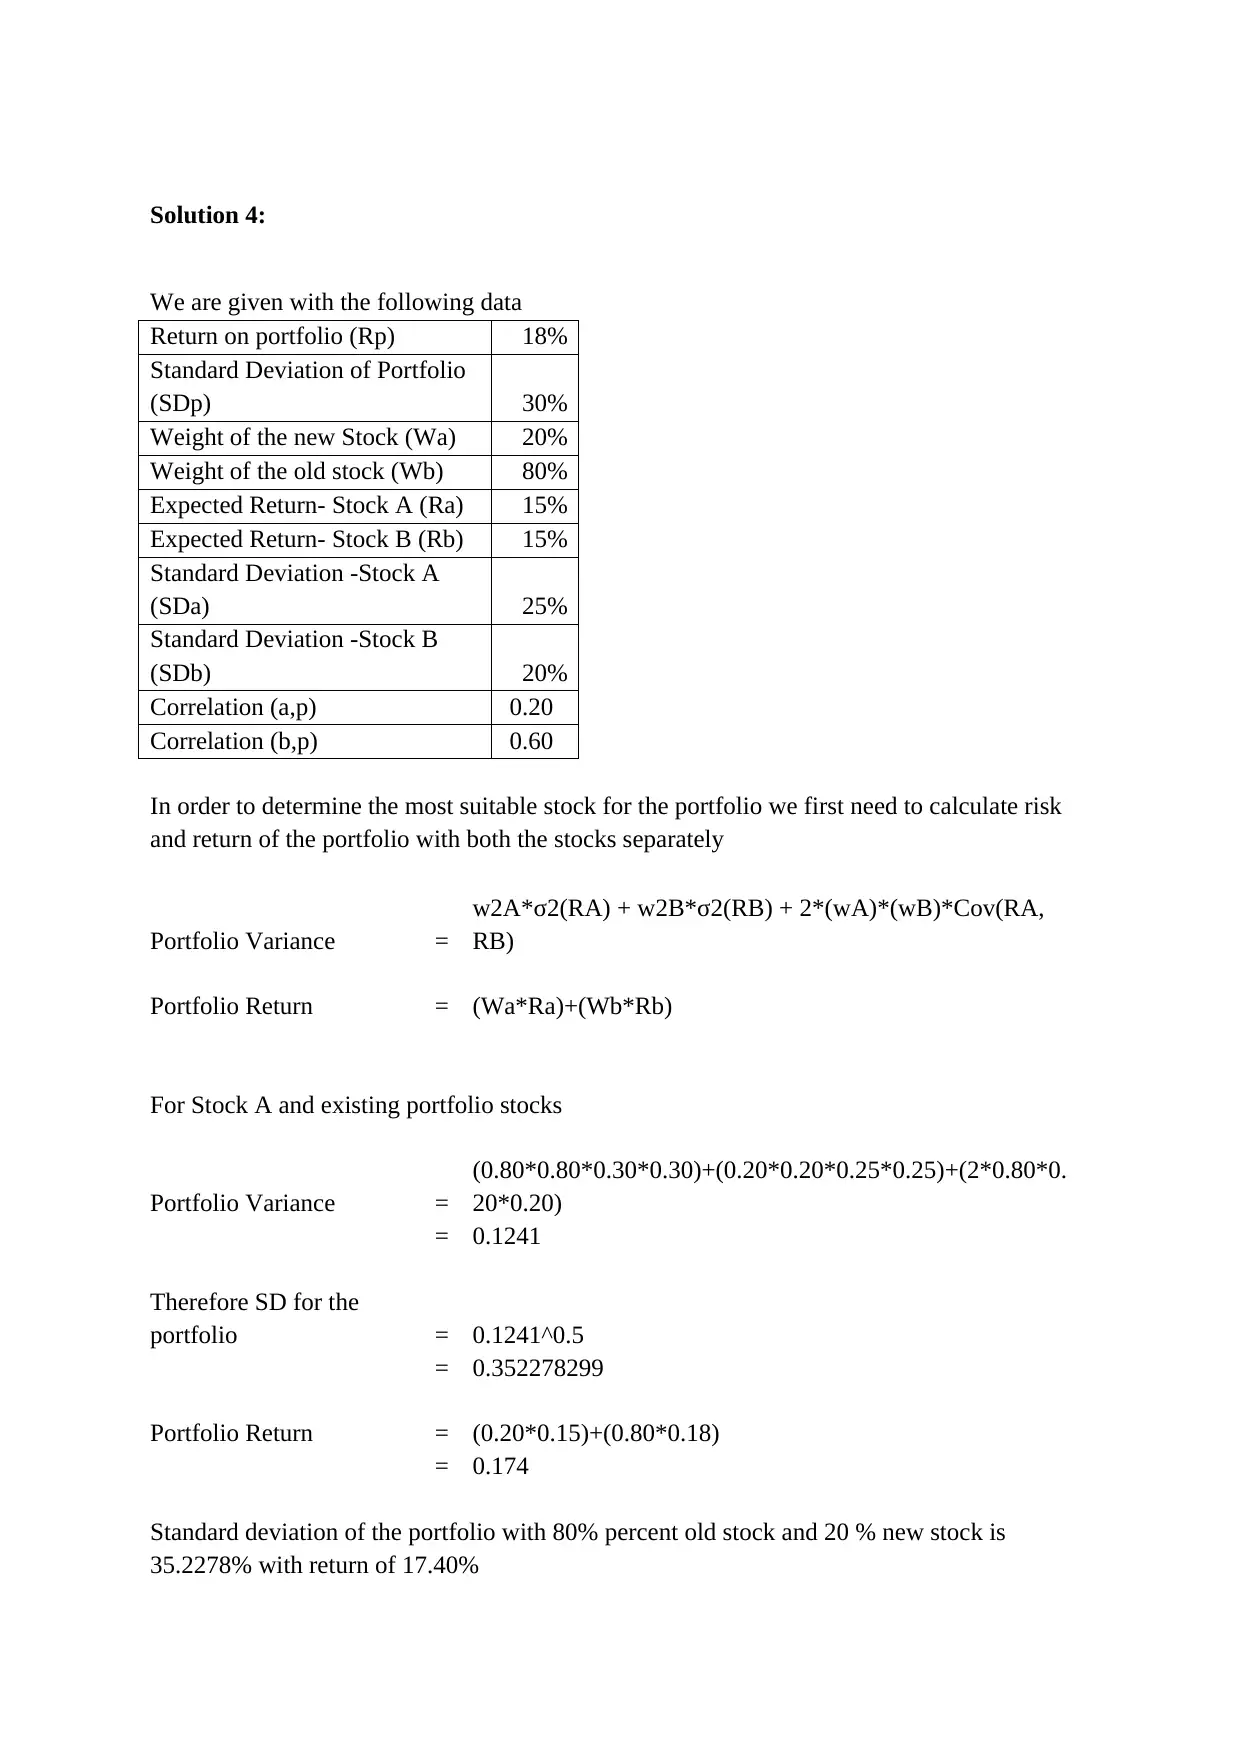
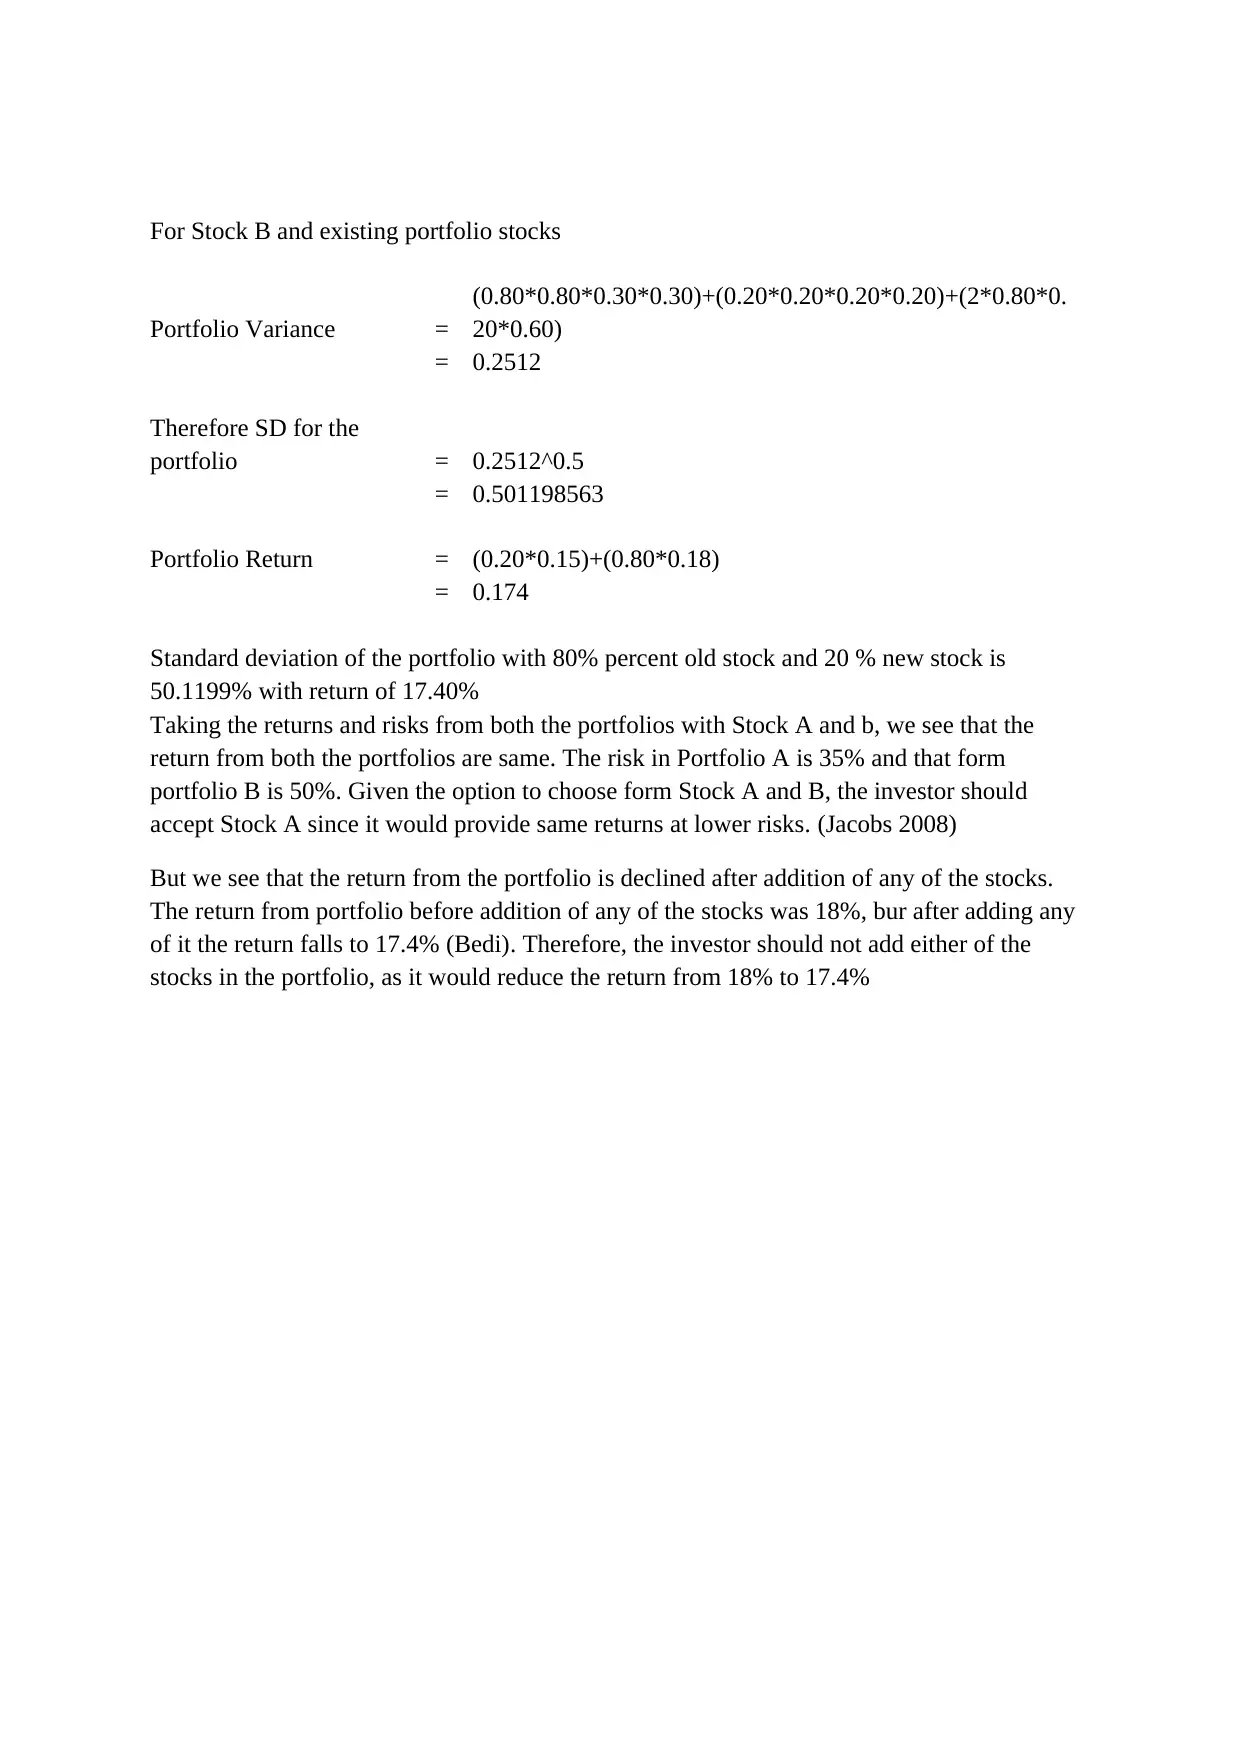
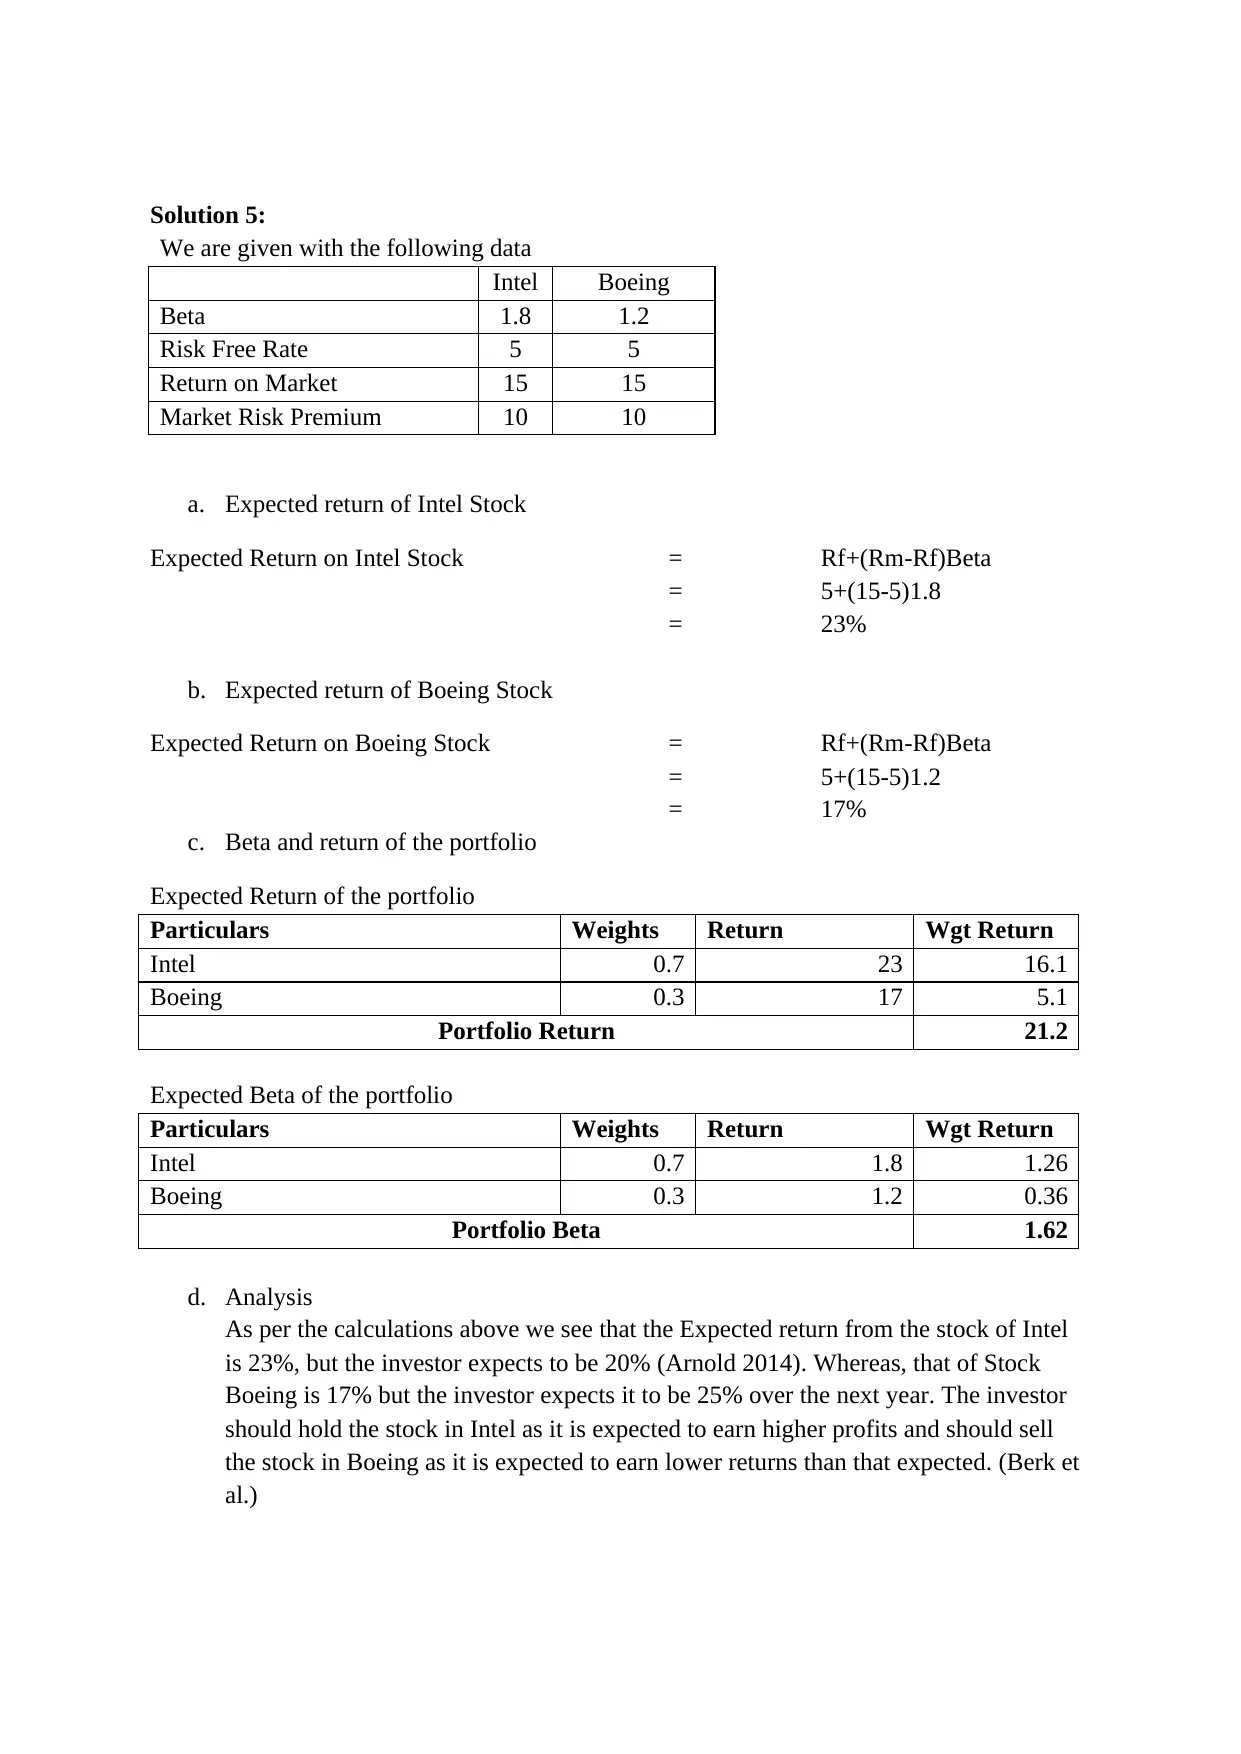
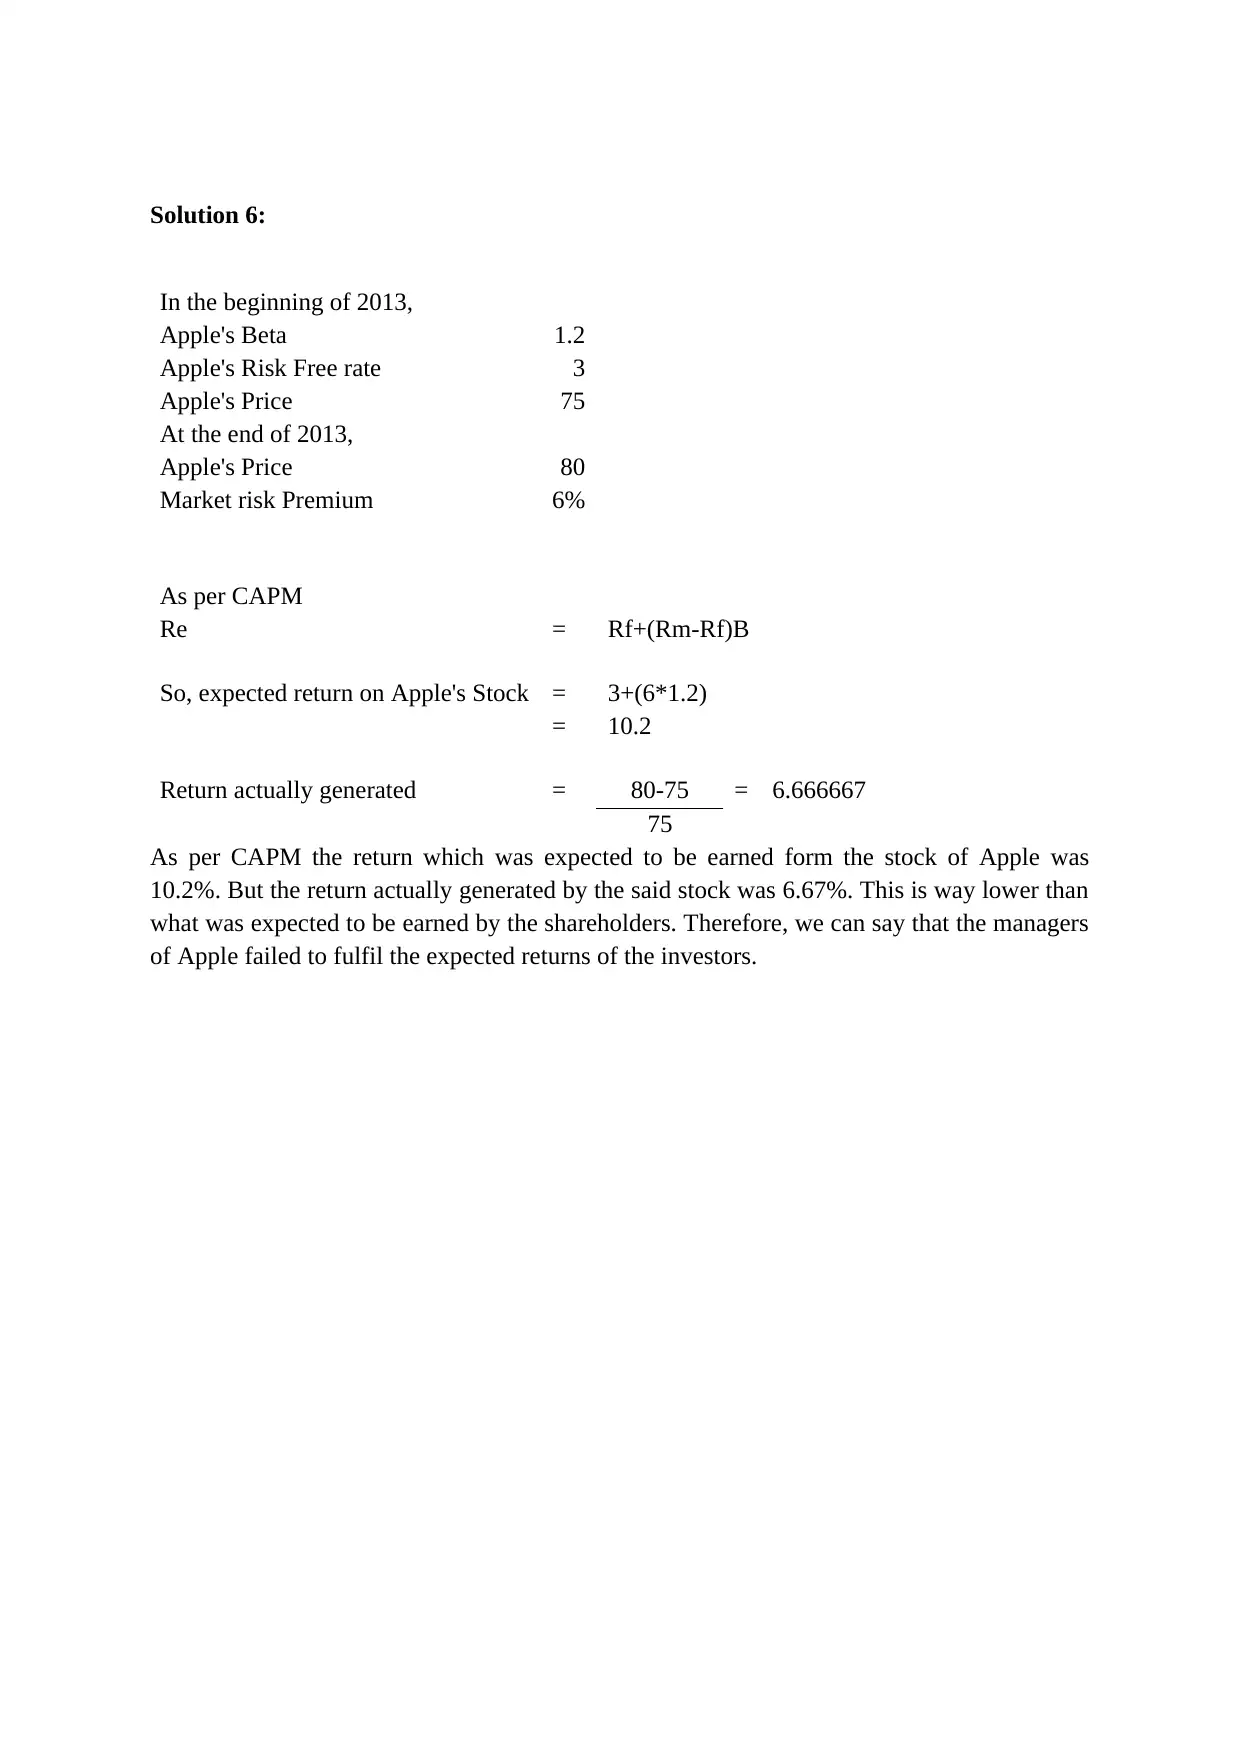
This document presents a comprehensive solution to a corporate accounting assignment, addressing various financial concepts and calculations. The solutions begin with bond valuation, determining the current price based on discounted cash flows. Next, it delves into stock valuation using the dividend discount model, considering different growth rates and present values. The assignment then proceeds to calculate the Net Present Value (NPV) of a capital project, alongside a payback period analysis, to assess its financial viability. Furthermore, the document explores portfolio management, calculating risk and return for different stock combinations to determine the optimal investment strategy. Finally, it applies the Capital Asset Pricing Model (CAPM) to determine expected returns and evaluate managerial performance in relation to investor expectations. The assignment utilizes provided data, formulas, and references to support the financial analysis and recommendations.
Document Page
CORPORATE
ACCOUNTING
tabler-icon-diamond-filled.svg

Paraphrase This Document

Need a fresh take? Get an instant paraphrase of this document with our AI Paraphraser
Document Page
Contents
Solution 1:..................................................................................................................................3
Solution 2:..................................................................................................................................5
Solution 3:..................................................................................................................................6
Solution 4:..................................................................................................................................8
Solution 5:................................................................................................................................10
Solution 6:................................................................................................................................12
Document Page
Solution 1:
In order to calculate the price of AMCOR’s Bond we need to calculate the present values of
the cash flows from these bond. The price of a security is derived from the benefits or the
cash flows which are expected to be earned from them. Therefore, in order to determine the
price of the present values of the cash flows from the bond are calculated. (Goel 2015)
No of
Instalment Cash Inflows PV Factor @13% PV of Cash Inflows
1 35 0.9390 32.8638
2 35 0.8817 30.8581
3 35 0.8278 28.9747
4 35 0.7773 27.2063
5 35 0.7299 25.5458
6 35 0.6853 23.9867
7 35 0.6435 22.5227
8 35 0.6042 21.1481
9 35 0.5674 19.8574
10 35 0.5327 18.6454
11 0 0.5002 -
12 0 0.4697 -
13 0 0.4410 -
14 0 0.4141 -
15 0 0.3888 -
16 0 0.3651 -
17 35 0.3428 11.9984
18 35 0.3219 11.2661
19 35 0.3022 10.5785
20 35 0.2838 9.9329
21 35 0.2665 9.3267
22 35 0.2502 8.7574
23 35 0.2349 8.2229
24 35 0.2206 7.7211
25 35 0.2071 7.2498
26 35 0.1945 6.8074
27 35 0.1826 6.3919
28 35 0.1715 6.0018
29 35 0.1610 5.6355
30 1245 0.1512 188.2267
Current Price of the Bond 549.7261
Document Page
Therefore, the price of the bond currently trading in the market should be Approximately
$550.
tabler-icon-diamond-filled.svg

Paraphrase This Document

Need a fresh take? Get an instant paraphrase of this document with our AI Paraphraser
Document Page
Solution 2:
In order to calculate the price of the Storico’s stock today we will use the dividend discount
model. It is one of the most popularly used methods of stock valuation using the predicted
dividend for the given stocks (Peterson & Fabozzi). The dividends which are expected to be
earned form these stocks are discounted using the expected return rates, in order to determine
the value of the stock prices today. (Shapiro)
When the growth rate of the company is expected to change then we calculate the price in
two parts, for the initial period and then the horizon period for which the growth is expected
to be the same. Therefore, using the given data we have the following: (Clark et al.)
Year Dividend Growth Rate Dividend Amount
PV Factor @
15%
PV of
Dividend
0 0 4.0000 1.0000 4.0000
1 20% 4.8000 0.8696 4.1739
2 15% 5.5200 0.7561 4.1739
3 10% 6.0720 0.6575 3.9924
4 5% 6.3756 0.5718 3.6453
19.9855
Price of the stock in year 4 can be calculated using the formula:
P4 = D5
Re-g
D5 = 6.3756*1.05 = 6.6944
Therefore, P4 = 6.6944 = 66.9440
0.15-0.05
Value of P4 Today = 66.944 = 38.2754
(1.15^4)
Value of the Stock today = 19.9855+38.2754 = 58.2609
Solution 3:
a. Calculation of NPV
Document Page
Year Cash Flows PV Factor @ 10% PV of Cash Flows
0 -6.5 1.0000 -6.5000
1 3 0.9091 2.7273
2 3 0.8264 2.4793
3 3 0.7513 2.2539
4 3 0.6830 2.0490
5 3 0.6209 1.8628
NPV 4.8724
Net present value is the discounted values of the cash flows from a capital project. If the net
present value is positive the project is viable and is accepted. When the NPV is negative the
project is denied. In the given situation we see that the project is expected to earn a Profit of
4.87 million dollars to the company. Therefore as per the NPV rle, the project should be
accepted. (Dayananda 2008)
b. As per the calculations provided above the value of the firm would increase by 4.87
million dollars. (Ezez. 2013)
c. Calculation of Pay-back period
Calculation of Pay-back Period
Year Cash Flows Cumulative Cash Flows
0 -6.5 -6.5
1 3 -3.5
2 3 -0.5
3 3 2.5
4 3 5.5
5 3 8.5
Payback Period = a+(b/c)
A is the last period with a negative cumulative cash flow;
B is the absolute value of cumulative cash flow at the end of the
period A;
C is the total cash flow during the period after A
Payback Period = 3+(0.5/2.5)
= 3.2 years
Pay-back period is the period in which the investment made by the investor is recovered.
(Herbst) In the given case we see that the project tenure is 5 years and the whole of the
investments are recovered in 3.2 years. This is a good pay-back period and the company
should accept the project. (Wilkes)
Document Page
Solution 4:
We are given with the following data
Return on portfolio (Rp) 18%
Standard Deviation of Portfolio
(SDp) 30%
Weight of the new Stock (Wa) 20%
Weight of the old stock (Wb) 80%
Expected Return- Stock A (Ra) 15%
Expected Return- Stock B (Rb) 15%
Standard Deviation -Stock A
(SDa) 25%
Standard Deviation -Stock B
(SDb) 20%
Correlation (a,p) 0.20
Correlation (b,p) 0.60
In order to determine the most suitable stock for the portfolio we first need to calculate risk
and return of the portfolio with both the stocks separately
Portfolio Variance =
w2A*σ2(RA) + w2B*σ2(RB) + 2*(wA)*(wB)*Cov(RA,
RB)
Portfolio Return = (Wa*Ra)+(Wb*Rb)
For Stock A and existing portfolio stocks
Portfolio Variance =
(0.80*0.80*0.30*0.30)+(0.20*0.20*0.25*0.25)+(2*0.80*0.
20*0.20)
= 0.1241
Therefore SD for the
portfolio = 0.1241^0.5
= 0.352278299
Portfolio Return = (0.20*0.15)+(0.80*0.18)
= 0.174
Standard deviation of the portfolio with 80% percent old stock and 20 % new stock is
35.2278% with return of 17.40%
tabler-icon-diamond-filled.svg

Paraphrase This Document

Need a fresh take? Get an instant paraphrase of this document with our AI Paraphraser
Document Page
For Stock B and existing portfolio stocks
Portfolio Variance =
(0.80*0.80*0.30*0.30)+(0.20*0.20*0.20*0.20)+(2*0.80*0.
20*0.60)
= 0.2512
Therefore SD for the
portfolio = 0.2512^0.5
= 0.501198563
Portfolio Return = (0.20*0.15)+(0.80*0.18)
= 0.174
Standard deviation of the portfolio with 80% percent old stock and 20 % new stock is
50.1199% with return of 17.40%
Taking the returns and risks from both the portfolios with Stock A and b, we see that the
return from both the portfolios are same. The risk in Portfolio A is 35% and that form
portfolio B is 50%. Given the option to choose form Stock A and B, the investor should
accept Stock A since it would provide same returns at lower risks. (Jacobs 2008)
But we see that the return from the portfolio is declined after addition of any of the stocks.
The return from portfolio before addition of any of the stocks was 18%, bur after adding any
of it the return falls to 17.4% (Bedi). Therefore, the investor should not add either of the
stocks in the portfolio, as it would reduce the return from 18% to 17.4%
Document Page
Solution 5:
We are given with the following data
Intel Boeing
Beta 1.8 1.2
Risk Free Rate 5 5
Return on Market 15 15
Market Risk Premium 10 10
a. Expected return of Intel Stock
Expected Return on Intel Stock = Rf+(Rm-Rf)Beta
= 5+(15-5)1.8
= 23%
b. Expected return of Boeing Stock
Expected Return on Boeing Stock = Rf+(Rm-Rf)Beta
= 5+(15-5)1.2
= 17%
c. Beta and return of the portfolio
Expected Return of the portfolio
Particulars Weights Return Wgt Return
Intel 0.7 23 16.1
Boeing 0.3 17 5.1
Portfolio Return 21.2
Expected Beta of the portfolio
Particulars Weights Return Wgt Return
Intel 0.7 1.8 1.26
Boeing 0.3 1.2 0.36
Portfolio Beta 1.62
d. Analysis
As per the calculations above we see that the Expected return from the stock of Intel
is 23%, but the investor expects to be 20% (Arnold 2014). Whereas, that of Stock
Boeing is 17% but the investor expects it to be 25% over the next year. The investor
should hold the stock in Intel as it is expected to earn higher profits and should sell
the stock in Boeing as it is expected to earn lower returns than that expected. (Berk et
al.)
Document Page
tabler-icon-diamond-filled.svg

Paraphrase This Document

Need a fresh take? Get an instant paraphrase of this document with our AI Paraphraser
Document Page
Solution 6:
In the beginning of 2013,
Apple's Beta 1.2
Apple's Risk Free rate 3
Apple's Price 75
At the end of 2013,
Apple's Price 80
Market risk Premium 6%
As per CAPM
Re = Rf+(Rm-Rf)B
So, expected return on Apple's Stock = 3+(6*1.2)
= 10.2
Return actually generated = 80-75 = 6.666667
75
As per CAPM the return which was expected to be earned form the stock of Apple was
10.2%. But the return actually generated by the said stock was 6.67%. This is way lower than
what was expected to be earned by the shareholders. Therefore, we can say that the managers
of Apple failed to fulfil the expected returns of the investors.
chevron_up_icon
1 out of 11
circle_padding
hide_on_mobile
zoom_out_icon
[object Object]