Corporate Accounting Report: Adelaide Brighton and Alumina Analysis
VerifiedAdded on 2022/10/17
|16
|2922
|16
Report
AI Summary
This report undertakes a comparative analysis of the financial performance of Adelaide Brighton Ltd and Alumina Ltd, both listed on the ASX, over a three-year period. The analysis focuses on the movement of items within the balance sheet, specifically examining owners' equity and liabilities. The report details the components of owners' equity (share capital, reserves, retained earnings) and liabilities (trade payables, borrowings, provisions, etc.) for both companies, explaining the trends and fluctuations in these items. The advantages and disadvantages of each company's sources of funding are also assessed. Furthermore, the report provides a critical examination of the concepts of small proprietary companies, large proprietary companies, and reporting entities, including the implications of each classification. The report concludes with a summary of the key findings and insights derived from the financial analysis and entity classifications.
Running head: CORPORATE ACCOUNTING
Corporate Accounting
Name of the Student
Name of the University
Authors Note
Course ID
Corporate Accounting
Name of the Student
Name of the University
Authors Note
Course ID
Paraphrase This Document
Need a fresh take? Get an instant paraphrase of this document with our AI Paraphraser
1CORPORATE ACCOUNTING
Executive Summary:
The report here focuses on companies taken from the materials sector. The companies
selected in this report is Adelaide Brighton Ltd and Alumina Ltd that are listed in the top 200
of the ASX. The report would consider the last three years’ period of both the companies to
understand the movement of its balance sheet items. Apart from this, a critical examination of
the concepts of small proprietary firm, large proprietary firm and reporting entity will be also
considered as well. The financial performance of the both the companies along with the
movement in the owners’ equity and liabilities will also be considered as well.
2CORPORATE ACCOUNTING
Table of Contents
Introduction:...............................................................................................................................4
Part A:........................................................................................................................................4
Items recorded under owners’ equity section:.......................................................................4
Movement of each item under owner equity:........................................................................7
Items recorded under liabilities section:................................................................................7
Movements in each item recorded in liabilities section:........................................................9
Advantage or disadvantage of sources of fund:...................................................................10
Part B:.......................................................................................................................................11
Critical examination of concepts of small proprietary company, large proprietary company
and reporting entity:.............................................................................................................11
Implications of being classified as any one of the companies:............................................12
Conclusion:..............................................................................................................................13
References:...............................................................................................................................14
⊘ This is a preview!⊘
Do you want full access?
Subscribe today to unlock all pages.
Trusted by 1+ million students worldwide
3CORPORATE ACCOUNTING
Introduction:
Corporate accounting is regarded as the special branch of accounting that is associated
with the bookkeeping for businesses, preparing the financial accounts and the cash flow
reports. The corporate accounting is also associated with the analysis, interpretation of the
businesses financial outcomes and preparing the consolidated balance sheets (Williams and
Dobelman 2017). The corporate accounting facilitates the comparative analysis of the
financial statement that provides the users with the information for assessing the change in
direction of business. The financial performance is viewed as measuring the overall financial
condition of the company over the given time period.
The present report is based on two ASX listed companies namely the Adelaide
Brighton Ltd, Alumina Ltd. The report would consider the last three years’ period of both the
companies to understand the movement of its balance sheet items. Apart from this, a critical
examination of the concepts of small proprietary firm, large proprietary firm and reporting
entity will be also considered as well.
Part A:
Items recorded under owners’ equity section:
The owners’ equity is viewed as investment of the owner’s in their business less the
owner’s withdrawal from the business plus the total amount of net income from the time
when the business commenced (Crowther 2018). It is regarded as one of the three main
sections of an organization’s balance sheet. It mainly comprises of equity capital, general
reserve and retained earnings.
Adelaide Brighton –
Paraphrase This Document
Need a fresh take? Get an instant paraphrase of this document with our AI Paraphraser
4CORPORATE ACCOUNTING
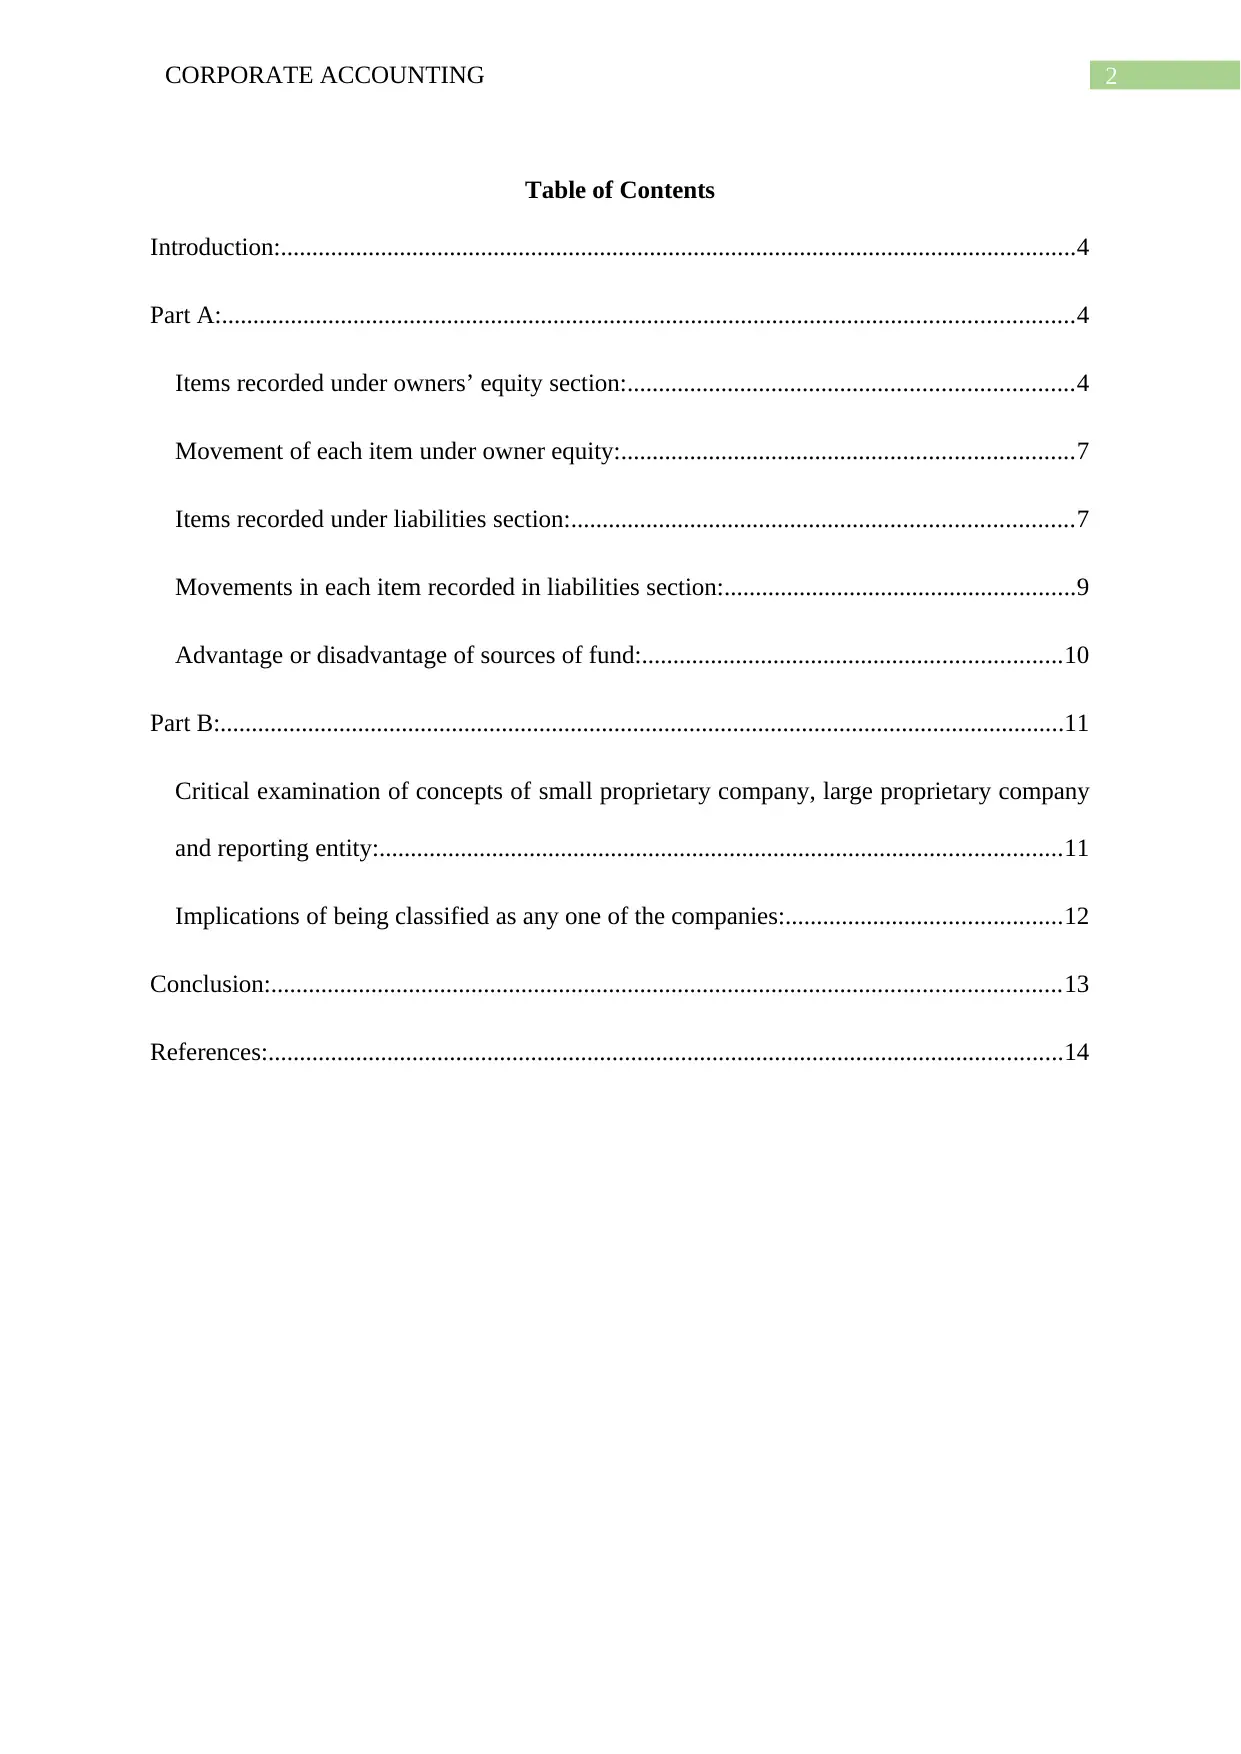
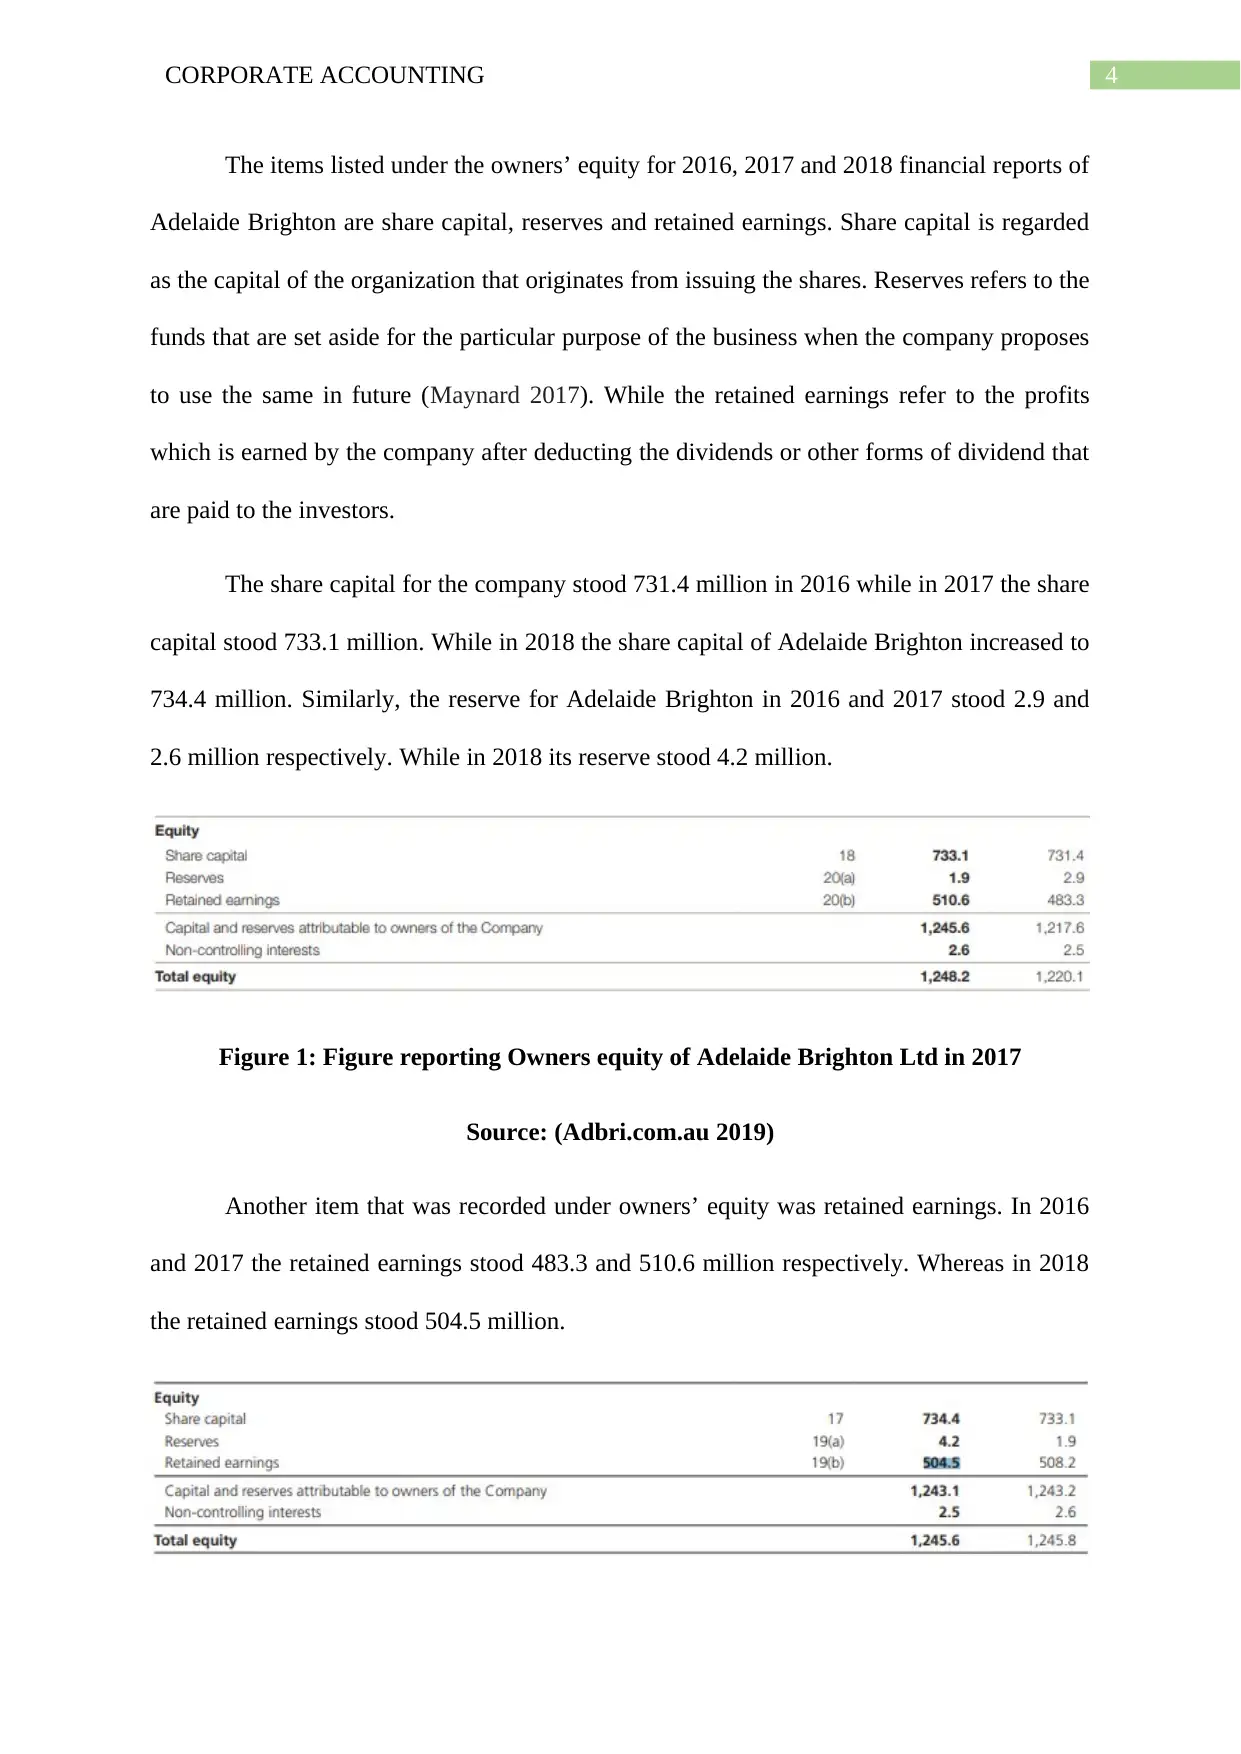
The items listed under the owners’ equity for 2016, 2017 and 2018 financial reports of
Adelaide Brighton are share capital, reserves and retained earnings. Share capital is regarded
as the capital of the organization that originates from issuing the shares. Reserves refers to the
funds that are set aside for the particular purpose of the business when the company proposes
to use the same in future (Maynard 2017). While the retained earnings refer to the profits
which is earned by the company after deducting the dividends or other forms of dividend that
are paid to the investors.
The share capital for the company stood 731.4 million in 2016 while in 2017 the share
capital stood 733.1 million. While in 2018 the share capital of Adelaide Brighton increased to
734.4 million. Similarly, the reserve for Adelaide Brighton in 2016 and 2017 stood 2.9 and
2.6 million respectively. While in 2018 its reserve stood 4.2 million.
Figure 1: Figure reporting Owners equity of Adelaide Brighton Ltd in 2017
Source: (Adbri.com.au 2019)
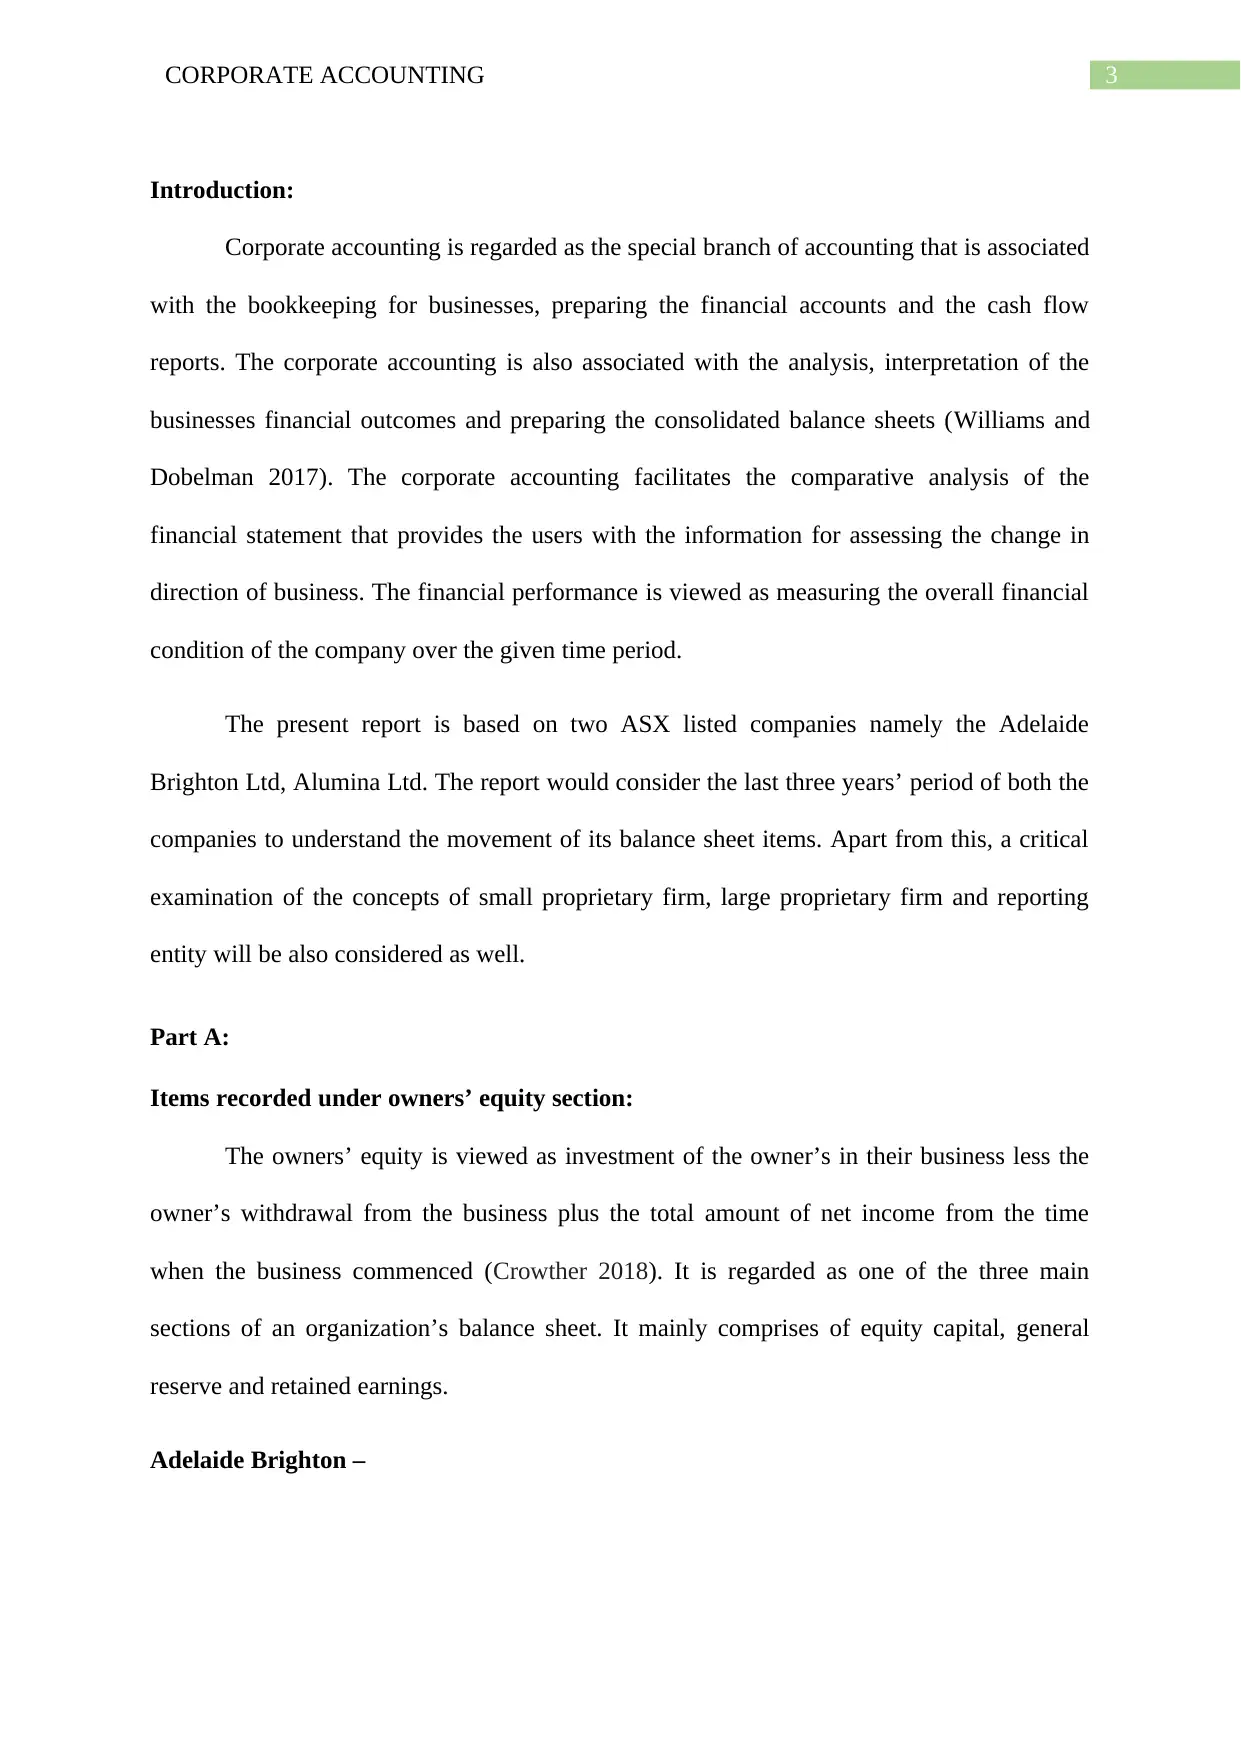
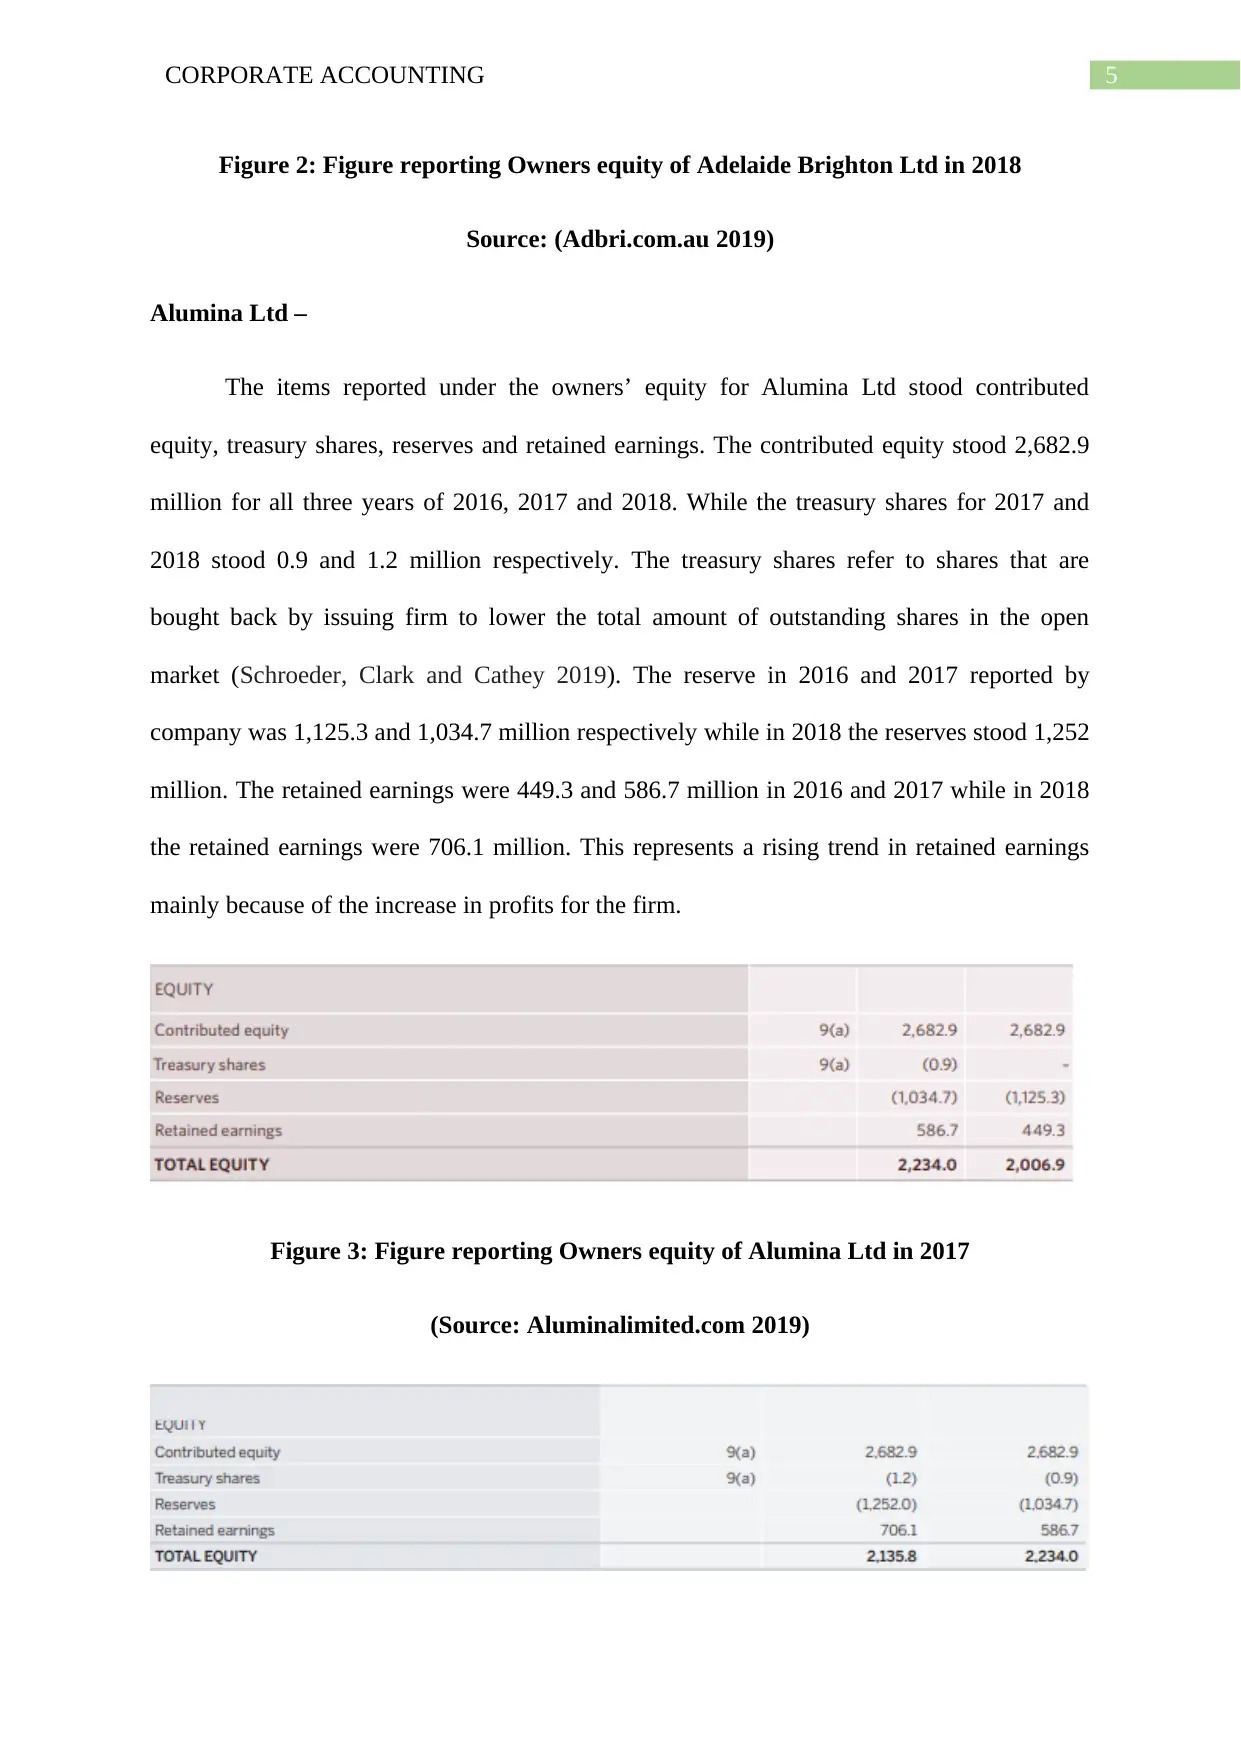
Another item that was recorded under owners’ equity was retained earnings. In 2016
and 2017 the retained earnings stood 483.3 and 510.6 million respectively. Whereas in 2018
the retained earnings stood 504.5 million.
The items listed under the owners’ equity for 2016, 2017 and 2018 financial reports of
Adelaide Brighton are share capital, reserves and retained earnings. Share capital is regarded
as the capital of the organization that originates from issuing the shares. Reserves refers to the
funds that are set aside for the particular purpose of the business when the company proposes
to use the same in future (Maynard 2017). While the retained earnings refer to the profits
which is earned by the company after deducting the dividends or other forms of dividend that
are paid to the investors.
The share capital for the company stood 731.4 million in 2016 while in 2017 the share
capital stood 733.1 million. While in 2018 the share capital of Adelaide Brighton increased to
734.4 million. Similarly, the reserve for Adelaide Brighton in 2016 and 2017 stood 2.9 and
2.6 million respectively. While in 2018 its reserve stood 4.2 million.
Figure 1: Figure reporting Owners equity of Adelaide Brighton Ltd in 2017
Source: (Adbri.com.au 2019)
Another item that was recorded under owners’ equity was retained earnings. In 2016
and 2017 the retained earnings stood 483.3 and 510.6 million respectively. Whereas in 2018
the retained earnings stood 504.5 million.
5CORPORATE ACCOUNTING
Figure 2: Figure reporting Owners equity of Adelaide Brighton Ltd in 2018
Source: (Adbri.com.au 2019)
Alumina Ltd –
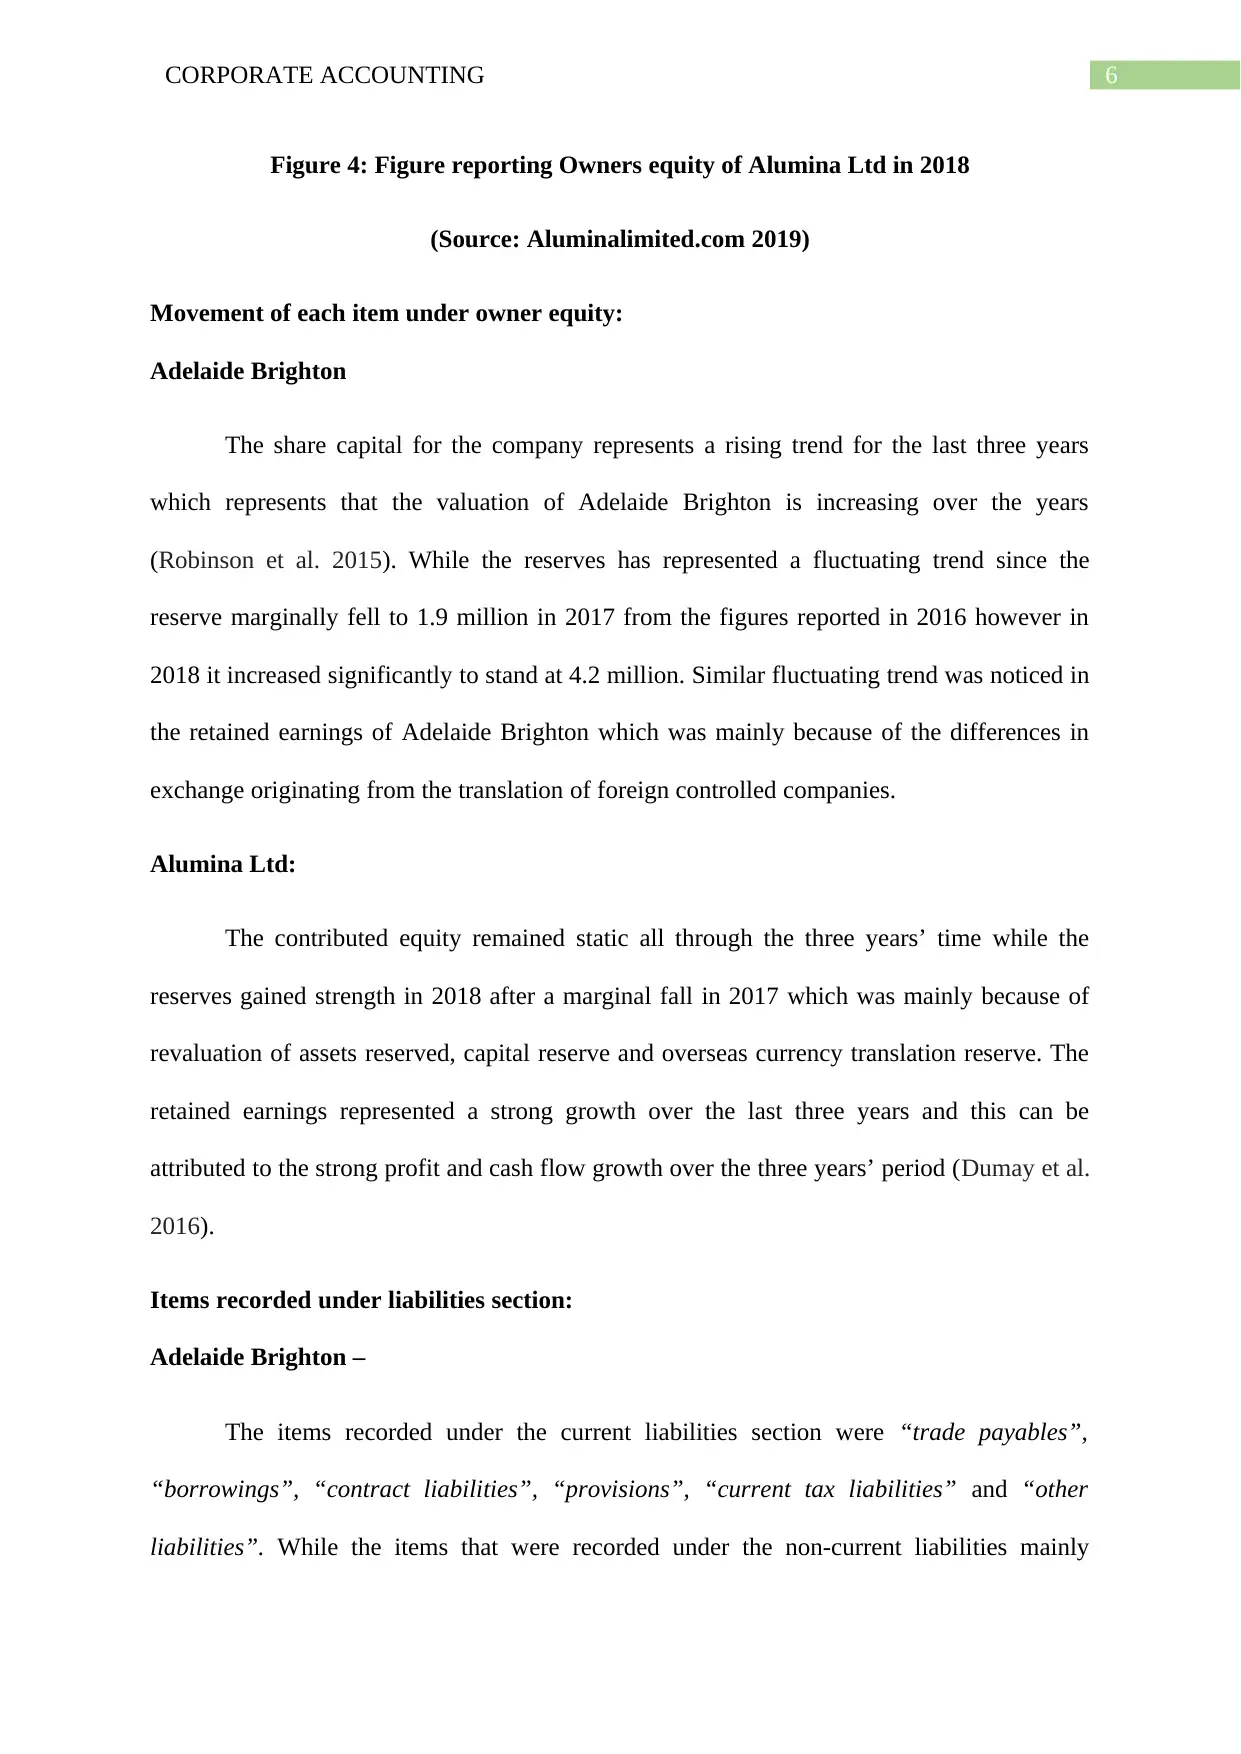
The items reported under the owners’ equity for Alumina Ltd stood contributed
equity, treasury shares, reserves and retained earnings. The contributed equity stood 2,682.9
million for all three years of 2016, 2017 and 2018. While the treasury shares for 2017 and
2018 stood 0.9 and 1.2 million respectively. The treasury shares refer to shares that are
bought back by issuing firm to lower the total amount of outstanding shares in the open
market (Schroeder, Clark and Cathey 2019). The reserve in 2016 and 2017 reported by
company was 1,125.3 and 1,034.7 million respectively while in 2018 the reserves stood 1,252
million. The retained earnings were 449.3 and 586.7 million in 2016 and 2017 while in 2018
the retained earnings were 706.1 million. This represents a rising trend in retained earnings
mainly because of the increase in profits for the firm.
Figure 3: Figure reporting Owners equity of Alumina Ltd in 2017
(Source: Aluminalimited.com 2019)
Figure 2: Figure reporting Owners equity of Adelaide Brighton Ltd in 2018
Source: (Adbri.com.au 2019)
Alumina Ltd –
The items reported under the owners’ equity for Alumina Ltd stood contributed
equity, treasury shares, reserves and retained earnings. The contributed equity stood 2,682.9
million for all three years of 2016, 2017 and 2018. While the treasury shares for 2017 and
2018 stood 0.9 and 1.2 million respectively. The treasury shares refer to shares that are
bought back by issuing firm to lower the total amount of outstanding shares in the open
market (Schroeder, Clark and Cathey 2019). The reserve in 2016 and 2017 reported by
company was 1,125.3 and 1,034.7 million respectively while in 2018 the reserves stood 1,252
million. The retained earnings were 449.3 and 586.7 million in 2016 and 2017 while in 2018
the retained earnings were 706.1 million. This represents a rising trend in retained earnings
mainly because of the increase in profits for the firm.
Figure 3: Figure reporting Owners equity of Alumina Ltd in 2017
(Source: Aluminalimited.com 2019)
⊘ This is a preview!⊘
Do you want full access?
Subscribe today to unlock all pages.
Trusted by 1+ million students worldwide
6CORPORATE ACCOUNTING
Figure 4: Figure reporting Owners equity of Alumina Ltd in 2018
(Source: Aluminalimited.com 2019)
Movement of each item under owner equity:
Adelaide Brighton
The share capital for the company represents a rising trend for the last three years
which represents that the valuation of Adelaide Brighton is increasing over the years
(Robinson et al. 2015). While the reserves has represented a fluctuating trend since the
reserve marginally fell to 1.9 million in 2017 from the figures reported in 2016 however in
2018 it increased significantly to stand at 4.2 million. Similar fluctuating trend was noticed in
the retained earnings of Adelaide Brighton which was mainly because of the differences in
exchange originating from the translation of foreign controlled companies.
Alumina Ltd:
The contributed equity remained static all through the three years’ time while the
reserves gained strength in 2018 after a marginal fall in 2017 which was mainly because of
revaluation of assets reserved, capital reserve and overseas currency translation reserve. The
retained earnings represented a strong growth over the last three years and this can be
attributed to the strong profit and cash flow growth over the three years’ period (Dumay et al.
2016).
Items recorded under liabilities section:
Adelaide Brighton –
The items recorded under the current liabilities section were “trade payables”,
“borrowings”, “contract liabilities”, “provisions”, “current tax liabilities” and “other
liabilities”. While the items that were recorded under the non-current liabilities mainly
Paraphrase This Document
Need a fresh take? Get an instant paraphrase of this document with our AI Paraphraser
7CORPORATE ACCOUNTING
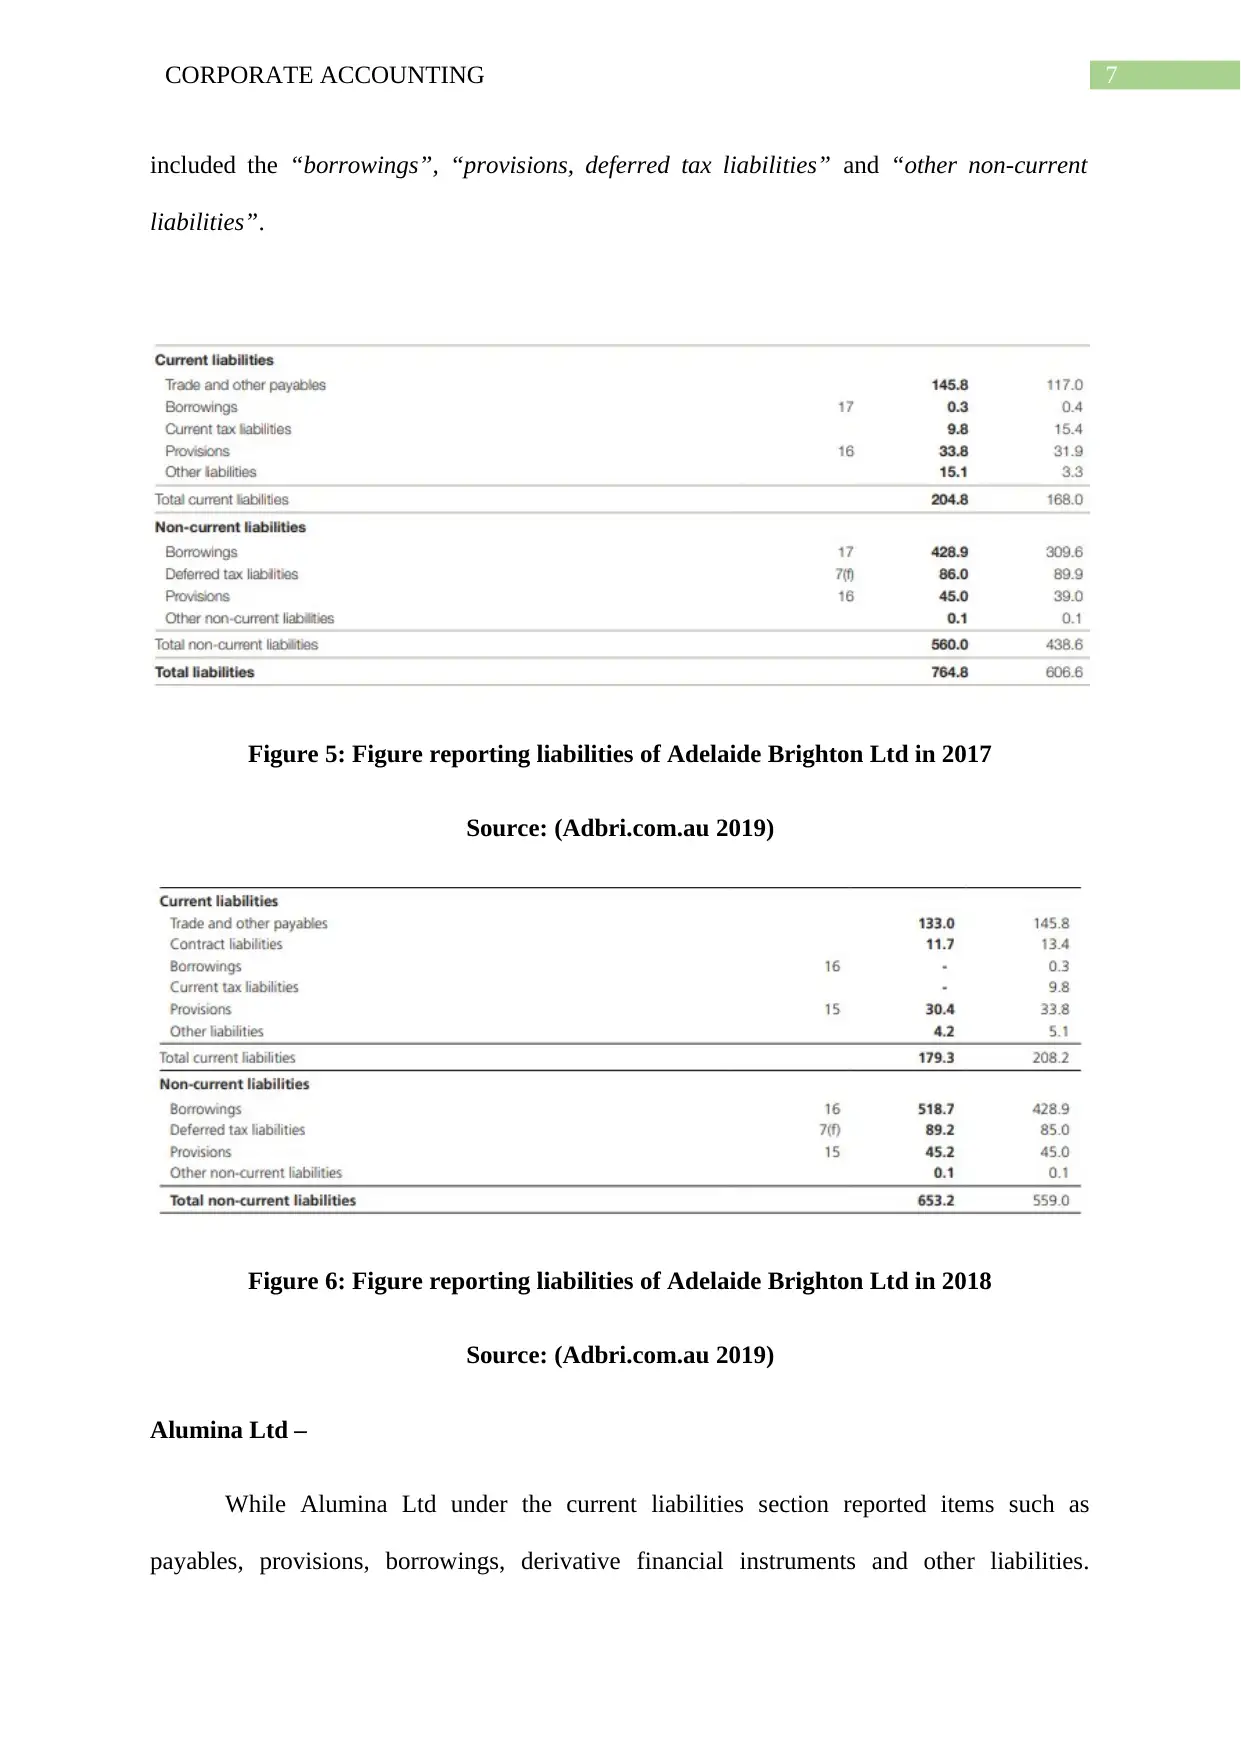
included the “borrowings”, “provisions, deferred tax liabilities” and “other non-current
liabilities”.
Figure 5: Figure reporting liabilities of Adelaide Brighton Ltd in 2017
Source: (Adbri.com.au 2019)
Figure 6: Figure reporting liabilities of Adelaide Brighton Ltd in 2018
Source: (Adbri.com.au 2019)
Alumina Ltd –
While Alumina Ltd under the current liabilities section reported items such as
payables, provisions, borrowings, derivative financial instruments and other liabilities.
8CORPORATE ACCOUNTING
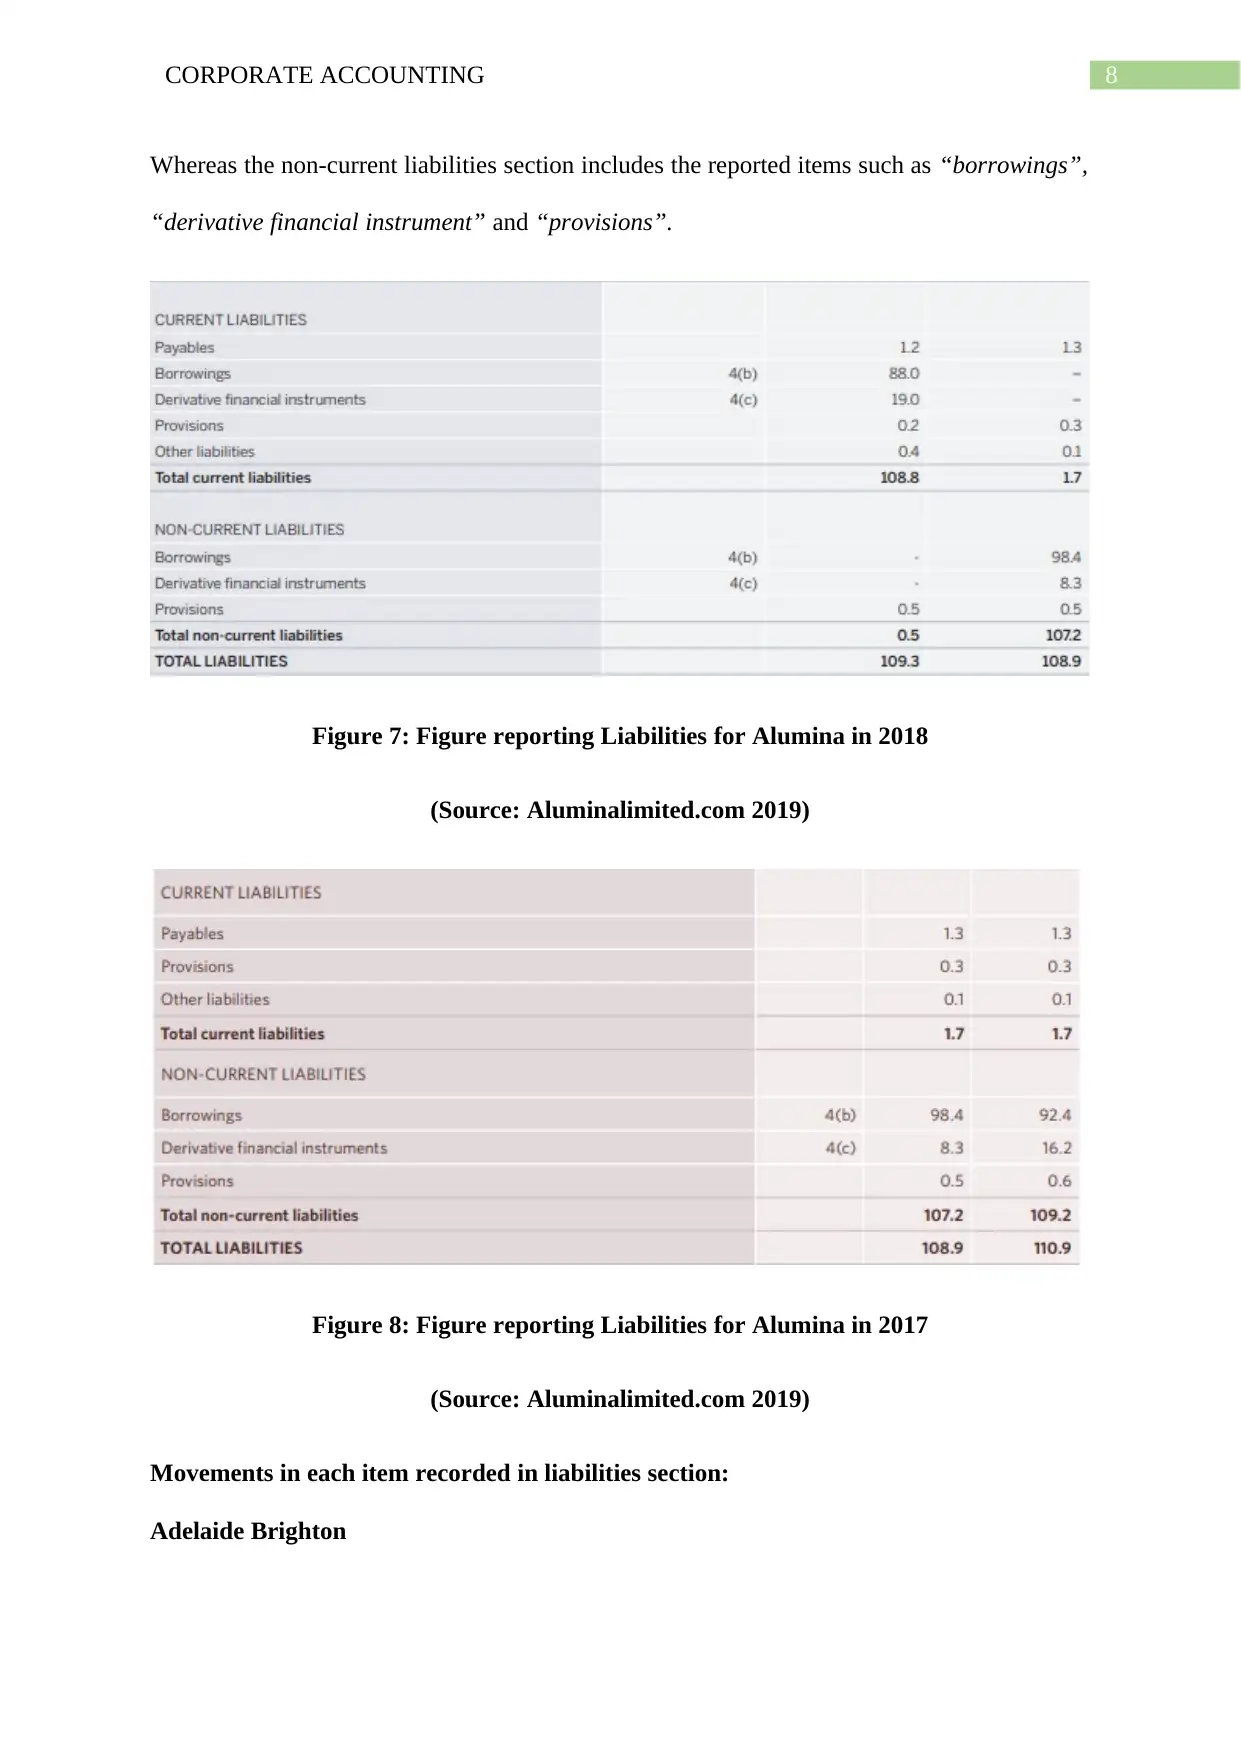
Whereas the non-current liabilities section includes the reported items such as “borrowings”,
“derivative financial instrument” and “provisions”.
Figure 7: Figure reporting Liabilities for Alumina in 2018
(Source: Aluminalimited.com 2019)
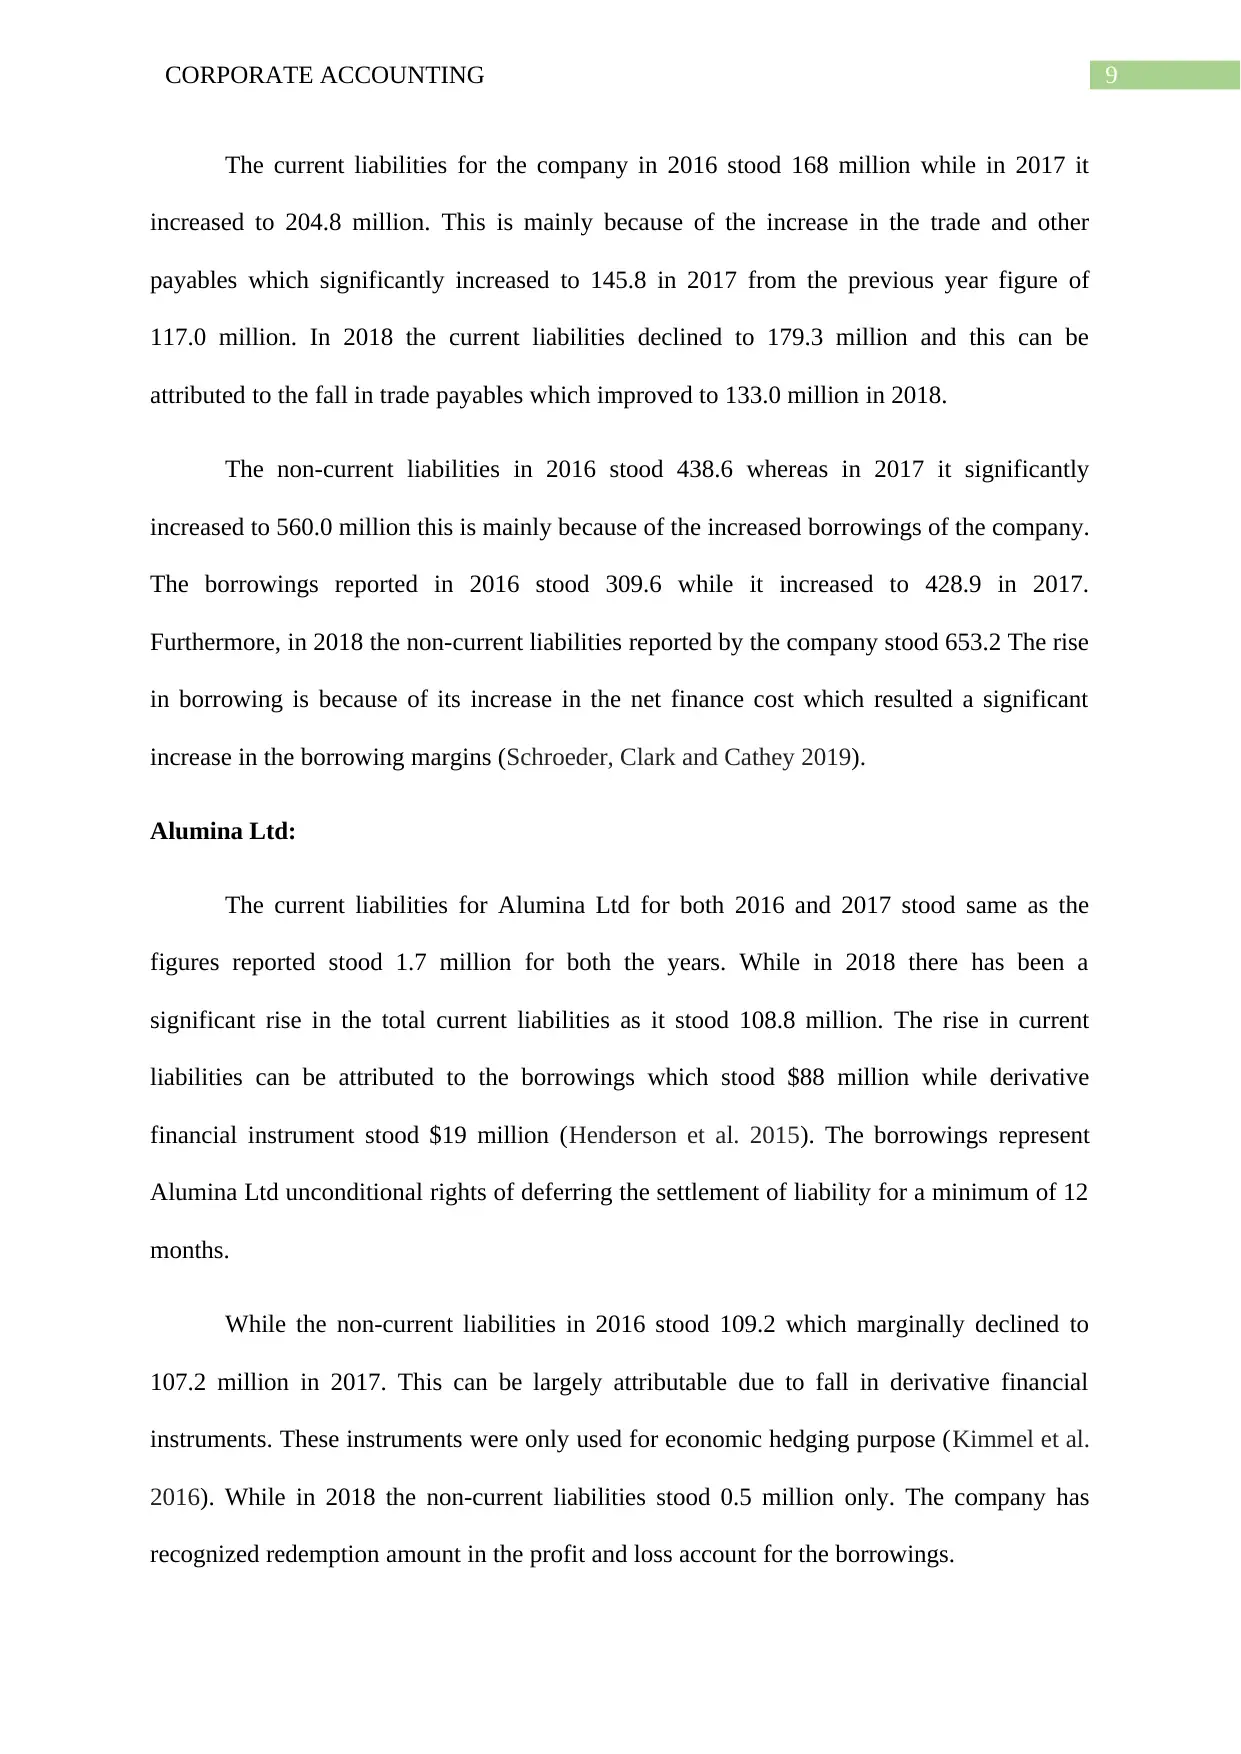
Figure 8: Figure reporting Liabilities for Alumina in 2017
(Source: Aluminalimited.com 2019)
Movements in each item recorded in liabilities section:
Adelaide Brighton
Whereas the non-current liabilities section includes the reported items such as “borrowings”,
“derivative financial instrument” and “provisions”.
Figure 7: Figure reporting Liabilities for Alumina in 2018
(Source: Aluminalimited.com 2019)
Figure 8: Figure reporting Liabilities for Alumina in 2017
(Source: Aluminalimited.com 2019)
Movements in each item recorded in liabilities section:
Adelaide Brighton
⊘ This is a preview!⊘
Do you want full access?
Subscribe today to unlock all pages.
Trusted by 1+ million students worldwide
9CORPORATE ACCOUNTING
The current liabilities for the company in 2016 stood 168 million while in 2017 it
increased to 204.8 million. This is mainly because of the increase in the trade and other
payables which significantly increased to 145.8 in 2017 from the previous year figure of
117.0 million. In 2018 the current liabilities declined to 179.3 million and this can be
attributed to the fall in trade payables which improved to 133.0 million in 2018.
The non-current liabilities in 2016 stood 438.6 whereas in 2017 it significantly
increased to 560.0 million this is mainly because of the increased borrowings of the company.
The borrowings reported in 2016 stood 309.6 while it increased to 428.9 in 2017.
Furthermore, in 2018 the non-current liabilities reported by the company stood 653.2 The rise
in borrowing is because of its increase in the net finance cost which resulted a significant
increase in the borrowing margins (Schroeder, Clark and Cathey 2019).
Alumina Ltd:
The current liabilities for Alumina Ltd for both 2016 and 2017 stood same as the
figures reported stood 1.7 million for both the years. While in 2018 there has been a
significant rise in the total current liabilities as it stood 108.8 million. The rise in current
liabilities can be attributed to the borrowings which stood $88 million while derivative
financial instrument stood $19 million (Henderson et al. 2015). The borrowings represent
Alumina Ltd unconditional rights of deferring the settlement of liability for a minimum of 12
months.
While the non-current liabilities in 2016 stood 109.2 which marginally declined to
107.2 million in 2017. This can be largely attributable due to fall in derivative financial
instruments. These instruments were only used for economic hedging purpose (Kimmel et al.
2016). While in 2018 the non-current liabilities stood 0.5 million only. The company has
recognized redemption amount in the profit and loss account for the borrowings.
Paraphrase This Document
Need a fresh take? Get an instant paraphrase of this document with our AI Paraphraser
10CORPORATE ACCOUNTING
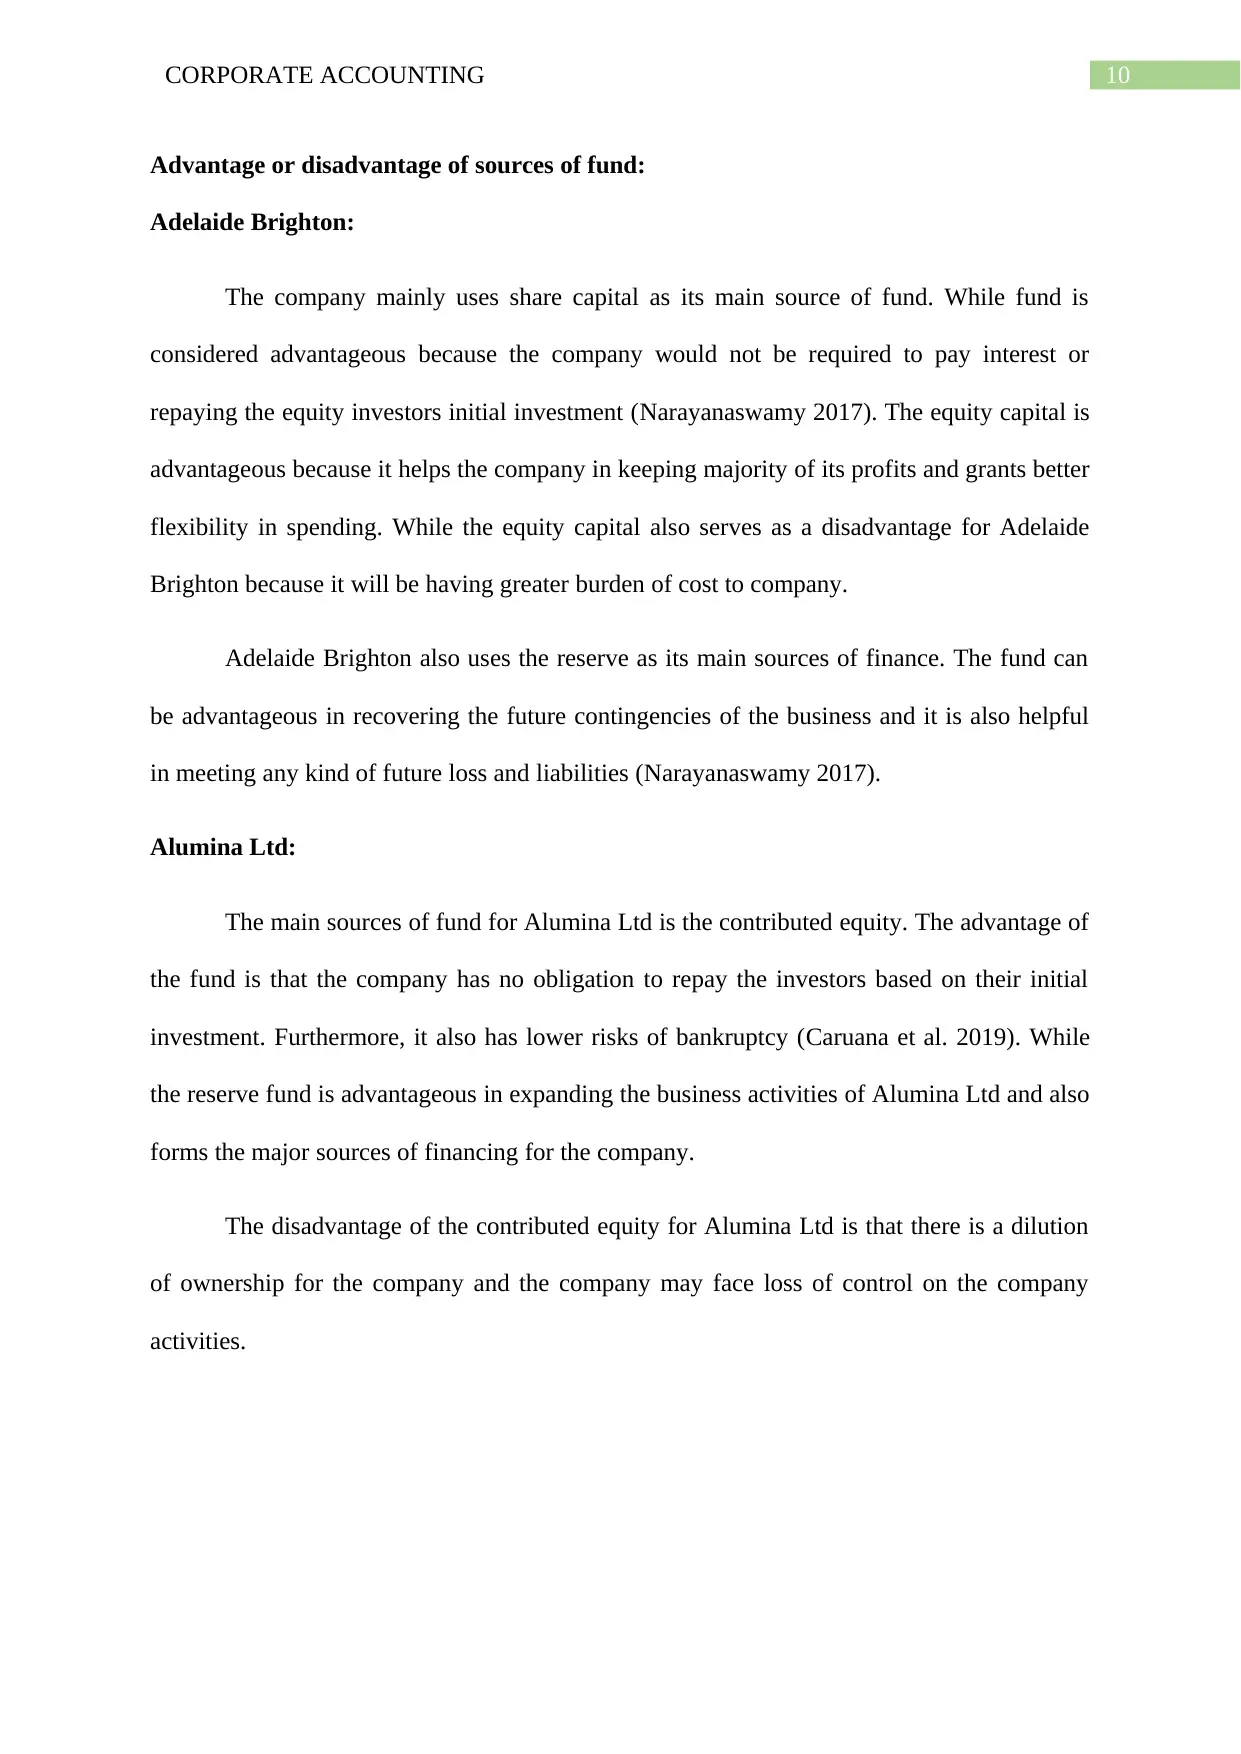
Advantage or disadvantage of sources of fund:
Adelaide Brighton:
The company mainly uses share capital as its main source of fund. While fund is
considered advantageous because the company would not be required to pay interest or
repaying the equity investors initial investment (Narayanaswamy 2017). The equity capital is
advantageous because it helps the company in keeping majority of its profits and grants better
flexibility in spending. While the equity capital also serves as a disadvantage for Adelaide
Brighton because it will be having greater burden of cost to company.
Adelaide Brighton also uses the reserve as its main sources of finance. The fund can
be advantageous in recovering the future contingencies of the business and it is also helpful
in meeting any kind of future loss and liabilities (Narayanaswamy 2017).
Alumina Ltd:
The main sources of fund for Alumina Ltd is the contributed equity. The advantage of
the fund is that the company has no obligation to repay the investors based on their initial
investment. Furthermore, it also has lower risks of bankruptcy (Caruana et al. 2019). While
the reserve fund is advantageous in expanding the business activities of Alumina Ltd and also
forms the major sources of financing for the company.
The disadvantage of the contributed equity for Alumina Ltd is that there is a dilution
of ownership for the company and the company may face loss of control on the company
activities.
11CORPORATE ACCOUNTING
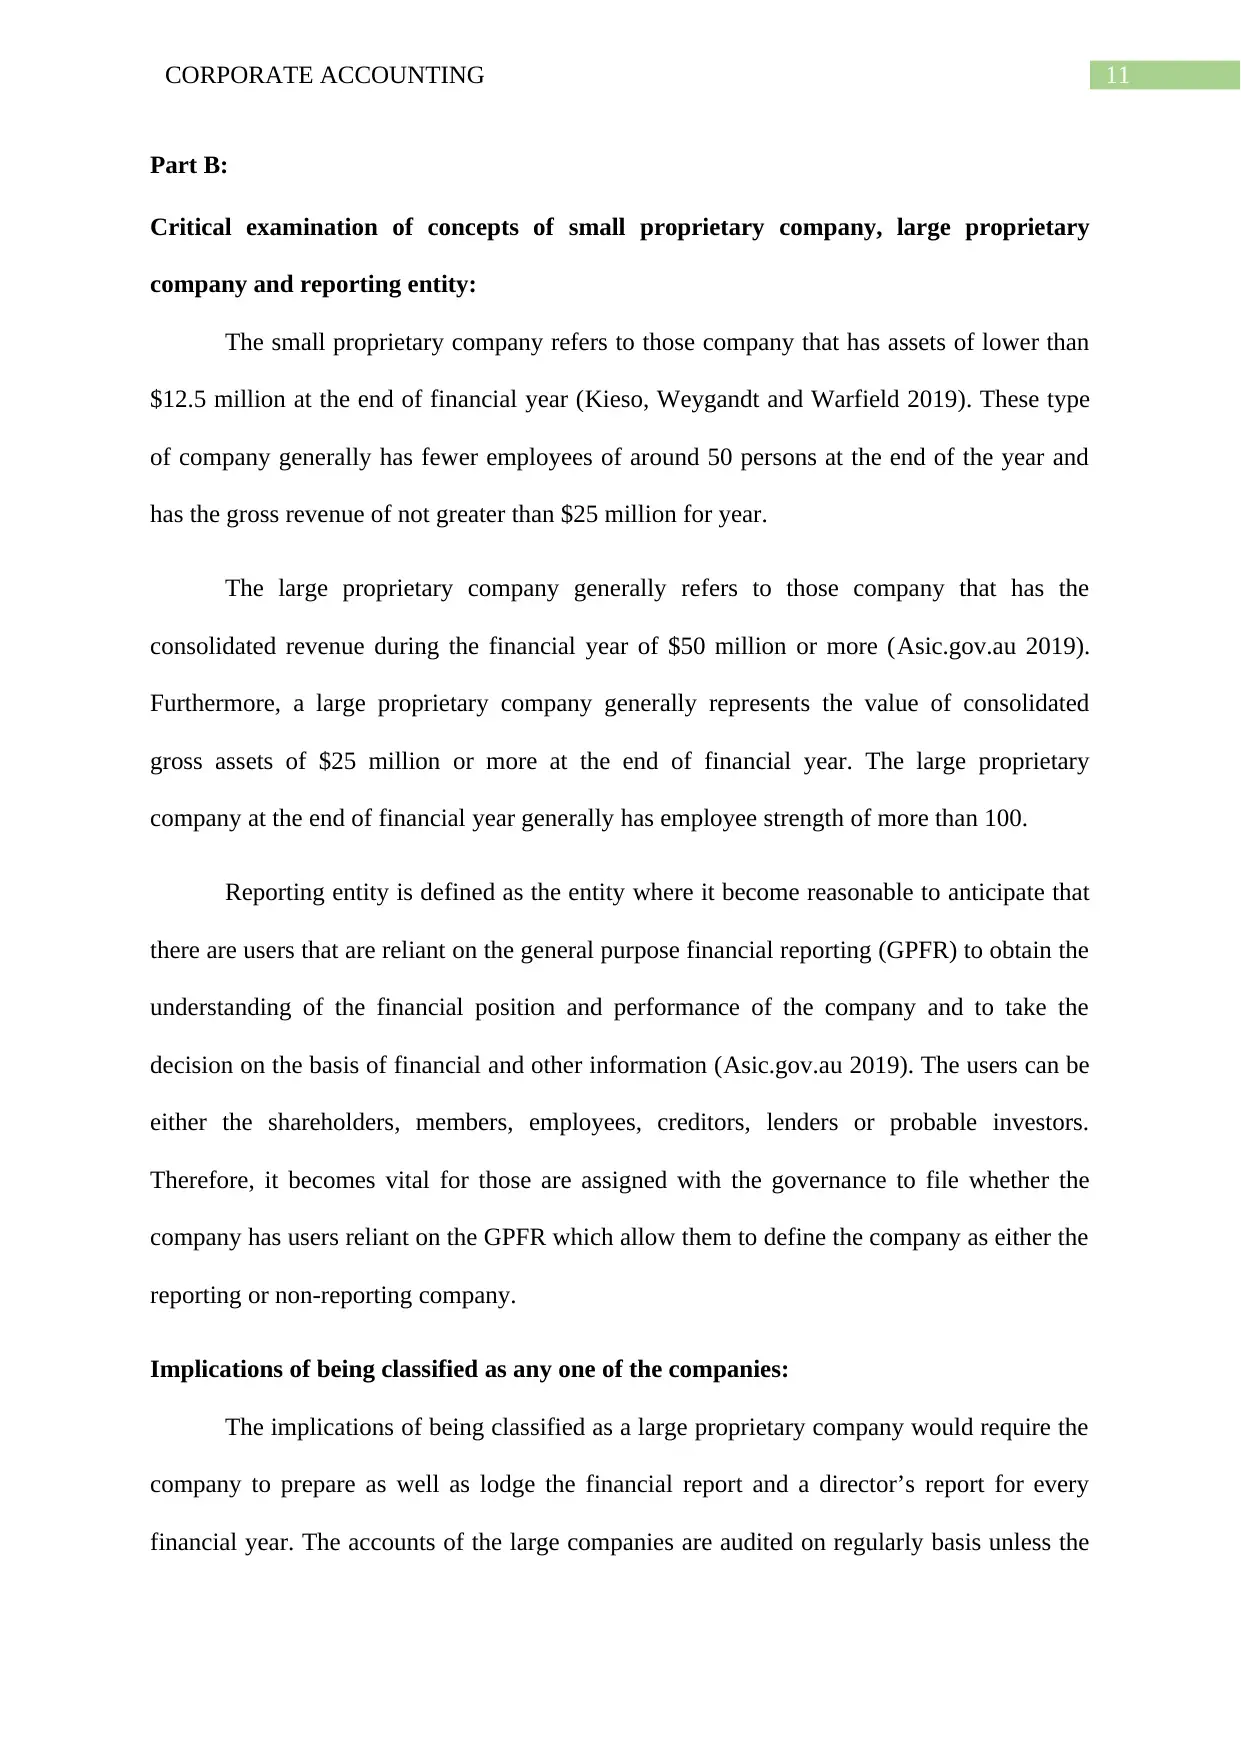
Part B:
Critical examination of concepts of small proprietary company, large proprietary
company and reporting entity:
The small proprietary company refers to those company that has assets of lower than
$12.5 million at the end of financial year (Kieso, Weygandt and Warfield 2019). These type
of company generally has fewer employees of around 50 persons at the end of the year and
has the gross revenue of not greater than $25 million for year.
The large proprietary company generally refers to those company that has the
consolidated revenue during the financial year of $50 million or more (Asic.gov.au 2019).
Furthermore, a large proprietary company generally represents the value of consolidated
gross assets of $25 million or more at the end of financial year. The large proprietary
company at the end of financial year generally has employee strength of more than 100.
Reporting entity is defined as the entity where it become reasonable to anticipate that
there are users that are reliant on the general purpose financial reporting (GPFR) to obtain the
understanding of the financial position and performance of the company and to take the
decision on the basis of financial and other information (Asic.gov.au 2019). The users can be
either the shareholders, members, employees, creditors, lenders or probable investors.
Therefore, it becomes vital for those are assigned with the governance to file whether the
company has users reliant on the GPFR which allow them to define the company as either the
reporting or non-reporting company.
Implications of being classified as any one of the companies:
The implications of being classified as a large proprietary company would require the
company to prepare as well as lodge the financial report and a director’s report for every
financial year. The accounts of the large companies are audited on regularly basis unless the
⊘ This is a preview!⊘
Do you want full access?
Subscribe today to unlock all pages.
Trusted by 1+ million students worldwide
1 out of 16
Related Documents


Your All-in-One AI-Powered Toolkit for Academic Success.
+13062052269
info@desklib.com
Available 24*7 on WhatsApp / Email
![[object Object]](/_next/static/media/star-bottom.7253800d.svg)
Unlock your academic potential
Copyright © 2020–2026 A2Z Services. All Rights Reserved. Developed and managed by ZUCOL.