HI5020 Corporate Accounting: Comparative Analysis of Woolworths
VerifiedAdded on 2023/06/11
|20
|4235
|414
Report
AI Summary
This report presents a comprehensive financial analysis of two major Australian companies, Woolworths and Wesfarmers, both operating within the food and staples industry. The analysis encompasses various financial and accounting concepts to evaluate the companies' performance. Key areas explored include an analysis of owners' equity, detailing changes in issued capital, retained earnings, and reserves. The report also provides a comparative analysis of cash flow statements, examining cash flows from operating, investing, and financing activities over the past three years. Furthermore, it delves into other comprehensive income, identifying reported items and their impact on performance evaluation. Finally, the report analyzes corporate income tax, including tax expenses, effective tax rates, deferred tax assets and liabilities, and cash tax calculations, concluding with a discussion on the reasons for differences between cash and book tax rates. This report is designed to provide a thorough understanding of the financial health and operational efficiency of Woolworths and Wesfarmers.
Corporate Accounting
1
1
Paraphrase This Document
Need a fresh take? Get an instant paraphrase of this document with our AI Paraphraser
Executive Summary
The following assignment contains an analysis on the financial statement of the two major
companies in Australia- Woolworths and Wesfarmers. Both the company belong to the food
and staples industry in Australia. We have used various financial and accounting concepts to
conduct the following analysis.
2
Contents
Introduction...........................................................................................................................................4
Analysis of Owners Equity....................................................................................................................5
Understanding of Equity....................................................................................................................5
Debt and equity of both the companies..............................................................................................7
Analysis of Cash flow statement...........................................................................................................8
Overview of the cash flow statement.................................................................................................8
Comparison of the cash flows of last three years...............................................................................9
Overall Analysis of cash flow of both the companies:.....................................................................10
Analysis of other comprehensive income............................................................................................12
Items reported in the other comprehensive income statement..........................................................12
Reasons of reporting these items in other comprehensive income statement...................................12
Comparative analysis of the items of both the companies...............................................................12
Consideration of Items of OCI in evaluating the performance of the managers..............................13
Analysis of Corporate income tax.......................................................................................................14
Tax expenses of the companies.......................................................................................................14
Effective tax rate of both the companies..........................................................................................14
Deferred tax assets and liabilities....................................................................................................14
Change in deferred tax for the companies........................................................................................15
Calculation of cash tax for the companies using book tax...............................................................15
Analysis of cash tax rate for both the companies.............................................................................16
Reasons of difference between the cash and book tax rates.............................................................16
Conclusion...........................................................................................................................................18
Bibliography........................................................................................................................................19
3
⊘ This is a preview!⊘
Do you want full access?
Subscribe today to unlock all pages.
Trusted by 1+ million students worldwide
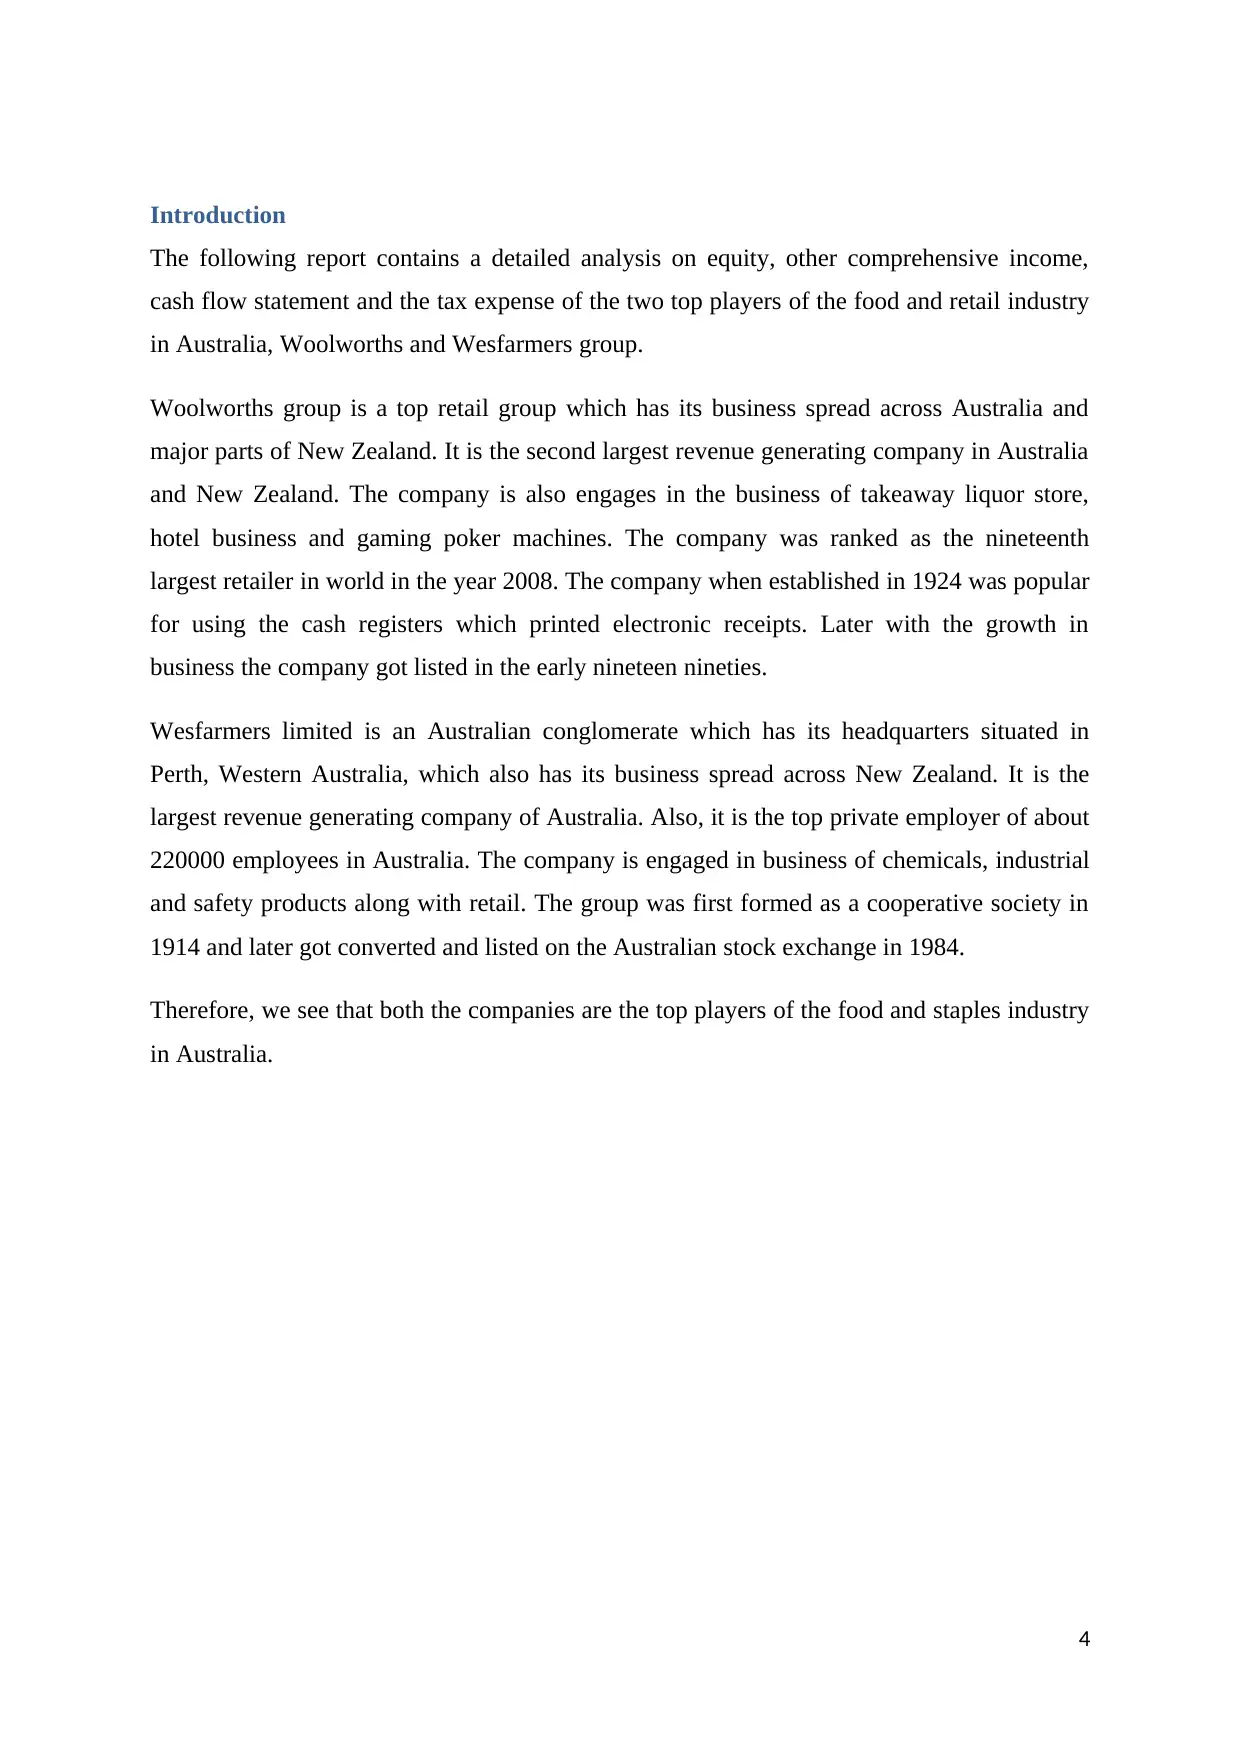
Introduction
The following report contains a detailed analysis on equity, other comprehensive income,
cash flow statement and the tax expense of the two top players of the food and retail industry
in Australia, Woolworths and Wesfarmers group.
Woolworths group is a top retail group which has its business spread across Australia and
major parts of New Zealand. It is the second largest revenue generating company in Australia
and New Zealand. The company is also engages in the business of takeaway liquor store,
hotel business and gaming poker machines. The company was ranked as the nineteenth
largest retailer in world in the year 2008. The company when established in 1924 was popular
for using the cash registers which printed electronic receipts. Later with the growth in
business the company got listed in the early nineteen nineties.
Wesfarmers limited is an Australian conglomerate which has its headquarters situated in
Perth, Western Australia, which also has its business spread across New Zealand. It is the
largest revenue generating company of Australia. Also, it is the top private employer of about
220000 employees in Australia. The company is engaged in business of chemicals, industrial
and safety products along with retail. The group was first formed as a cooperative society in
1914 and later got converted and listed on the Australian stock exchange in 1984.
Therefore, we see that both the companies are the top players of the food and staples industry
in Australia.
4
Paraphrase This Document
Need a fresh take? Get an instant paraphrase of this document with our AI Paraphraser
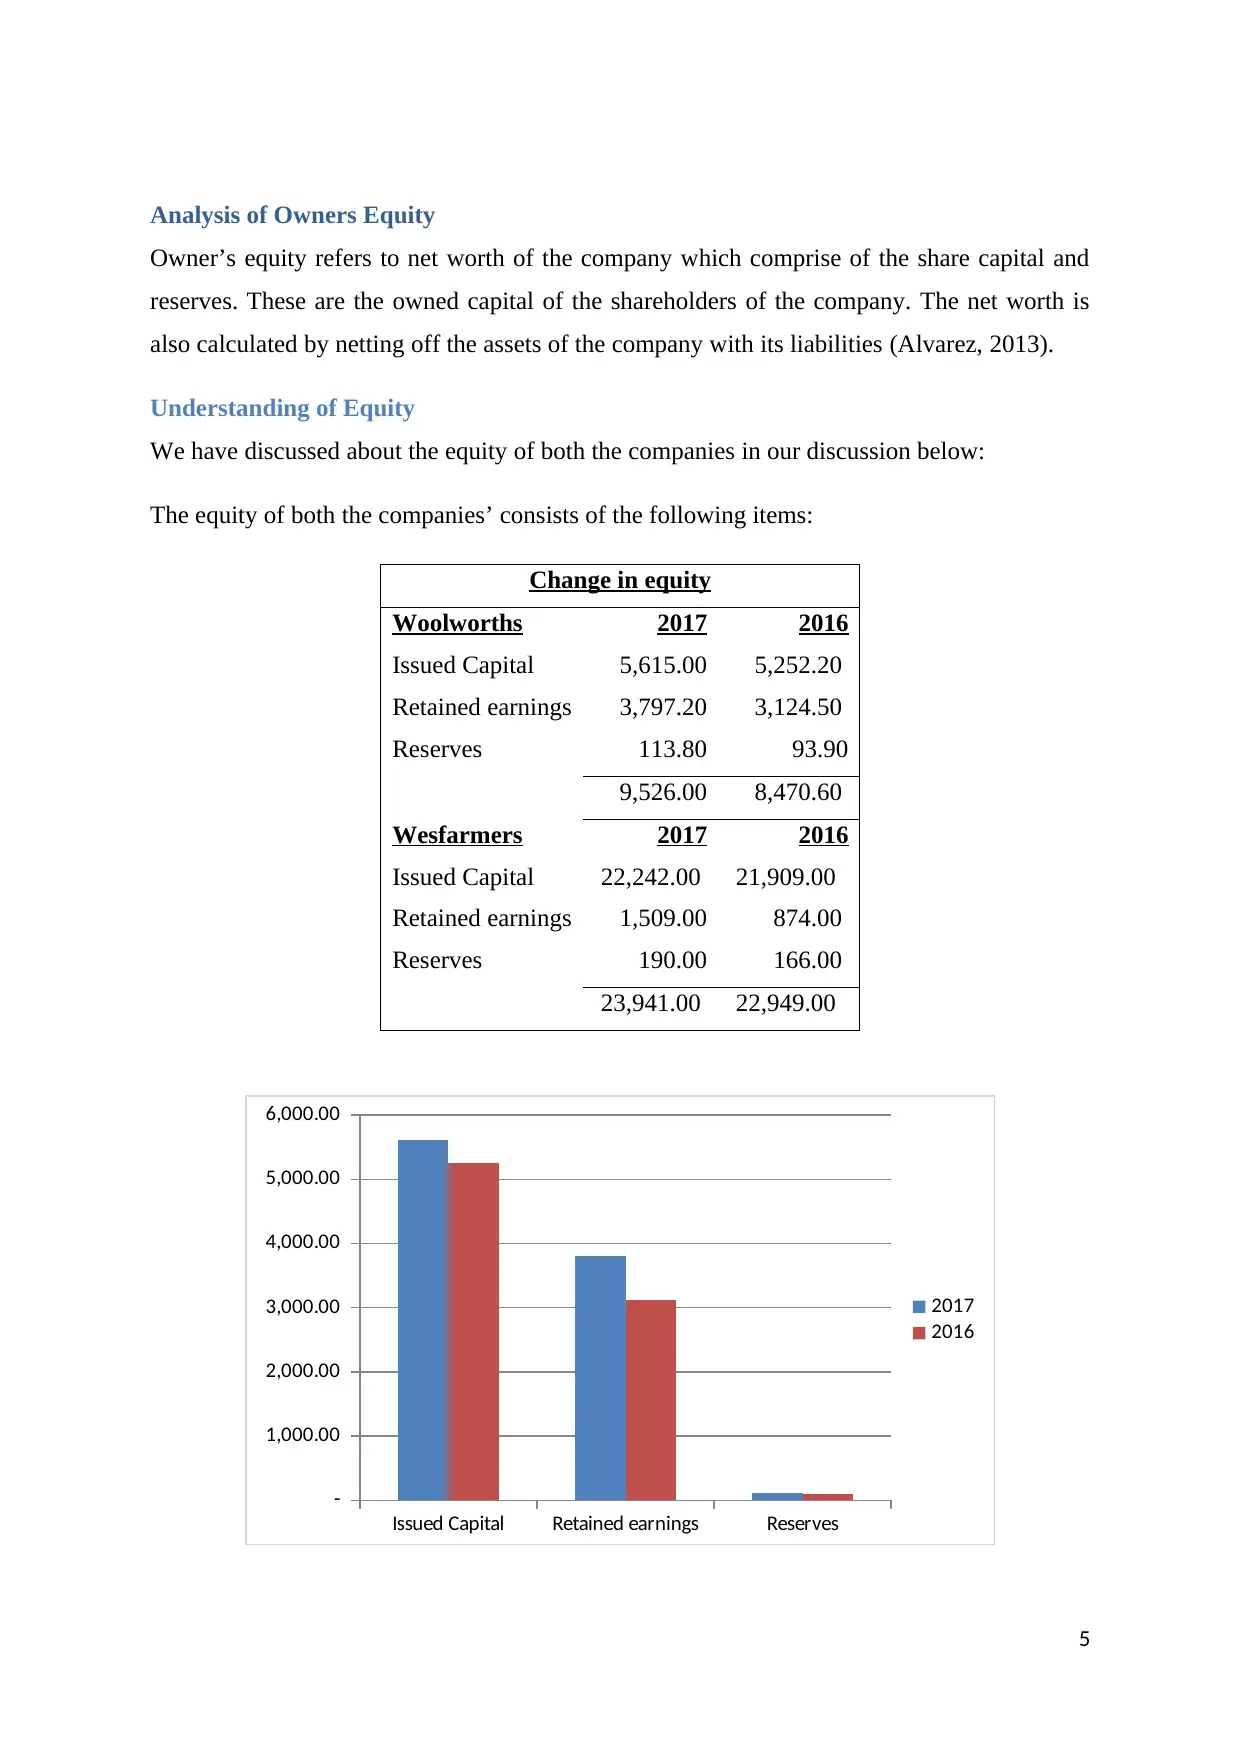
Analysis of Owners Equity
Owner’s equity refers to net worth of the company which comprise of the share capital and
reserves. These are the owned capital of the shareholders of the company. The net worth is
also calculated by netting off the assets of the company with its liabilities (Alvarez, 2013).
Understanding of Equity
We have discussed about the equity of both the companies in our discussion below:
The equity of both the companies’ consists of the following items:
Change in equity
Woolworths 2017 2016
Issued Capital 5,615.00 5,252.20
Retained earnings 3,797.20 3,124.50
Reserves 113.80 93.90
9,526.00 8,470.60
Wesfarmers 2017 2016
Issued Capital 22,242.00 21,909.00
Retained earnings 1,509.00 874.00
Reserves 190.00 166.00
23,941.00 22,949.00
Issued Capital Retained earnings Reserves
-
1,000.00
2,000.00
3,000.00
4,000.00
5,000.00
6,000.00
2017
2016
5
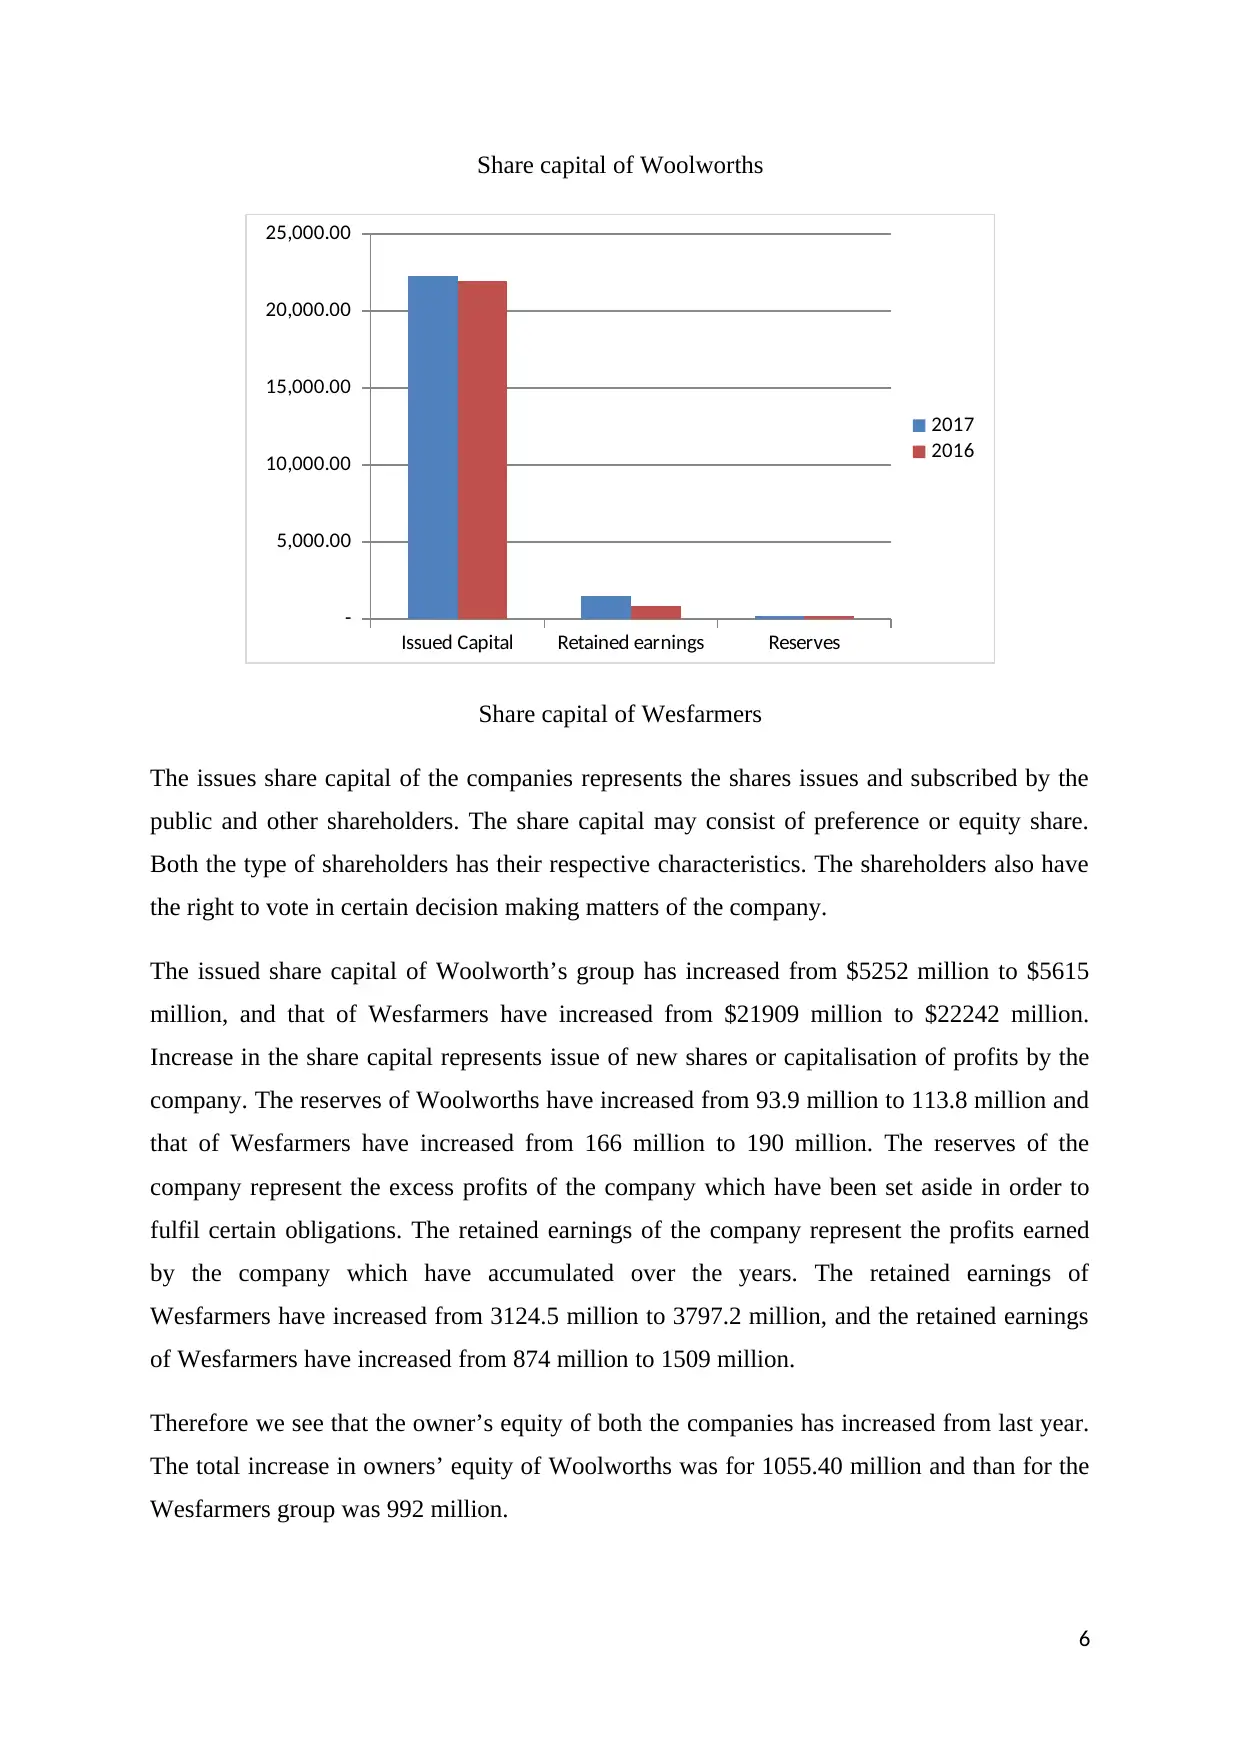
Share capital of Woolworths
Issued Capital Retained earnings Reserves
-
5,000.00
10,000.00
15,000.00
20,000.00
25,000.00
2017
2016
Share capital of Wesfarmers
The issues share capital of the companies represents the shares issues and subscribed by the
public and other shareholders. The share capital may consist of preference or equity share.
Both the type of shareholders has their respective characteristics. The shareholders also have
the right to vote in certain decision making matters of the company.
The issued share capital of Woolworth’s group has increased from $5252 million to $5615
million, and that of Wesfarmers have increased from $21909 million to $22242 million.
Increase in the share capital represents issue of new shares or capitalisation of profits by the
company. The reserves of Woolworths have increased from 93.9 million to 113.8 million and
that of Wesfarmers have increased from 166 million to 190 million. The reserves of the
company represent the excess profits of the company which have been set aside in order to
fulfil certain obligations. The retained earnings of the company represent the profits earned
by the company which have accumulated over the years. The retained earnings of
Wesfarmers have increased from 3124.5 million to 3797.2 million, and the retained earnings
of Wesfarmers have increased from 874 million to 1509 million.
Therefore we see that the owner’s equity of both the companies has increased from last year.
The total increase in owners’ equity of Woolworths was for 1055.40 million and than for the
Wesfarmers group was 992 million.
6
⊘ This is a preview!⊘
Do you want full access?
Subscribe today to unlock all pages.
Trusted by 1+ million students worldwide
Debt and equity of both the companies
The capital of the company can be divided into two major heads- debt and equity. We have
discussed about the equity share capital of the company in above discussion (Bragg, 2015).
Debt is the amount of capital taken on loan from the third parties with an attached obligation
to pay interest. The debt providers do not hold a say in the affairs of the company. Both the
type of funds has their own pros and cons (Donohue, 2015). The proportion of debt and
equity to be used is determined based on various factors. The cost of capital plays a very vital
role in determining the debt equity ratio of the company. The management prefers to keep the
cost minimum in order to gain maximum advantages (Easton, 2010).
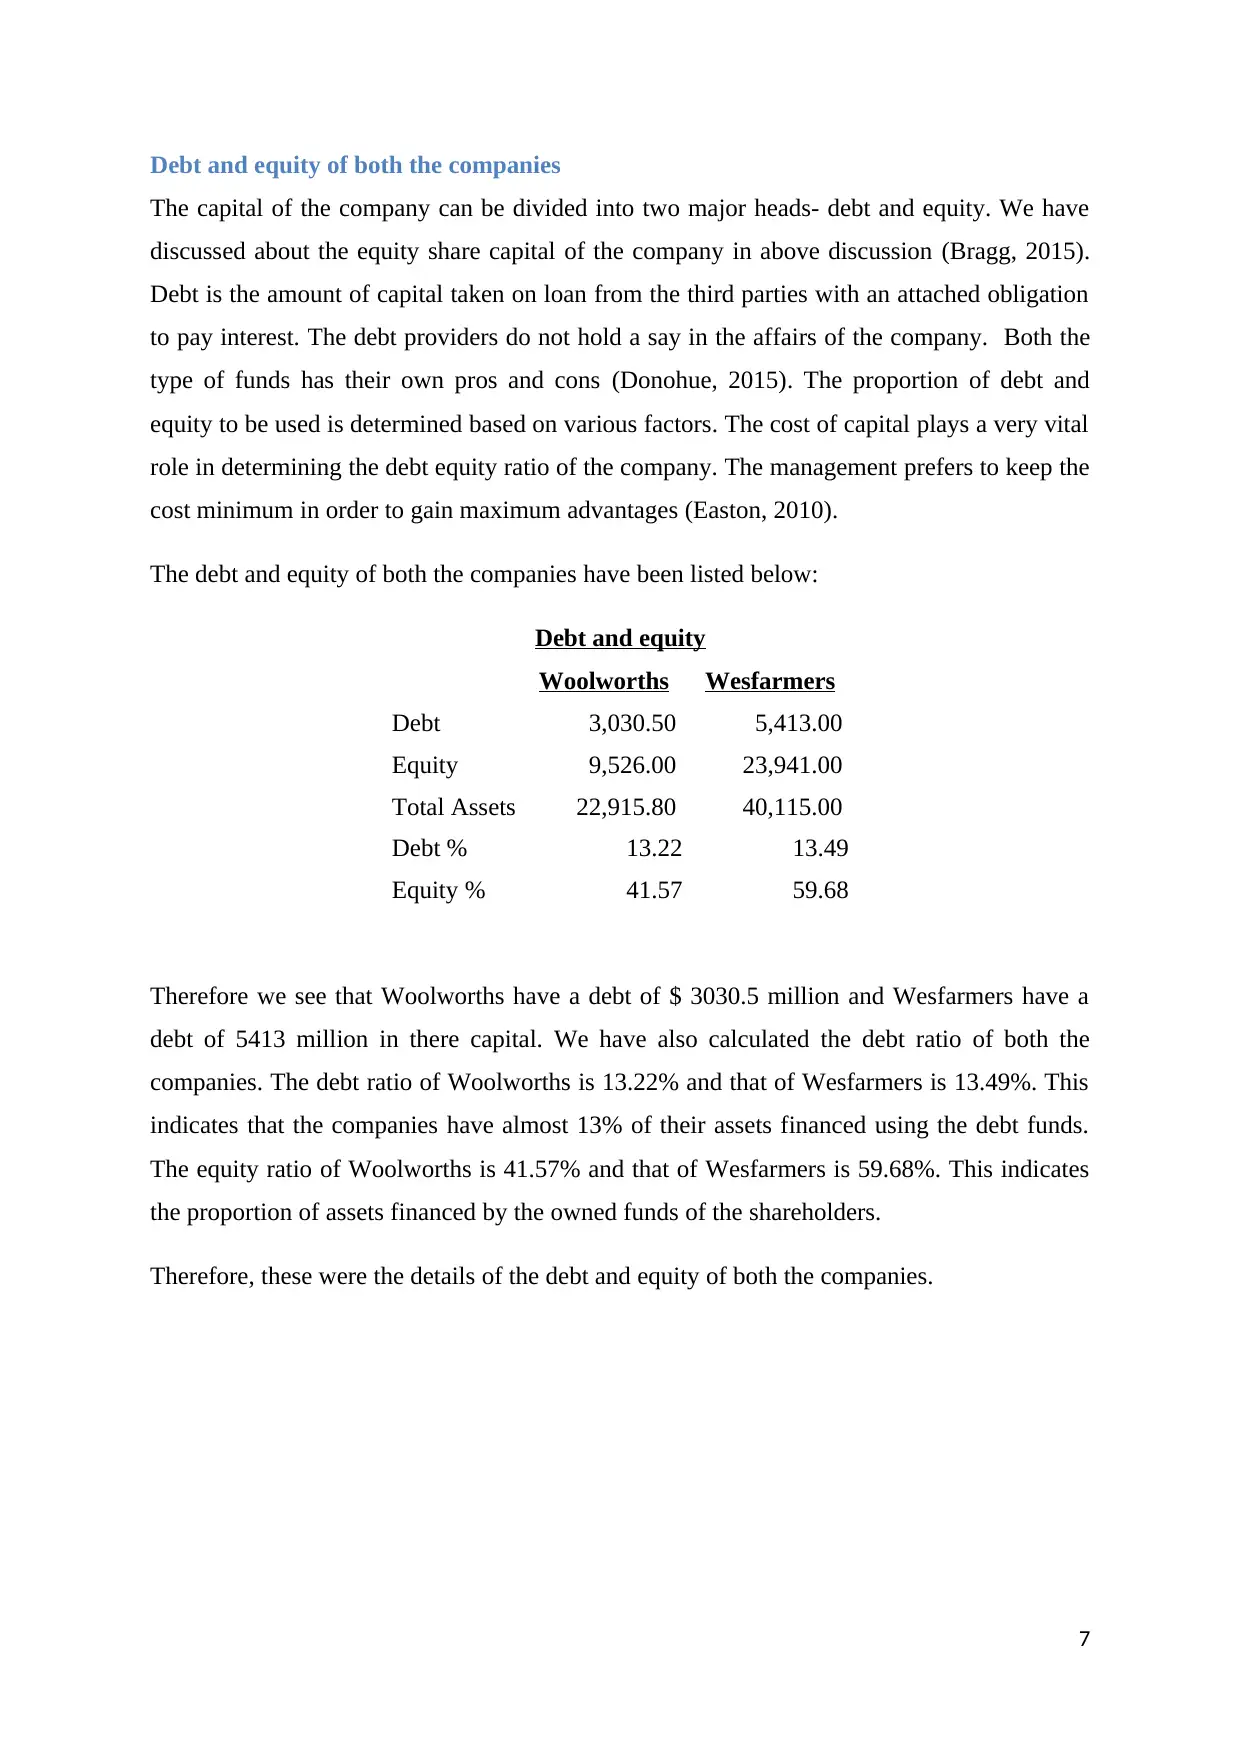
The debt and equity of both the companies have been listed below:
Debt and equity
Woolworths Wesfarmers
Debt 3,030.50 5,413.00
Equity 9,526.00 23,941.00
Total Assets 22,915.80 40,115.00
Debt % 13.22 13.49
Equity % 41.57 59.68
Therefore we see that Woolworths have a debt of $ 3030.5 million and Wesfarmers have a
debt of 5413 million in there capital. We have also calculated the debt ratio of both the
companies. The debt ratio of Woolworths is 13.22% and that of Wesfarmers is 13.49%. This
indicates that the companies have almost 13% of their assets financed using the debt funds.
The equity ratio of Woolworths is 41.57% and that of Wesfarmers is 59.68%. This indicates
the proportion of assets financed by the owned funds of the shareholders.
Therefore, these were the details of the debt and equity of both the companies.
7
The capital of the company can be divided into two major heads- debt and equity. We have
discussed about the equity share capital of the company in above discussion (Bragg, 2015).
Debt is the amount of capital taken on loan from the third parties with an attached obligation
to pay interest. The debt providers do not hold a say in the affairs of the company. Both the
type of funds has their own pros and cons (Donohue, 2015). The proportion of debt and
equity to be used is determined based on various factors. The cost of capital plays a very vital
role in determining the debt equity ratio of the company. The management prefers to keep the
cost minimum in order to gain maximum advantages (Easton, 2010).
The debt and equity of both the companies have been listed below:
Debt and equity
Woolworths Wesfarmers
Debt 3,030.50 5,413.00
Equity 9,526.00 23,941.00
Total Assets 22,915.80 40,115.00
Debt % 13.22 13.49
Equity % 41.57 59.68
Therefore we see that Woolworths have a debt of $ 3030.5 million and Wesfarmers have a
debt of 5413 million in there capital. We have also calculated the debt ratio of both the
companies. The debt ratio of Woolworths is 13.22% and that of Wesfarmers is 13.49%. This
indicates that the companies have almost 13% of their assets financed using the debt funds.
The equity ratio of Woolworths is 41.57% and that of Wesfarmers is 59.68%. This indicates
the proportion of assets financed by the owned funds of the shareholders.
Therefore, these were the details of the debt and equity of both the companies.
7
Paraphrase This Document
Need a fresh take? Get an instant paraphrase of this document with our AI Paraphraser
Analysis of Cash flow statement
The books of accounts of the companies are required to be made on accrual basis in order to
determine the profitability of the business for a given period (Elaine, 2015). The actual cash
inflows and outflows are not taken into consideration while evaluating the profitability. But it
is important that cash flows of the companies are also reported in order to keep the liquidity
of the company in check (Fisher, 2012). In our discussion below we have discussed about the
cash flow statement of both the companies. The cash flow statement of the companies
consists of three broad heads- cash from operating, investing and financing activities (Fridson
& Alvarez, 2012).
Overview of the cash flow statement
The cash from operating activities of Woolworths group mainly comprise of cash flows from
activities like receipts from customers, payment to suppliers. The net cash flow from
operating activities of Woolworths increased from 2357.5 million to 3122 million. The major
increase was result of increase in inflows from customers and decline in payments made to
the suppliers.
The cash from operating activities of Wesfarmers mainly comprise of receipts and payment
for sales and purchases, and other adjustments made in order to arrive at cash from operating
activities. The cash flow from operating activities increased from 3365 million to 4226
million. The major contributor to the increase in cash was a result of increased cash flow
from customers and lower payments made to the suppliers.
The cash outflows from investing activities of Woolworths increased from 1266.7 million to
1431.4 million. The increase in the outflows was a result of increased investments made in
plant and other assets by the company in the current year.
The cash outflows from investing activities of the Wesfarmers declined from 2132 million to
53 million. The decline in cash outflows was a result of increased cash inflows from sale of
subsidiaries which offset the outflows of cash made in connection with other investments.
The cash outflows from financing activities of Woolworths increased from 1474.9 million to
1729.3 million. The increase in outflows was due to increased payments made in connections
with the borrowings.
8
The cash outflows from financing activities of Wesfarmers increased from 1333 million to
3771 million. The increase in cash outflows was a result of lowered inflows and increased
repayments of the loans by the company in the current year.
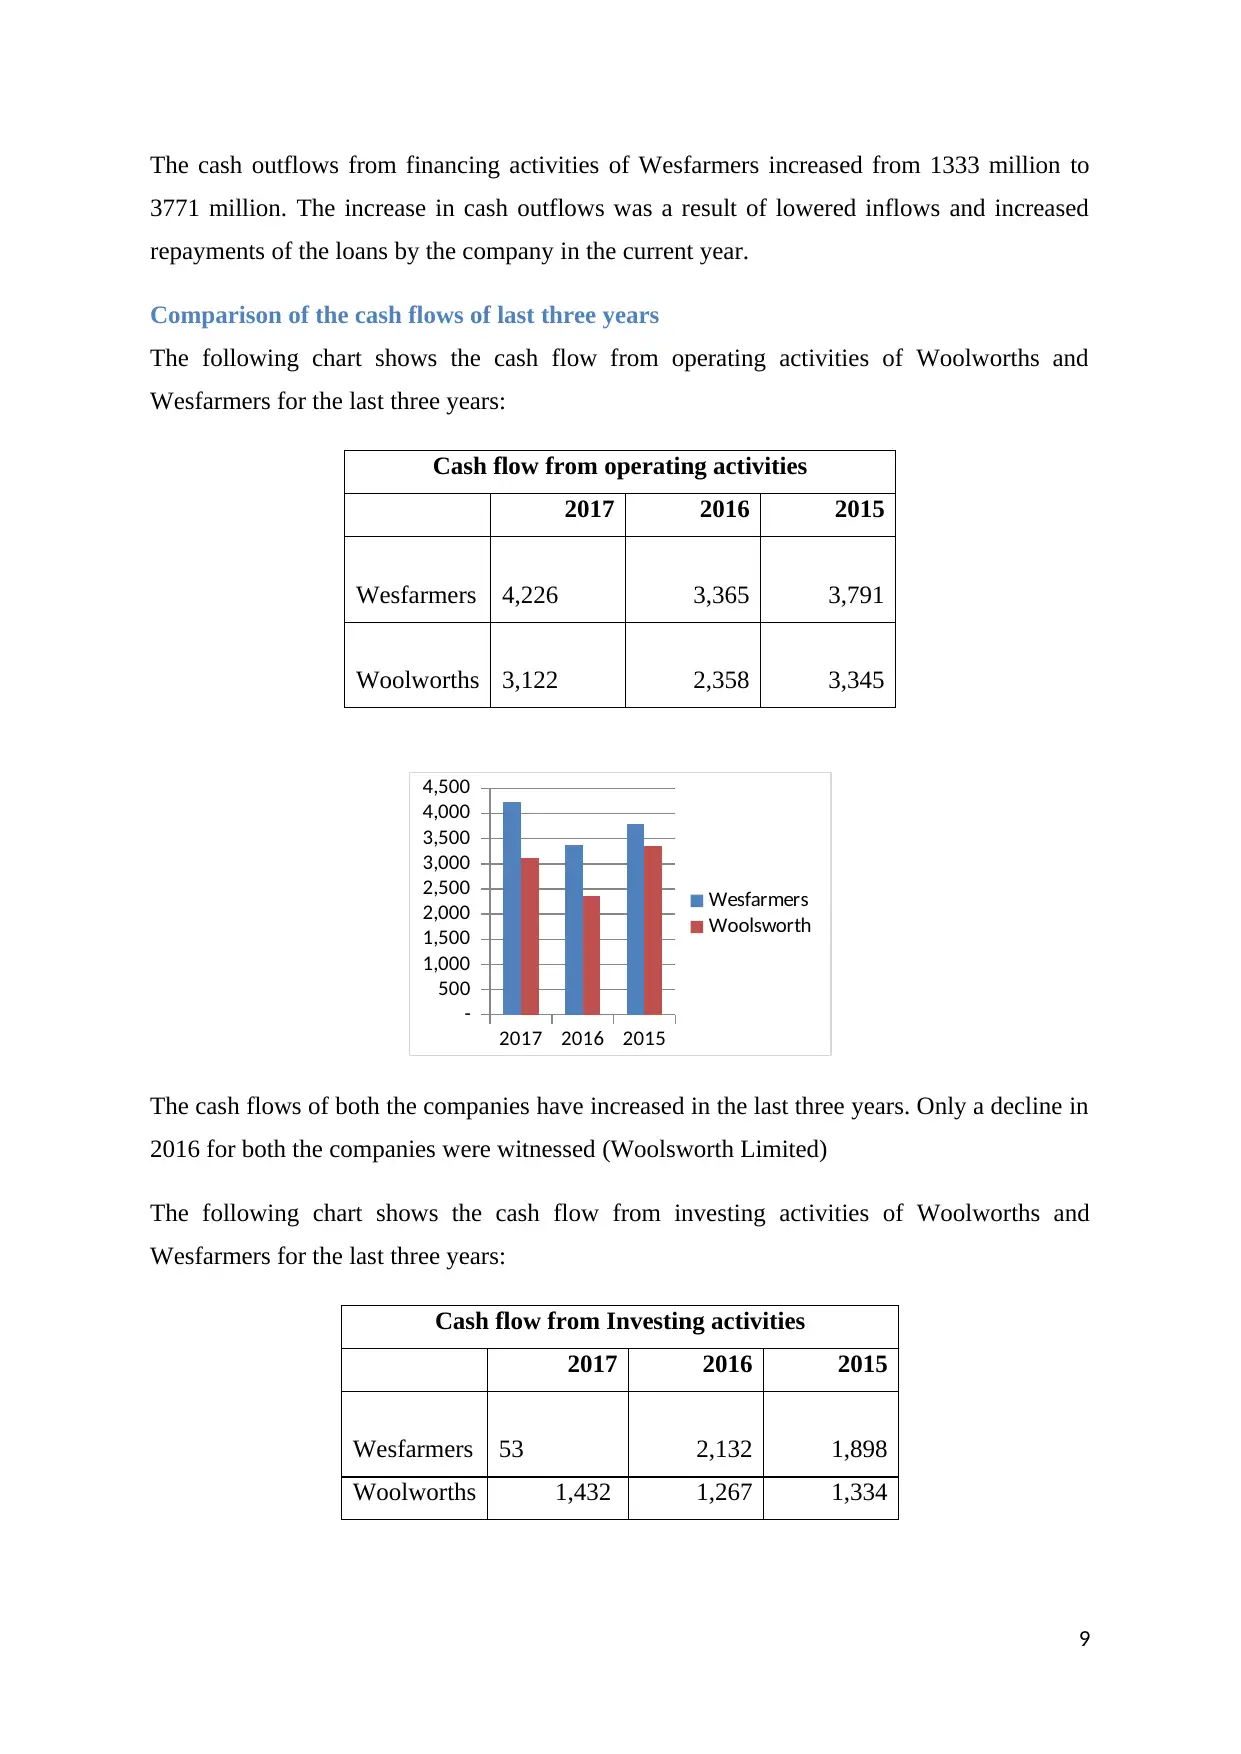
Comparison of the cash flows of last three years
The following chart shows the cash flow from operating activities of Woolworths and
Wesfarmers for the last three years:
Cash flow from operating activities
2017 2016 2015
Wesfarmers 4,226 3,365 3,791
Woolworths 3,122 2,358 3,345
2017 2016 2015
-
500
1,000
1,500
2,000
2,500
3,000
3,500
4,000
4,500
Wesfarmers
Woolsworth
The cash flows of both the companies have increased in the last three years. Only a decline in
2016 for both the companies were witnessed (Woolsworth Limited)
The following chart shows the cash flow from investing activities of Woolworths and
Wesfarmers for the last three years:
Cash flow from Investing activities
2017 2016 2015
Wesfarmers 53 2,132 1,898
Woolworths 1,432 1,267 1,334
9
3771 million. The increase in cash outflows was a result of lowered inflows and increased
repayments of the loans by the company in the current year.
Comparison of the cash flows of last three years
The following chart shows the cash flow from operating activities of Woolworths and
Wesfarmers for the last three years:
Cash flow from operating activities
2017 2016 2015
Wesfarmers 4,226 3,365 3,791
Woolworths 3,122 2,358 3,345
2017 2016 2015
-
500
1,000
1,500
2,000
2,500
3,000
3,500
4,000
4,500
Wesfarmers
Woolsworth
The cash flows of both the companies have increased in the last three years. Only a decline in
2016 for both the companies were witnessed (Woolsworth Limited)
The following chart shows the cash flow from investing activities of Woolworths and
Wesfarmers for the last three years:
Cash flow from Investing activities
2017 2016 2015
Wesfarmers 53 2,132 1,898
Woolworths 1,432 1,267 1,334
9
⊘ This is a preview!⊘
Do you want full access?
Subscribe today to unlock all pages.
Trusted by 1+ million students worldwide
2017 2016 2015
-
500
1,000
1,500
2,000
2,500
Wesfarmers
Woolsworth
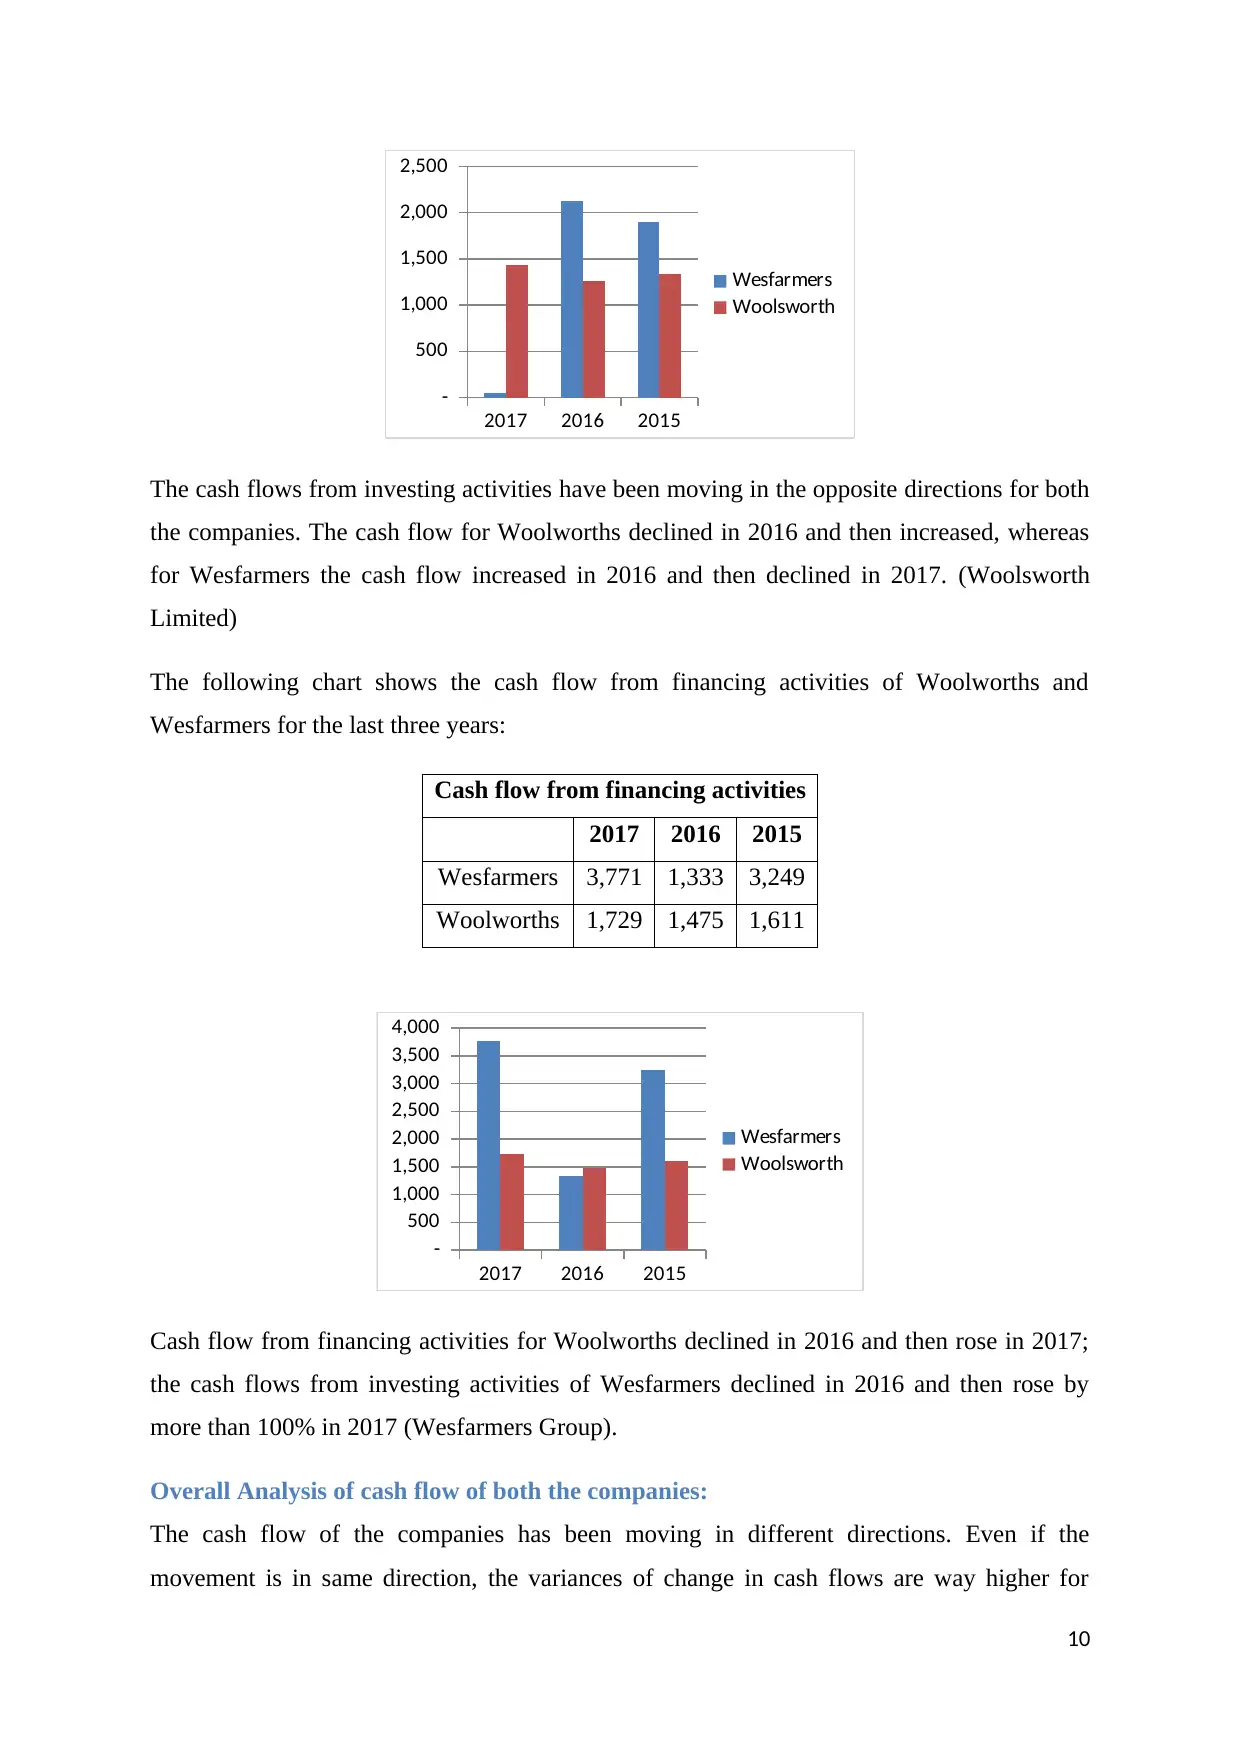
The cash flows from investing activities have been moving in the opposite directions for both
the companies. The cash flow for Woolworths declined in 2016 and then increased, whereas
for Wesfarmers the cash flow increased in 2016 and then declined in 2017. (Woolsworth
Limited)
The following chart shows the cash flow from financing activities of Woolworths and
Wesfarmers for the last three years:
Cash flow from financing activities
2017 2016 2015
Wesfarmers 3,771 1,333 3,249
Woolworths 1,729 1,475 1,611
2017 2016 2015
-
500
1,000
1,500
2,000
2,500
3,000
3,500
4,000
Wesfarmers
Woolsworth
Cash flow from financing activities for Woolworths declined in 2016 and then rose in 2017;
the cash flows from investing activities of Wesfarmers declined in 2016 and then rose by
more than 100% in 2017 (Wesfarmers Group).
Overall Analysis of cash flow of both the companies:
The cash flow of the companies has been moving in different directions. Even if the
movement is in same direction, the variances of change in cash flows are way higher for
10
-
500
1,000
1,500
2,000
2,500
Wesfarmers
Woolsworth
The cash flows from investing activities have been moving in the opposite directions for both
the companies. The cash flow for Woolworths declined in 2016 and then increased, whereas
for Wesfarmers the cash flow increased in 2016 and then declined in 2017. (Woolsworth
Limited)
The following chart shows the cash flow from financing activities of Woolworths and
Wesfarmers for the last three years:
Cash flow from financing activities
2017 2016 2015
Wesfarmers 3,771 1,333 3,249
Woolworths 1,729 1,475 1,611
2017 2016 2015
-
500
1,000
1,500
2,000
2,500
3,000
3,500
4,000
Wesfarmers
Woolsworth
Cash flow from financing activities for Woolworths declined in 2016 and then rose in 2017;
the cash flows from investing activities of Wesfarmers declined in 2016 and then rose by
more than 100% in 2017 (Wesfarmers Group).
Overall Analysis of cash flow of both the companies:
The cash flow of the companies has been moving in different directions. Even if the
movement is in same direction, the variances of change in cash flows are way higher for
10
Paraphrase This Document
Need a fresh take? Get an instant paraphrase of this document with our AI Paraphraser
Wesfarmers than the Woolworths. A gradual increase or decrease in the cash flows of the
Woolworths can be seen, whereas the cash flows of Wesfarmers seem to be volatile with high
variances than the last year.
11
Woolworths can be seen, whereas the cash flows of Wesfarmers seem to be volatile with high
variances than the last year.
11
Analysis of other comprehensive income
Items reported in the other comprehensive income statement
The other comprehensive income of the Woolworths consists of the following items:
- Changes in fair value of the cash flow hedges
- Changes in the exchange rates related to foreign operations
- Changes the fair value of the equity instruments held as investments
- Changes in the value of superannuation fund
- Tax effect on all the above
The other comprehensive income of Wesfarmers consists of the following items:
- Changes in the exchange rate of foreign currency
- Changes in fair value of the cash flow hedges
- Re-measurement of the defined benefit plan
- Tax effect on all the above (Wesfarmers Group)
Therefore we see that the other comprehensive income statement of both the companies have
reported similar items for the year ending 2017.
Reasons of reporting these items in other comprehensive income statement
The items which are recorded in the other comprehensive income represent the amount of
profit and losses that affect the financial statements of the company, but which have not been
realised yet (Girard, 2014). Since, the books are made on accrual basis, these items cannot be
reported in the profit and loss, but in order to meet up with the GAAP requirements, it is
important that they are shown in the books (Ittelson, 2009). Hence the other comprehensive
income shows these items. When they are realised, the relevant amounts are recognised in the
profit and loss statement (Lerner, 2009).
Comparative analysis of the items of both the companies
The other comprehensive income of Woolworths reported about $4.8 million for cash flow
hedge, and that of Wesfarmers reported $23 million. Woolworths reported about 6.9$million
in connection with the foreign exchange fluctuations and Wesfarmers reported $2 million.
The amount reported for changes in the provisions made for payments to employees by
12
⊘ This is a preview!⊘
Do you want full access?
Subscribe today to unlock all pages.
Trusted by 1+ million students worldwide
1 out of 20
Related Documents


Your All-in-One AI-Powered Toolkit for Academic Success.
+13062052269
info@desklib.com
Available 24*7 on WhatsApp / Email
![[object Object]](/_next/static/media/star-bottom.7253800d.svg)
Unlock your academic potential
Copyright © 2020–2026 A2Z Services. All Rights Reserved. Developed and managed by ZUCOL.