Corporate Finance: Stock Return and Market Return Relationship
VerifiedAdded on 2020/01/28
|9
|1985
|208
Report
AI Summary
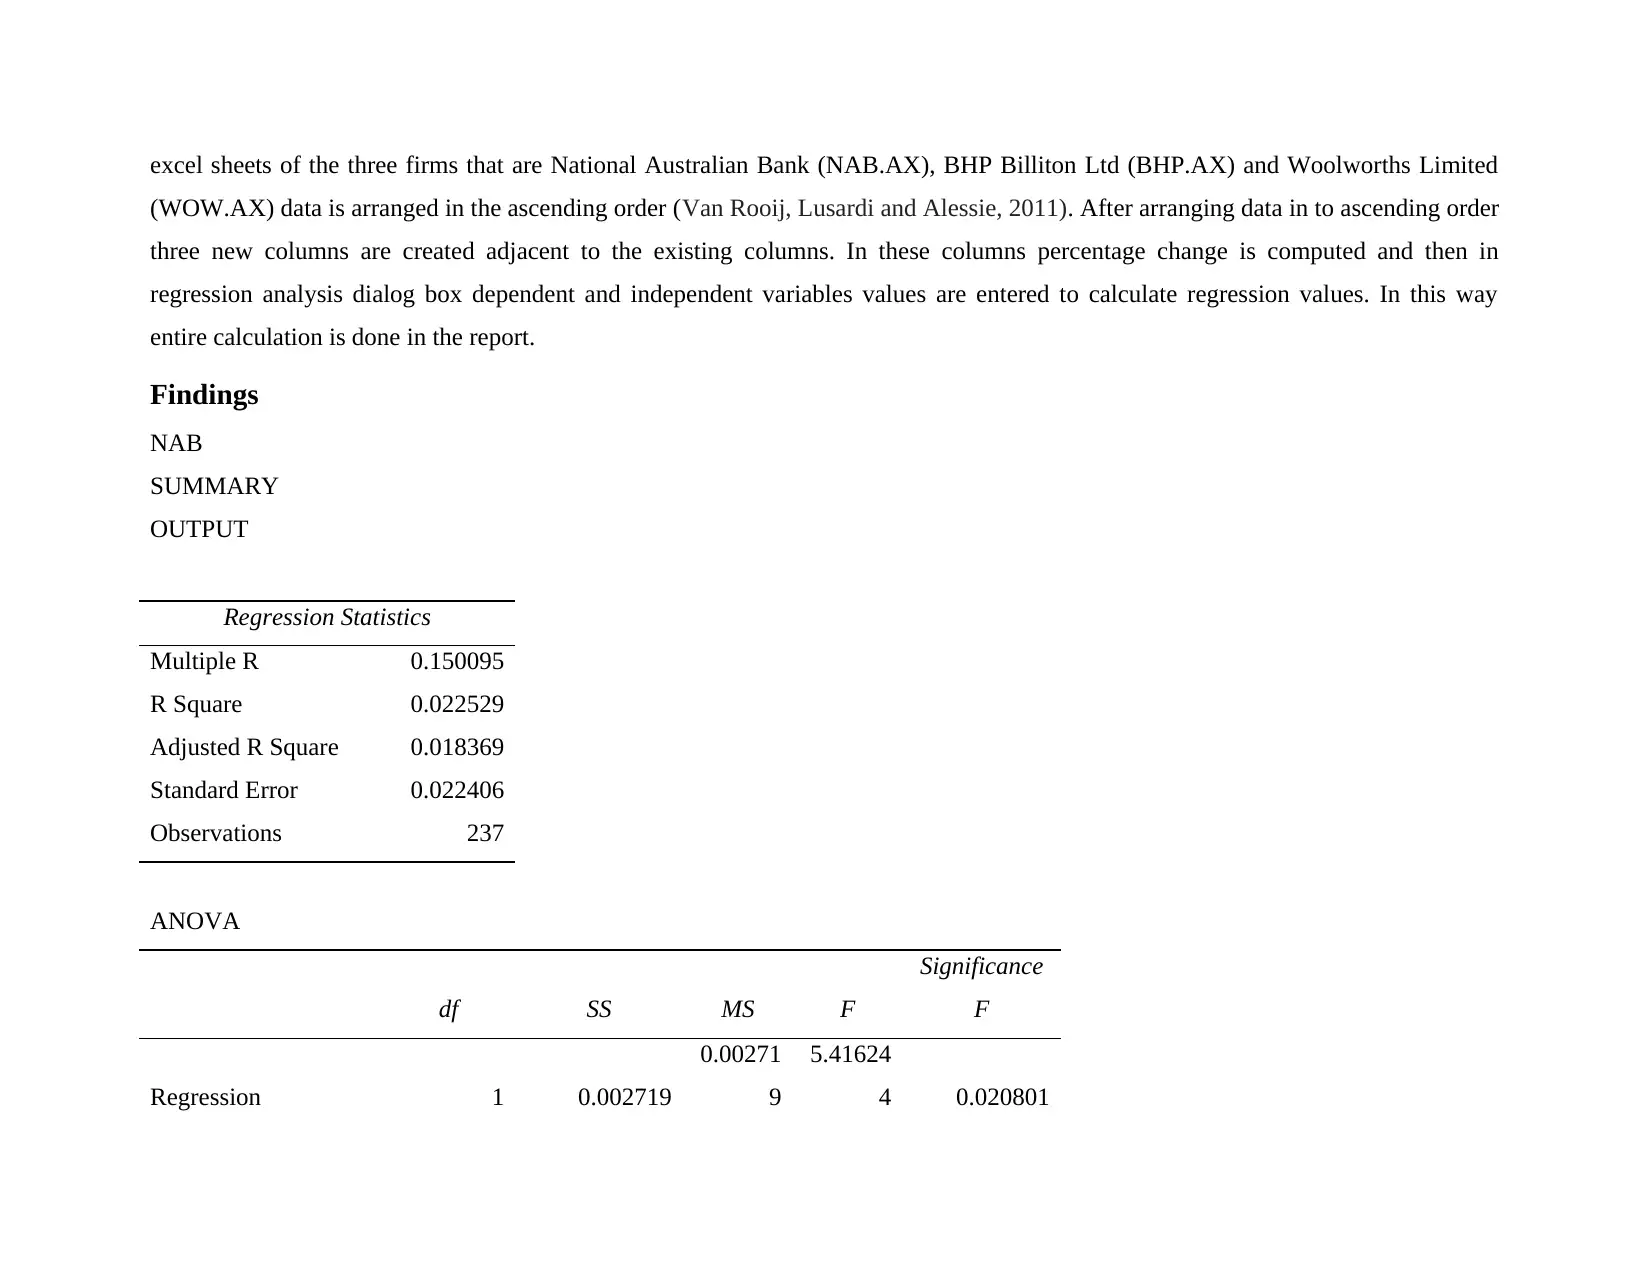
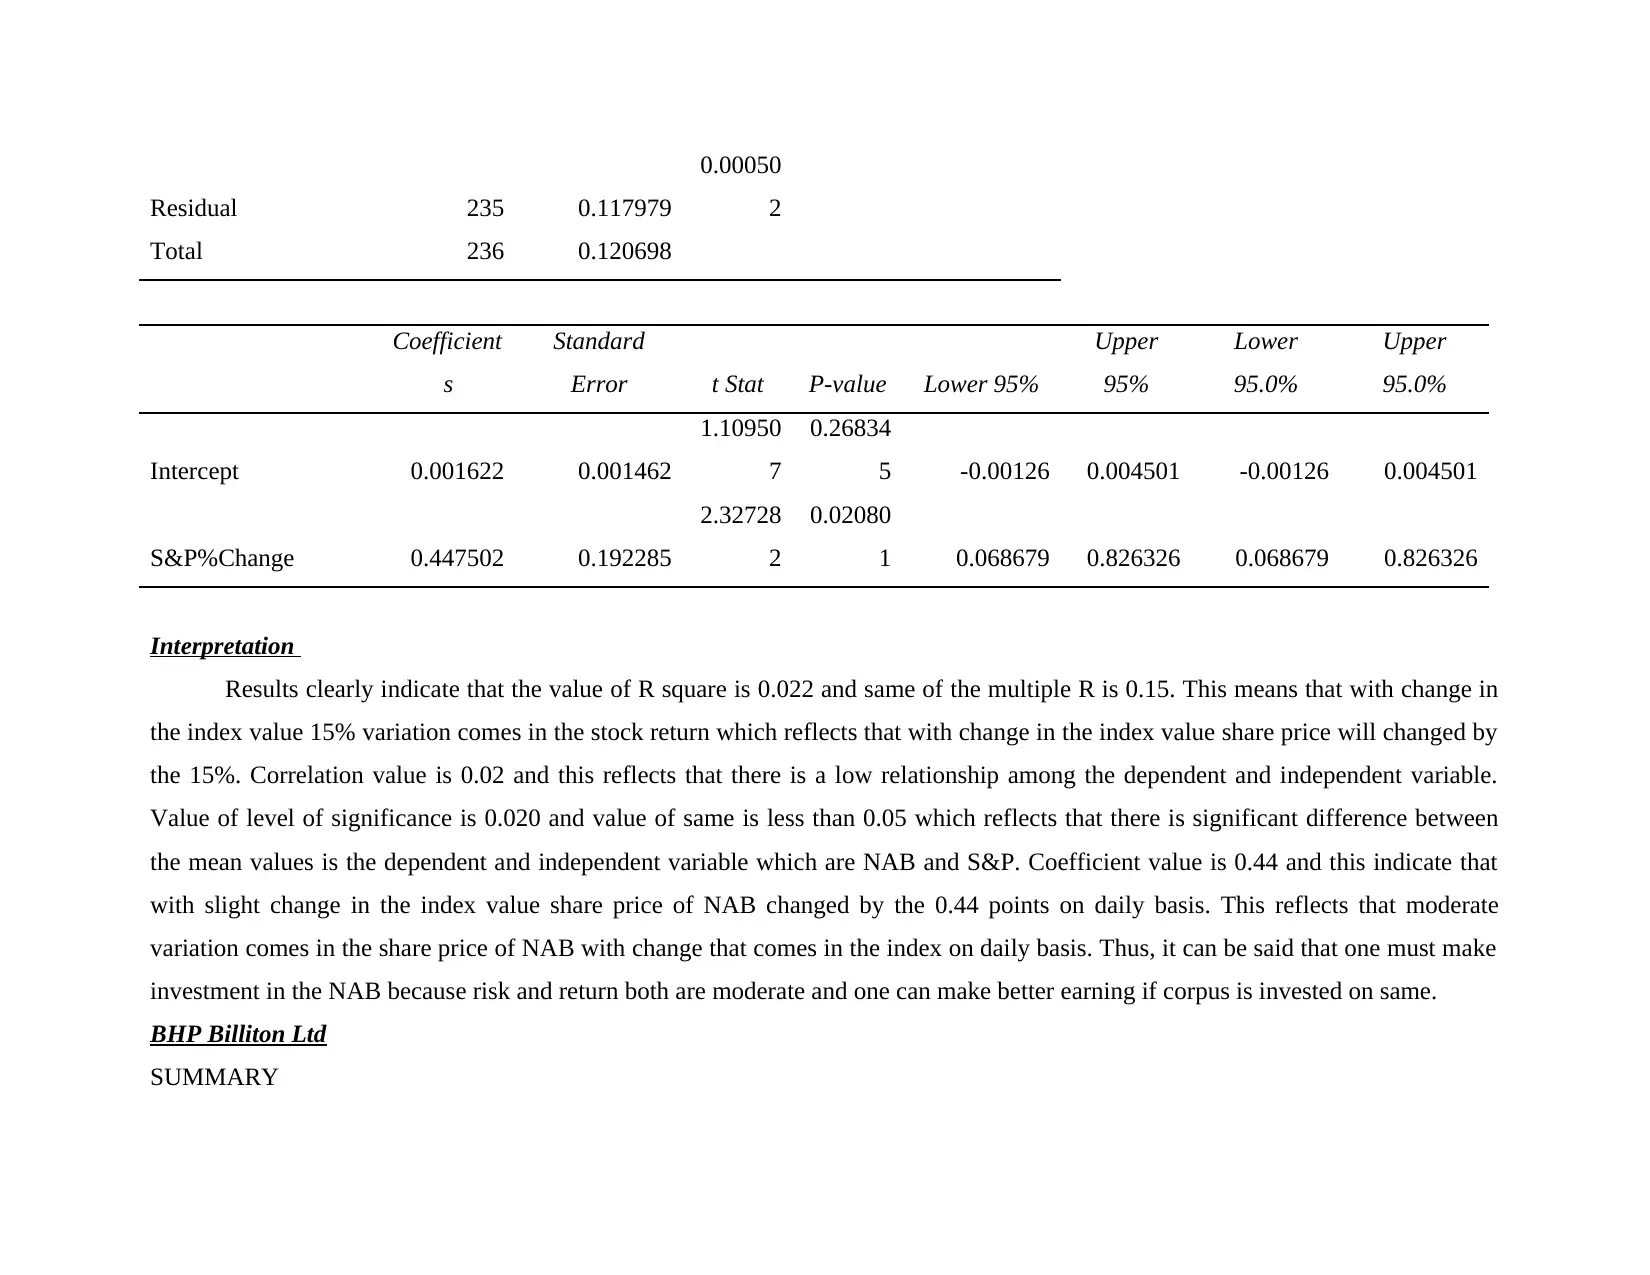
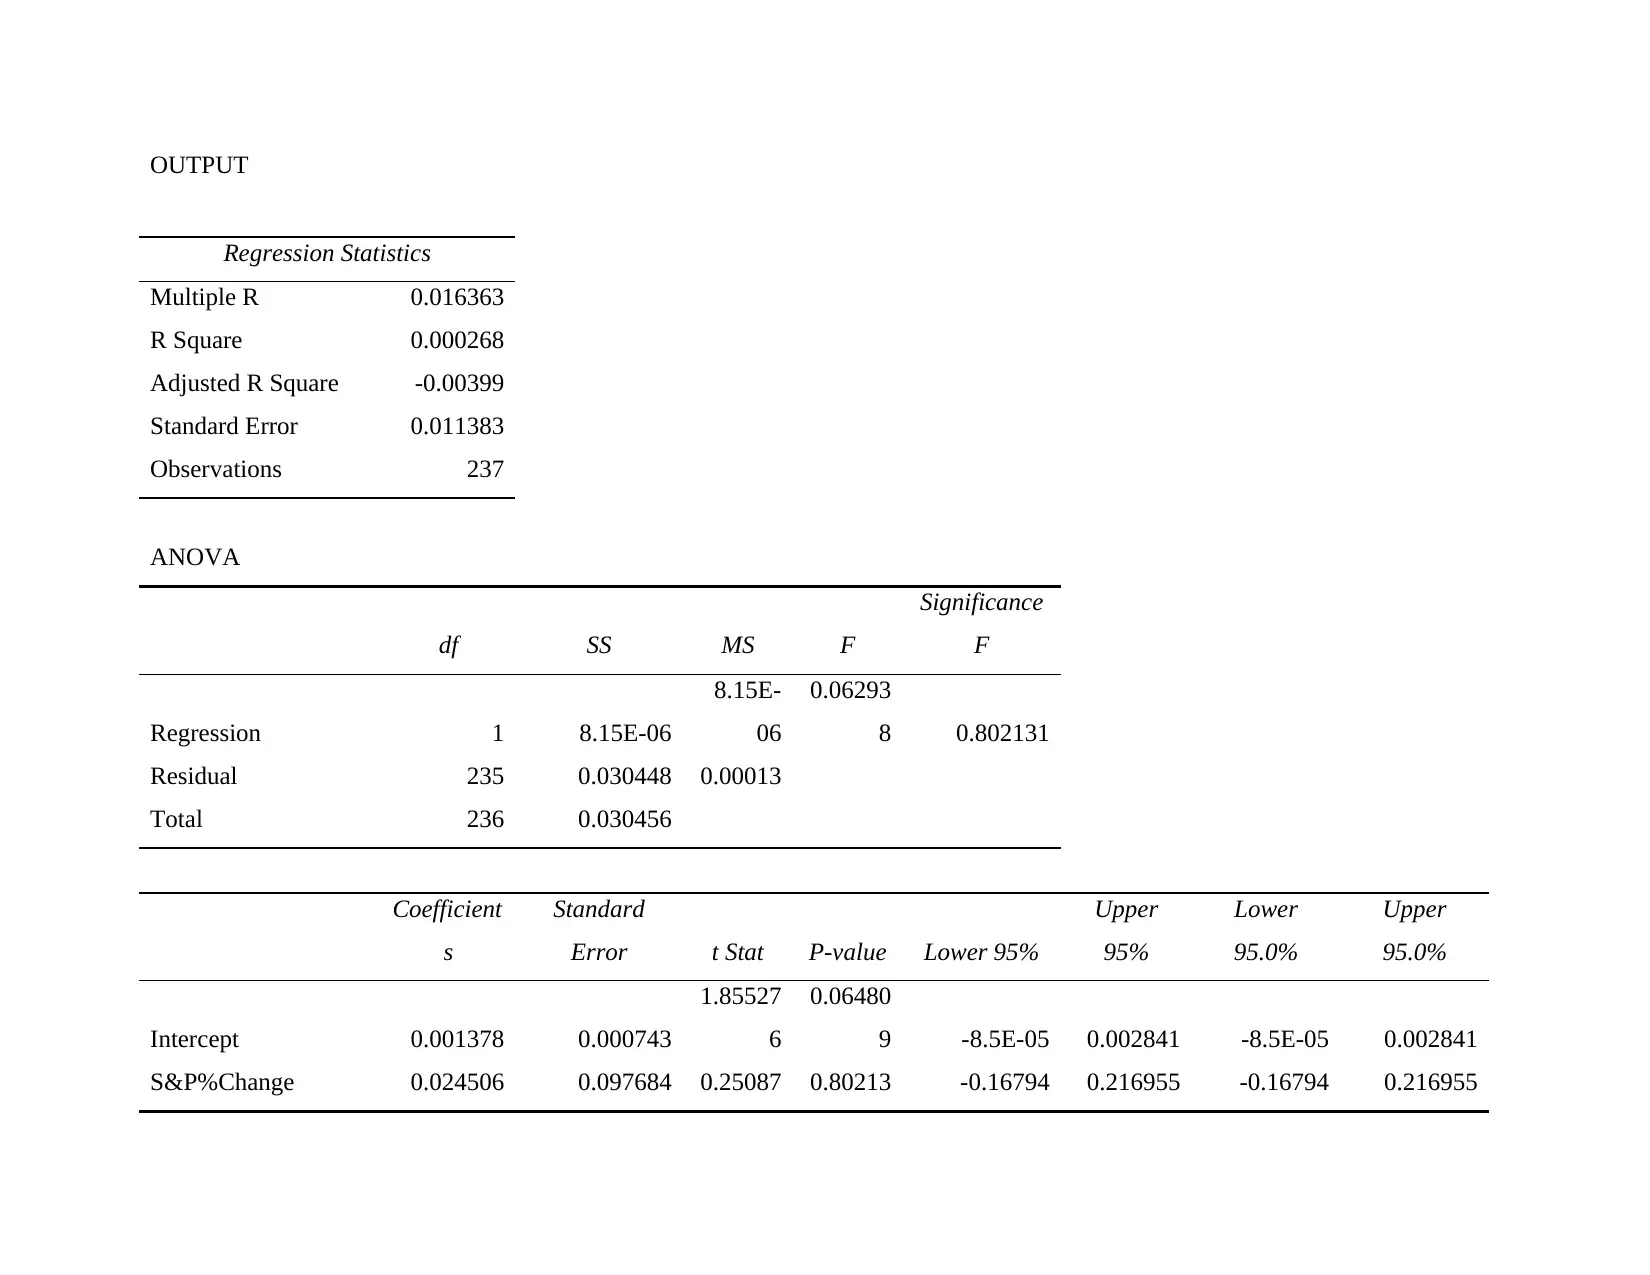
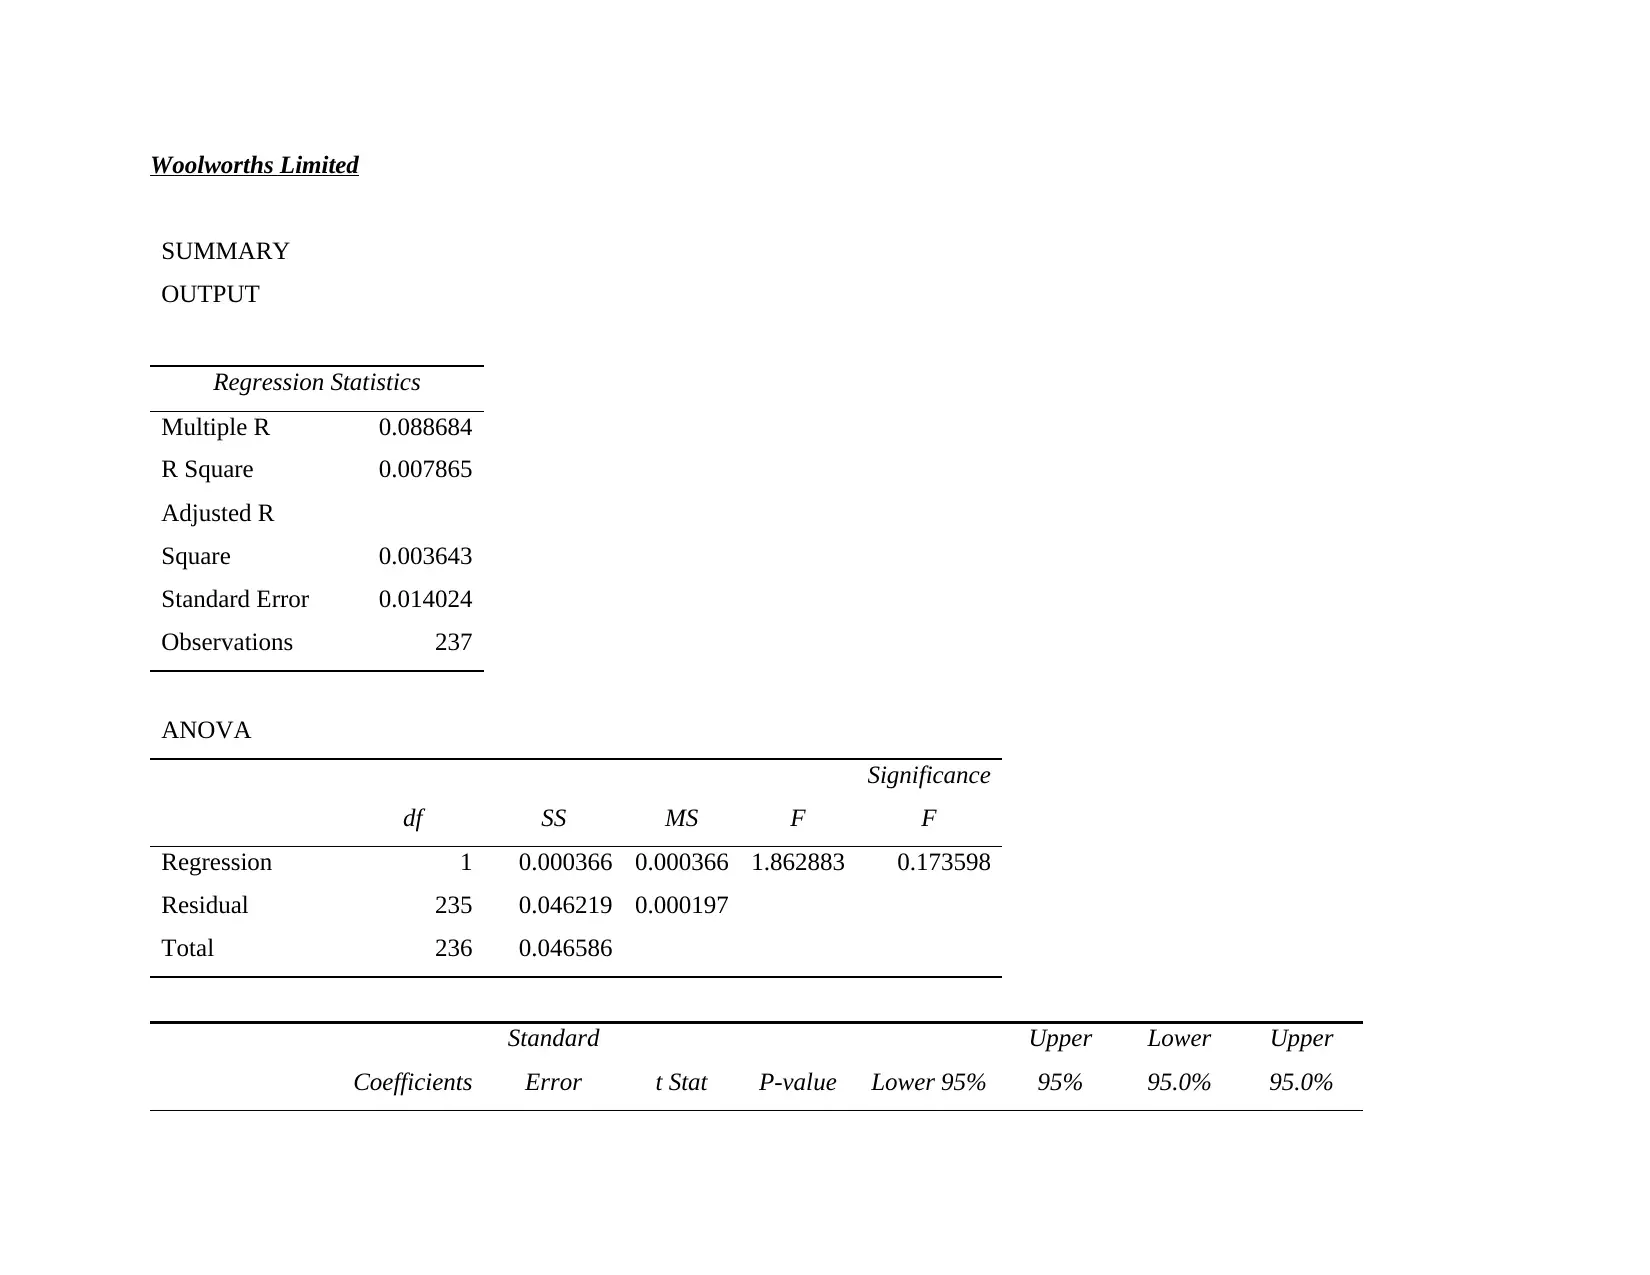
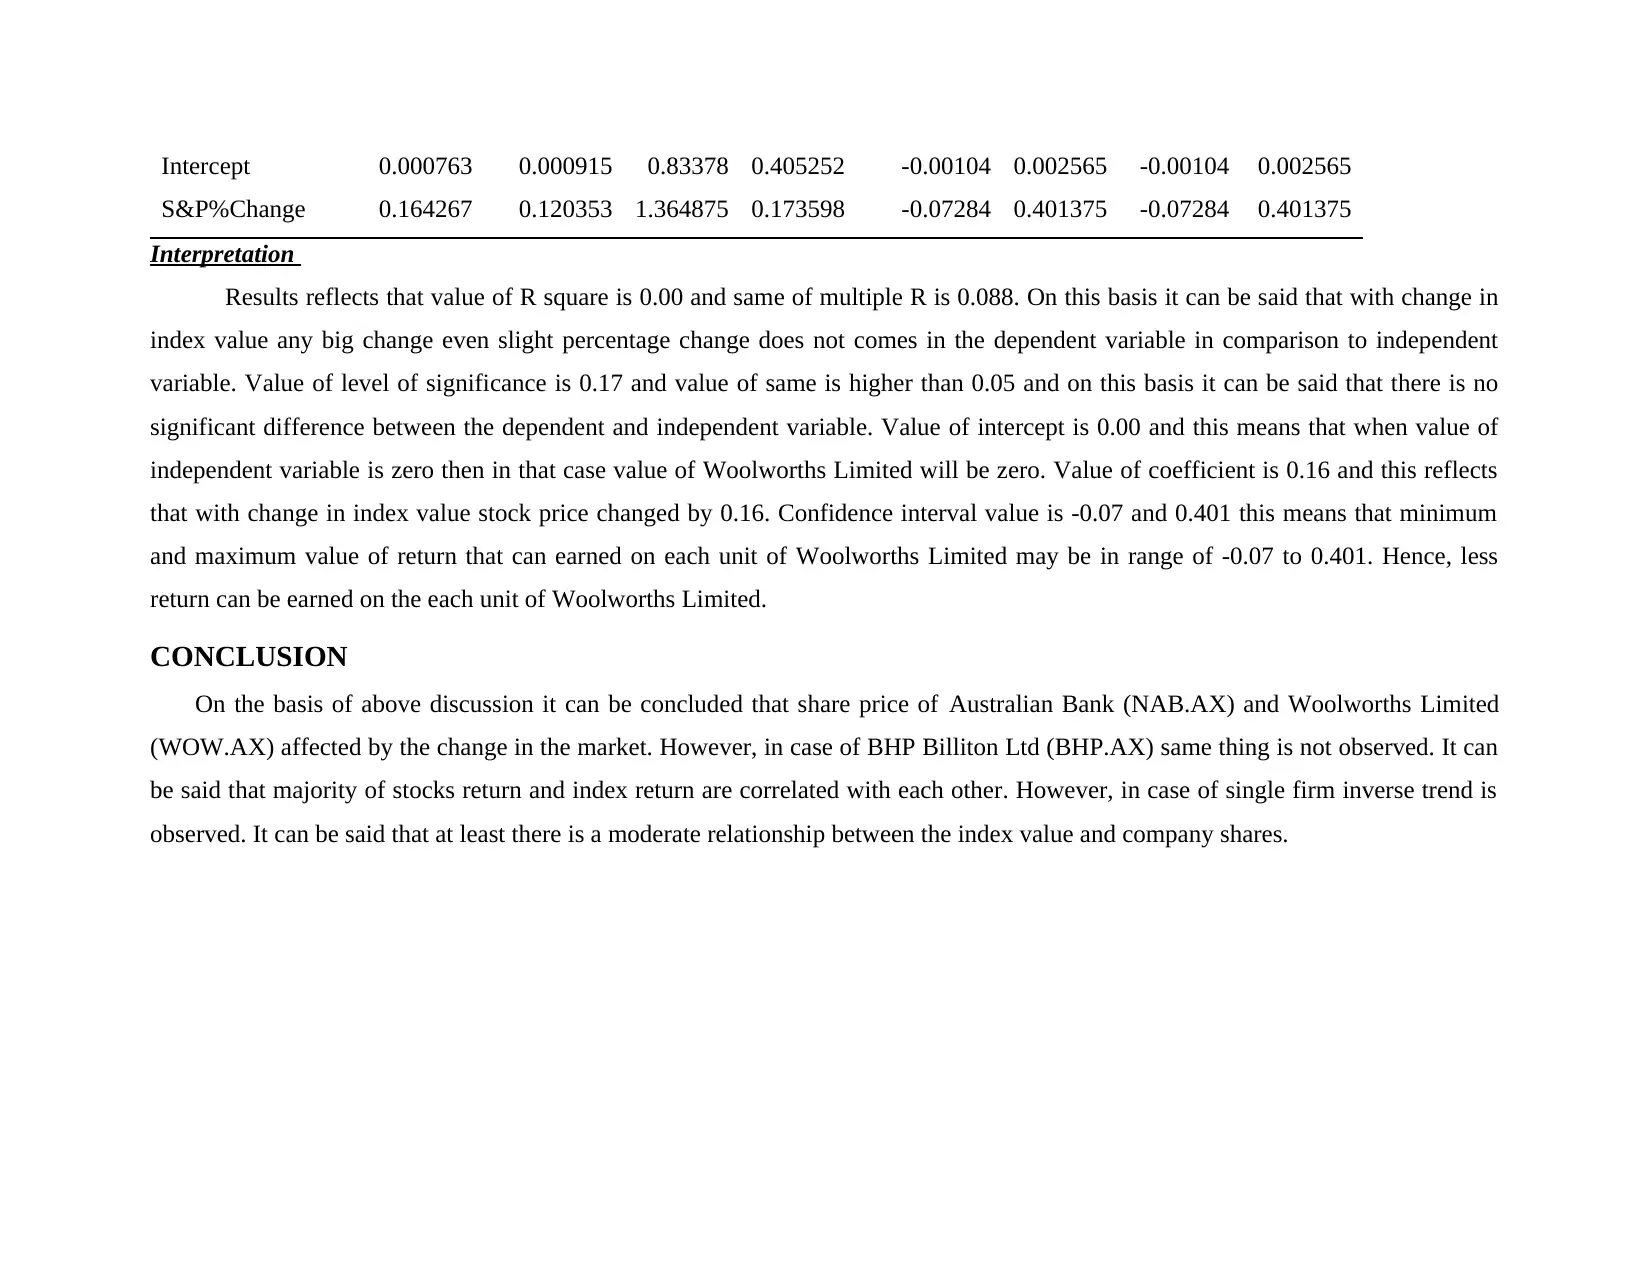
This report delves into the realm of corporate finance, employing regression models to assess the sensitivity of stock returns to market fluctuations. The methodology involves utilizing regression analysis to evaluate the performance of three firms: National Australian Bank (NAB.AX), BHP Billiton Ltd (BHP.AX), and Woolworths Limited (WOW.AX), using data sourced from Yahoo Finance. The findings reveal varying degrees of correlation between stock returns and market returns for each company. The analysis of NAB.AX indicates a moderate relationship, while BHP Billiton Ltd (BHP.AX) shows a very low correlation, and Woolworths Limited (WOW.AX) demonstrates a slight relationship. The report concludes that while most stocks exhibit a correlation with index returns, individual firm performance can deviate, emphasizing the importance of considering market dynamics in investment strategies. The report provides detailed interpretations of the regression results, including R-squared values, coefficients, and levels of significance, offering insights into the potential risks and returns associated with each stock.

CORPORATE FINANCE
Paraphrase This Document
Need a fresh take? Get an instant paraphrase of this document with our AI Paraphraser

TABLE OF CONTENTS
INTRODUCTION.......................................................................................................................................................................................3
Methodology................................................................................................................................................................................................3
Findings.......................................................................................................................................................................................................4
CONCLUSION............................................................................................................................................................................................8

INTRODUCTION
Corporate finance is the one of the vast domain in which shares related different calculations are performed by the investors make
business decisions. In the corporate finance there are number of methods that are used by the investors to make their investment
related decisions. In the current report, regression model is used to measure sensitivity of the stock return to the market return. There
is a strong interlink between the stock return and market return. This is because market return reflects the overall mood of the
investors. If market is increasing then it means then investors are bullish on the market are optimistic about uptrend in same. In same
way if market return is declining then it means that investors are pessimist about the future prospects. Each individual investor
whether it is HNI or retail investor consider this factor as a base to make investment decisions. Thus, on start of trading day if market
declined investors start selling their shares or do vice versa. This is the reason due to which return on the stocks is closely linked to the
market return. In the current report this theory is tested by applying the regression model. Results generated by the regression model is
interpreted and explained in detail. At last conclusion is formed on the basis of obtained results.
Methodology
In order to compute the values and to explore the relationship between the stock and index return regression model is used in the
present research study. Regression model that is used to evaluate the firm performance is 𝑅𝑖,t = α0 + β1𝑅𝑚,𝑡 + 𝜀𝑖,𝑡. In this model
Ri is the stock return which refers to the any company return in percentage terms for a specific duration. Relevant firm return data is
taken as dependent variable (Bollen, Mao. and Zeng, 2011). This is because the return that is generated by any company share is
highly dependent on the return that is generated by the index. On other hand, in the model Rm refers to the market return or
percentage gain or loss that is generated in the market index is taken in to account to compute values. Market return is taken as
independent variable. This is because it is not affected by any single company stock return. Value of alpha is reflecting the mean
return that can be earned or observed when value of independent variable become zero. Error term refers to the value by which actual
and observed results deviate. Data is collected from the Yahoo finance. In order to collect the data ticker symbol of the firms is
entered in to the search box and download option is clicked. By doing so excel sheet is generated from the website. After downloading
⊘ This is a preview!⊘
Do you want full access?
Subscribe today to unlock all pages.

Trusted by 1+ million students worldwide

excel sheets of the three firms that are National Australian Bank (NAB.AX), BHP Billiton Ltd (BHP.AX) and Woolworths Limited
(WOW.AX) data is arranged in the ascending order (Van Rooij, Lusardi and Alessie, 2011). After arranging data in to ascending order
three new columns are created adjacent to the existing columns. In these columns percentage change is computed and then in
regression analysis dialog box dependent and independent variables values are entered to calculate regression values. In this way
entire calculation is done in the report.
Findings
NAB
SUMMARY
OUTPUT
Regression Statistics
Multiple R 0.150095
R Square 0.022529
Adjusted R Square 0.018369
Standard Error 0.022406
Observations 237
ANOVA
df SS MS F
Significance
F
Regression 1 0.002719
0.00271
9
5.41624
4 0.020801
Paraphrase This Document
Need a fresh take? Get an instant paraphrase of this document with our AI Paraphraser

Residual 235 0.117979
0.00050
2
Total 236 0.120698
Coefficient
s
Standard
Error t Stat P-value Lower 95%
Upper
95%
Lower
95.0%
Upper
95.0%
Intercept 0.001622 0.001462
1.10950
7
0.26834
5 -0.00126 0.004501 -0.00126 0.004501
S&P%Change 0.447502 0.192285
2.32728
2
0.02080
1 0.068679 0.826326 0.068679 0.826326
Interpretation
Results clearly indicate that the value of R square is 0.022 and same of the multiple R is 0.15. This means that with change in
the index value 15% variation comes in the stock return which reflects that with change in the index value share price will changed by
the 15%. Correlation value is 0.02 and this reflects that there is a low relationship among the dependent and independent variable.
Value of level of significance is 0.020 and value of same is less than 0.05 which reflects that there is significant difference between
the mean values is the dependent and independent variable which are NAB and S&P. Coefficient value is 0.44 and this indicate that
with slight change in the index value share price of NAB changed by the 0.44 points on daily basis. This reflects that moderate
variation comes in the share price of NAB with change that comes in the index on daily basis. Thus, it can be said that one must make
investment in the NAB because risk and return both are moderate and one can make better earning if corpus is invested on same.
BHP Billiton Ltd
SUMMARY

OUTPUT
Regression Statistics
Multiple R 0.016363
R Square 0.000268
Adjusted R Square -0.00399
Standard Error 0.011383
Observations 237
ANOVA
df SS MS F
Significance
F
Regression 1 8.15E-06
8.15E-
06
0.06293
8 0.802131
Residual 235 0.030448 0.00013
Total 236 0.030456
Coefficient
s
Standard
Error t Stat P-value Lower 95%
Upper
95%
Lower
95.0%
Upper
95.0%
Intercept 0.001378 0.000743
1.85527
6
0.06480
9 -8.5E-05 0.002841 -8.5E-05 0.002841
S&P%Change 0.024506 0.097684 0.25087 0.80213 -0.16794 0.216955 -0.16794 0.216955
⊘ This is a preview!⊘
Do you want full access?
Subscribe today to unlock all pages.

Trusted by 1+ million students worldwide

4 1
Interpretation
Results are reflecting that R square valued at 0.00 and same of multiple R is 0.016. This reflects that there is a very low
relationship between index return and the return that is generated by BHP Billiton Ltd. This is further proved from the low value of R
square which is zero. Apart from this, value of level of significance is 0.80 which is greater than 0.05 which reflects that there is no
significant mean difference between mean values of the variable. Adjusted R square value is -0.00 and this means that if any new
variable will be added in the model negative return will be generated. Intercept value is 0.00 which reflects that there will be zero
return when index value will be zero. Coefficient value is 0.024 and this means that with slight change in the index value stock return
is changed by the 0.024. It can be observed that value of confidence interval is in range of -0.16 to 0.21 and this means that at specific
mean value and at 95% confidence interval return on BHP Billiton Ltd shares per unit may be in range of -0.16 to 0.21.
Paraphrase This Document
Need a fresh take? Get an instant paraphrase of this document with our AI Paraphraser

Woolworths Limited
SUMMARY
OUTPUT
Regression Statistics
Multiple R 0.088684
R Square 0.007865
Adjusted R
Square 0.003643
Standard Error 0.014024
Observations 237
ANOVA
df SS MS F
Significance
F
Regression 1 0.000366 0.000366 1.862883 0.173598
Residual 235 0.046219 0.000197
Total 236 0.046586
Coefficients
Standard
Error t Stat P-value Lower 95%
Upper
95%
Lower
95.0%
Upper
95.0%

Intercept 0.000763 0.000915 0.83378 0.405252 -0.00104 0.002565 -0.00104 0.002565
S&P%Change 0.164267 0.120353 1.364875 0.173598 -0.07284 0.401375 -0.07284 0.401375
Interpretation
Results reflects that value of R square is 0.00 and same of multiple R is 0.088. On this basis it can be said that with change in
index value any big change even slight percentage change does not comes in the dependent variable in comparison to independent
variable. Value of level of significance is 0.17 and value of same is higher than 0.05 and on this basis it can be said that there is no
significant difference between the dependent and independent variable. Value of intercept is 0.00 and this means that when value of
independent variable is zero then in that case value of Woolworths Limited will be zero. Value of coefficient is 0.16 and this reflects
that with change in index value stock price changed by 0.16. Confidence interval value is -0.07 and 0.401 this means that minimum
and maximum value of return that can earned on each unit of Woolworths Limited may be in range of -0.07 to 0.401. Hence, less
return can be earned on the each unit of Woolworths Limited.
CONCLUSION
On the basis of above discussion it can be concluded that share price of Australian Bank (NAB.AX) and Woolworths Limited
(WOW.AX) affected by the change in the market. However, in case of BHP Billiton Ltd (BHP.AX) same thing is not observed. It can
be said that majority of stocks return and index return are correlated with each other. However, in case of single firm inverse trend is
observed. It can be said that at least there is a moderate relationship between the index value and company shares.
⊘ This is a preview!⊘
Do you want full access?
Subscribe today to unlock all pages.

Trusted by 1+ million students worldwide
1 out of 9
Related Documents

Your All-in-One AI-Powered Toolkit for Academic Success.
+13062052269
info@desklib.com
Available 24*7 on WhatsApp / Email
Unlock your academic potential
© 2024 | Zucol Services PVT LTD | All rights reserved.