Corporate Finance Assessment 3: Case Study Analysis

Verified

Added on  2021/04/21

|8
|1614
|63
Case Study
AI Summary
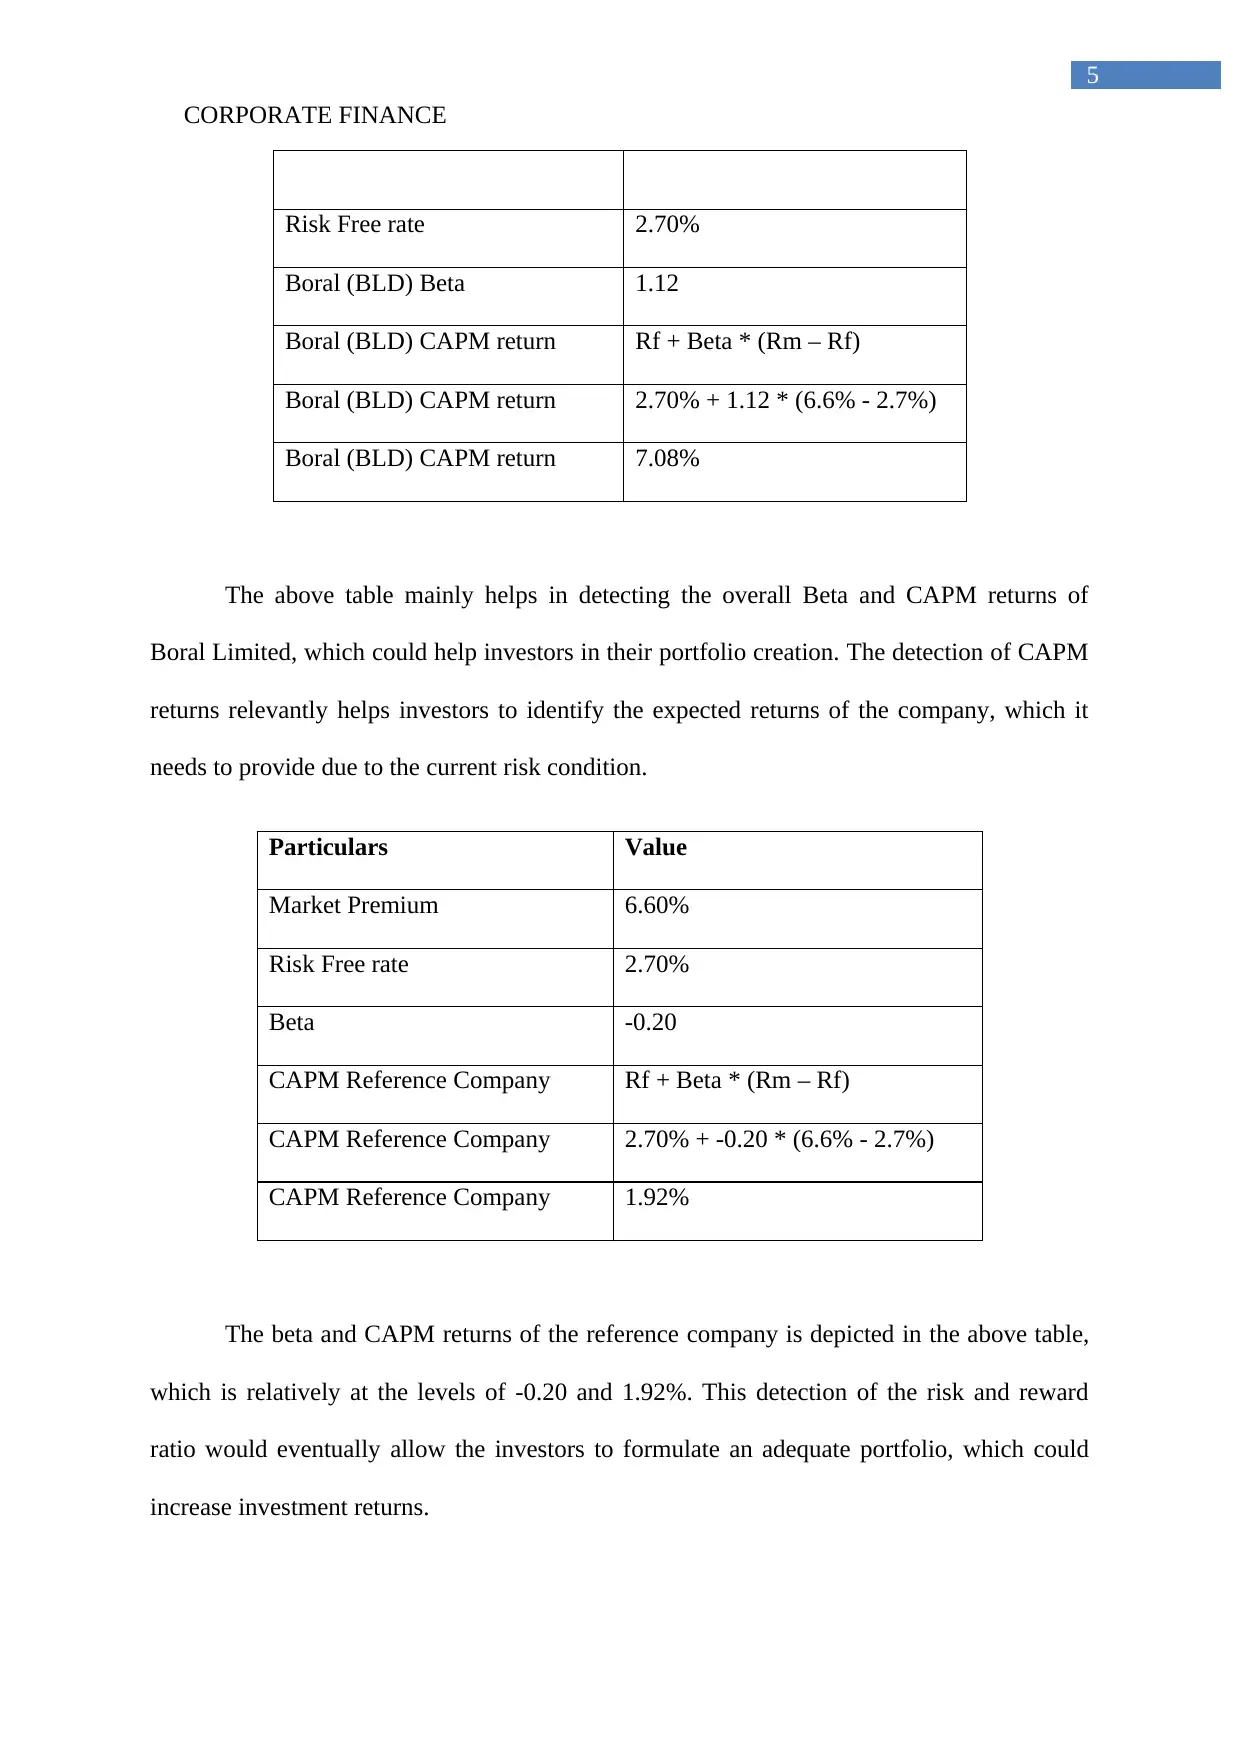
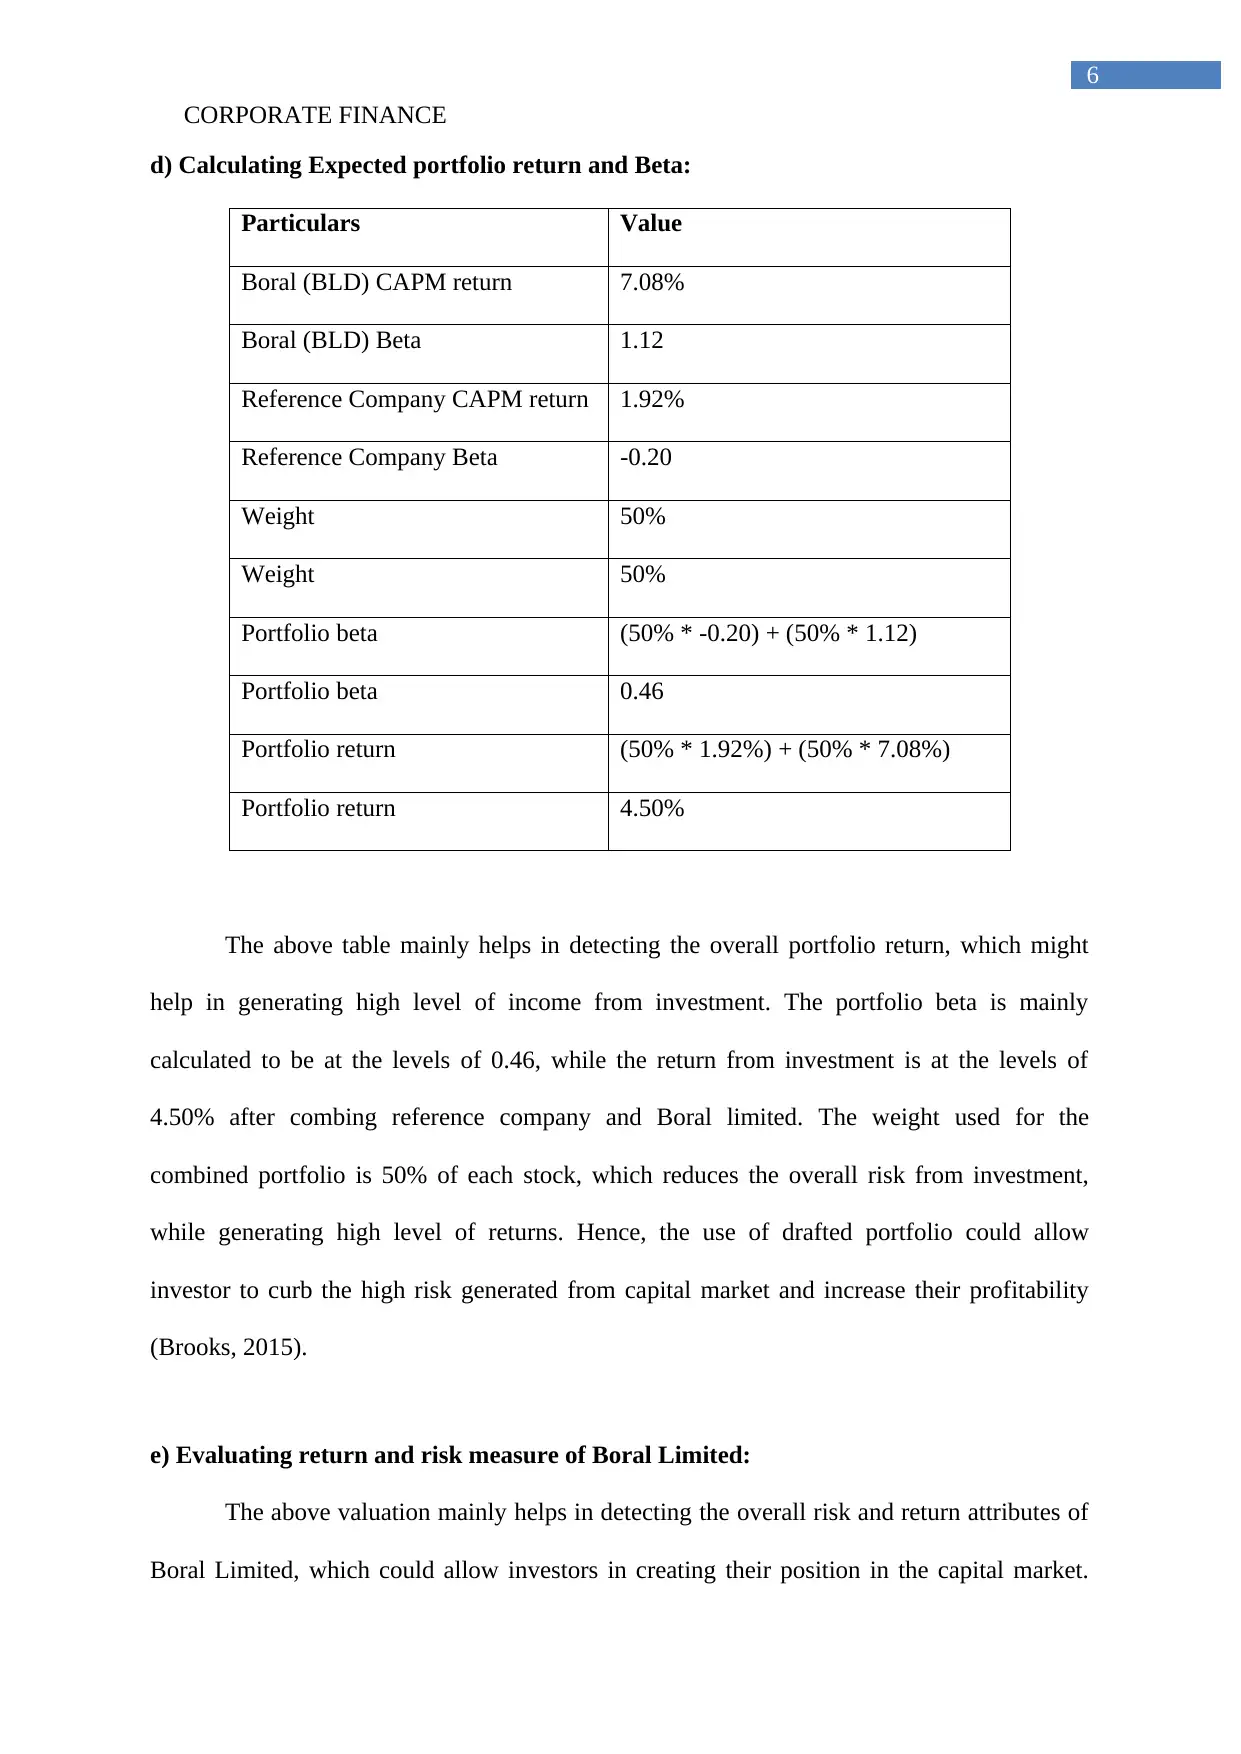
This case study analyzes the financial performance of Boral Limited and a reference company, focusing on risk and return metrics. It calculates historical monthly returns for the market index, Boral (BLD), and the reference company, along with their respective standard deviations and average rates of return. The analysis extends to portfolio calculations, determining the historical standard deviation and average rate of return for a portfolio composed of Boral (BLD) and the reference company. The study then applies the Capital Asset Pricing Model (CAPM) to both Boral (BLD) and the reference company to determine expected returns. Furthermore, it calculates the expected portfolio return and beta, providing insights into portfolio risk and return characteristics. The evaluation concludes with an assessment of the return and risk measures of Boral Limited, offering a comprehensive financial analysis. The findings highlight the importance of risk-return relationships and portfolio diversification in financial decision-making, supported by relevant academic references.
Document Page
Running head: CORPORATE FINANCE
Corporate Finance
Name of the Student:
Name of the University:
Authors Note:
tabler-icon-diamond-filled.svg

Paraphrase This Document

Need a fresh take? Get an instant paraphrase of this document with our AI Paraphraser
Document Page
CORPORATE FINANCE
1
Table of Contents
Assessment 3: Task for Case Study 1........................................................................................2
a.1) Calculating the historical monthly return for the market index:.........................................2
a.2.i) Calculating the historical standard deviation and average rate of return of returns for
Boral (BLD):..............................................................................................................................2
a.2.ii) Calculating the historical standard deviation and average rate of returns for reference
company:....................................................................................................................................3
a.2.iii) Calculating the historical standard deviation and average rate of returns for the market
index:..........................................................................................................................................3
b) Calculating the historical standard deviation and average rate of the portfolio:...................4
c) CAPM calculation for Boral (BLD) and reference company:...............................................4
d) Calculating Expected portfolio return and Beta:...................................................................6
e) Evaluating return and risk measure of Boral Limited:...........................................................6
Reference and Bibliography:......................................................................................................8
Document Page
CORPORATE FINANCE
2
Assessment 3: Task for Case Study 1
a.1) Calculating the historical monthly return for the market index:
Date All Ords Accumulated Return
Sep,2017 55,459.750
Oct,2017 57,712.860 4.0626%
Nov,2017 58,813.500 1.9071%
Dec,2017 60,007.770 2.0306%
Jan,2018 59,809.190 -0.3309%
Feb,2018 59,916.010 0.1786%
a.2.i) Calculating the historical standard deviation and average rate of return of returns
for Boral (BLD):
Date Boral (BLD)
Sep,2017
Oct,2017 5.613%
Nov,2017 5.175%
Dec,2017 3.950%
Jan,2018 2.696%
Feb,2018 -0.813%
Average returns 3.324%
Standard deviation 2.58%
Document Page
CORPORATE FINANCE
3
a.2.ii) Calculating the historical standard deviation and average rate of returns for
reference company:
Date Reference Company
Sep,2017
Oct,2017 -8.000%
Nov,2017 -2.000%
Dec,2017 7.000%
Jan,2018 -2.000%
Feb,2018 6.000%
Average returns 0.200%
Standard deviation 6.26%
a.2.iii) Calculating the historical standard deviation and average rate of returns for the
market index:
Date All Ords Accumulated
Sep,2017
Oct,2017 4.063%
Nov,2017 1.907%
Dec,2017 2.031%
Jan,2018 -0.331%
Feb,2018 0.179%
Average returns 1.570%
Standard deviation 1.74%
tabler-icon-diamond-filled.svg

Paraphrase This Document

Need a fresh take? Get an instant paraphrase of this document with our AI Paraphraser
Document Page
CORPORATE FINANCE
4
b) Calculating the historical standard deviation and average rate of the portfolio:
Date Boral (BLD) Reference
Company
Portfolio Portfolio
Sep,2017
Oct,2017 5.613% -8.000% (50% * 5.613%) + (50% * -8%) -1.194%
Nov,2017 5.175% -2.000% (50% * 5.175%) + (50% * -2%) 1.588%
Dec,2017 3.950% 7.000% (50% * 3.950%) + (50% * 7%) 5.475%
Jan,2018 2.696% -2.000% (50% * 2.696%) + (50% * -2%) 0.348%
Feb,2018 -0.813% 6.000% (50% * -0.813%) + (50% * 6%) 2.594%
Average returns 1.762%
Standard deviation 2.51%
The calculations conducted in the table helps in detecting the returns and risk
attributes of the portfolio, which is created from the combination of reference company and
Boral Limited. Furthermore, the calculation mainly helps in detecting the average returns of
1.762% for the portfolio with a standard deviation of 2.51%. This relatively indicates the
overall risk and return condition of the portfolio, which could help investors in increasing
their return from investment. The risk condition of the portfolio is relatively low, while the
return is adequate which would help investors in increasing the risk- return ratio. According
to Arnold & Yildiz (2015), evaluation of risk condition of the stock could eventually allow
investors to formulate an adequate portfolio, which has low risk and high return.
c) CAPM calculation for Boral (BLD) and reference company:
Particulars Value
Market Premium 6.60%
Document Page
CORPORATE FINANCE
5
Risk Free rate 2.70%
Boral (BLD) Beta 1.12
Boral (BLD) CAPM return Rf + Beta * (Rm – Rf)
Boral (BLD) CAPM return 2.70% + 1.12 * (6.6% - 2.7%)
Boral (BLD) CAPM return 7.08%
The above table mainly helps in detecting the overall Beta and CAPM returns of
Boral Limited, which could help investors in their portfolio creation. The detection of CAPM
returns relevantly helps investors to identify the expected returns of the company, which it
needs to provide due to the current risk condition.
Particulars Value
Market Premium 6.60%
Risk Free rate 2.70%
Beta -0.20
CAPM Reference Company Rf + Beta * (Rm – Rf)
CAPM Reference Company 2.70% + -0.20 * (6.6% - 2.7%)
CAPM Reference Company 1.92%
The beta and CAPM returns of the reference company is depicted in the above table,
which is relatively at the levels of -0.20 and 1.92%. This detection of the risk and reward
ratio would eventually allow the investors to formulate an adequate portfolio, which could
increase investment returns.
Document Page
CORPORATE FINANCE
6
d) Calculating Expected portfolio return and Beta:
Particulars Value
Boral (BLD) CAPM return 7.08%
Boral (BLD) Beta 1.12
Reference Company CAPM return 1.92%
Reference Company Beta -0.20
Weight 50%
Weight 50%
Portfolio beta (50% * -0.20) + (50% * 1.12)
Portfolio beta 0.46
Portfolio return (50% * 1.92%) + (50% * 7.08%)
Portfolio return 4.50%
The above table mainly helps in detecting the overall portfolio return, which might
help in generating high level of income from investment. The portfolio beta is mainly
calculated to be at the levels of 0.46, while the return from investment is at the levels of
4.50% after combing reference company and Boral limited. The weight used for the
combined portfolio is 50% of each stock, which reduces the overall risk from investment,
while generating high level of returns. Hence, the use of drafted portfolio could allow
investor to curb the high risk generated from capital market and increase their profitability
(Brooks, 2015).
e) Evaluating return and risk measure of Boral Limited:
The above valuation mainly helps in detecting the overall risk and return attributes of
Boral Limited, which could allow investors in creating their position in the capital market.
tabler-icon-diamond-filled.svg

Paraphrase This Document

Need a fresh take? Get an instant paraphrase of this document with our AI Paraphraser
Document Page
CORPORATE FINANCE
7
The derivation of the risk and return is detected from the evaluation of returns, which is
provided by Boral Limited for the period of five months. In addition, the risk condition of
Boral limited is at the levels of 1.12, which is relatively high in comparison with capital
market. The beta of 1.2 is relatively more than one, which depicts stock volatility against
market and its capital to generate returns. This high beta of the company mainly indicates the
relevant risk traits that might hamper its capability to provide adequate returns. In this
context, Neely et al., (2014) mentioned that with the help of beta calculation investors can
create their position, which comprises of low risk and high return. On the other hand,
Gagliardini, Ossola & Scaillet (2016) criticises that risk condition of stock and position
changes with the situation in the market, which hampers profit generating capability of the
investor.
In addition, the return provided by Boral Limited derived from the valuation of
CAPM is at the level of 7.08%, which is relatively high due to the high-risk position of the
company. This CAPM return is mainly an expected return, which needs to be generated by
the company, due to high risk condition of the firm. Moreover, the non-fulfilment of the
expected return might increase risk position and devalue shares of the company. Therefore,
investor might use Boral Limited to increase the portfolio return, as the stock has high level
of return generating capability. Hence, the risk return relationship of the company is
adequate, which can allow investor to formulate accurate portfolio with high return and low
risk (Lettau, Maggiori & Weber, 2014).
chevron_up_icon
1 out of 8
circle_padding
hide_on_mobile
zoom_out_icon
[object Object]