Corporate Finance: Analysis of Telstra Corporation Limited
VerifiedAdded on 2020/12/30
|10
|3110
|152
Report
AI Summary
This report provides a comprehensive analysis of corporate finance principles, focusing on risk return analysis and financial statement analysis. It begins with an introduction to corporate finance and its role in organizational decision-making and investment planning. The report then delves into risk return analysis, differentiating between systematic and unsystematic risks and exploring the factors influencing risk-free rates of return. A significant portion of the report is dedicated to a case study of Telstra Corporation Limited, assessing its risk factors, efficiency ratios, and market data. The analysis includes a detailed examination of Telstra's financial statements, including the income statement, balance sheet, and cash flow statement, providing insights into the company's profitability, assets, liabilities, and cash flow operations. The report concludes with an overview of Telstra's financial performance, including key metrics such as ROE, return on assets, and solvency scores, offering a holistic view of its financial health.

CORPORATE FINANCE
Paraphrase This Document
Need a fresh take? Get an instant paraphrase of this document with our AI Paraphraser
Table of Contents
INTRODUCTION...........................................................................................................................1
3.22 Risk return analysis.............................................................................................................1
3.24 financial statements analysis...............................................................................................4
CONCLUSION................................................................................................................................6
REFERENCES................................................................................................................................8
INTRODUCTION
Corporate finance is a section of analysis of financial stability and consistency of
organisation in terms of making the decisions and investment plans. It mainly deals with the
sources of funding and build up the capital structure for make the market position more string
and effective (Brealey, 2012). There are some actions and plans prepared on the basis of critical
analysis of financial position and market structure of organisation. It is one of the essential.
Corporate financial analysis mainly associated with analysing the scope and managing the
functional departments of organisation in well planned manner. Type of strategies and
techniques are used to interpret and evaluate in organisational context.
3.22 Risk return analysis
Risk return analysis
Analysis of profit estimation, gain or losses are considered in organisational context and
the risk free rate is calculated for deriving the strategies and plans for investing the amount in
organisation. There are kind of strategies and plans are defined in respect of formulation of
determine and managing the risk assessment. In order to determine the risk free rate of return is
analysed subject to gather the information which is expected to capital markets and number of
factors are influenced as return. Risk mainly indicates towards change in rate of taxes and the
rates which remain associated with fluctuations of returns on investment. The difference between
the actual return and the expected return are considered while analysing the profitability and risk
free rate with in business environment (Coles, Lemmon and Meschke, 2012).
Possibility of gaining of losses and profitability are the essential aspects in terms of
original return and risk free rate. As per the concept of sustainable investment the low level
uncertainties contains low potential risk and the high uncertainties level of risk contains the high
potential risk. Apart form it is considered that high profit expectations remain associated with
high potential risks and the low profit possibilities remain associated with low potential risk
within the organisation. There are type of information and profit analysis is found through which
investors conclude the results of risk free rate and multiple sections related to completion of
formation of task and projects. There are two type of risk found in risk analysis which are as
follows;
Systematic risk: it is also known as market risk or undiversified risk and systematic risk
is the uncertainties and inherent to the entire market segment. Also refereed as volatility and
1
⊘ This is a preview!⊘
Do you want full access?
Subscribe today to unlock all pages.
Trusted by 1+ million students worldwide
systematic risk mainly defines day to day fluctuations within a stock price of stock. Stability of
investment also defined in organisational context and in the behaviour. Market movement and
fluctuations are also considered in organisational context. This also remain associated with
defining the essential returns and unstable the investment and more options to dramatic change in
either direction (Huang and Kisgen, 2013).
Unsystematic risk: this is also considered as a specific risk which defines the diversified
risk or residual risk and uncertainties comes across the organisations. Under this, the amount of
risk is evaluated with the help of reduction in diversification. For example organisation which
mainly remain associated with deriving the possibilities and the changes in specific manner are
analysed effectively and measured in wide context.
Risk assessment of Telstra corporation limited
This is the branch of section which contains the details in terms of managing the
operations and management of organisation. It is important to analyse the risk factor which
remain associated with organisation in terms of exploring the business next level. There are type
of sectors are analysed in terms of managing the the risk and market analysis in respect of Telstra
organisation. It is concluded that the organisation defended the market price and evaluation of
competitive market in business environment. Risk analysis is mainly associated with efficiency
ratio of -0.2786 which shows the return of -0.2786% of return per unit over the last 1 month.
There is a macro-axis philosophy towards evaluating the factors of risk of stock which is
observed both organised and unorganized manner with in the organisation. By considering the
market data and evaluation of risk analysis market data and technical indicators are also
considered in risk return analysis (Ehrhardt and Brigham, 2016).
Telstra corporation limited express the evaluate the volatility that remain diversified in
organisational context. As per statistical analysis it is analysed that Telstra coefficient of
variation of 936.08 and risk adjusted performance was calculated as 0.01 in respect of confirm
risk and estimated provided. As per analysis of start index for execution are also defined in
Telstra context. As per the beta analysis there are type of aspects are defined such as the
coefficient of variation of Telstra is calculated as -358.99 and the day to day return was
calculated as 3.2 variance and the standard deviation was measured as 1.79. the mean deviation
of Telstra corporation limited was recently evaluated as 1.22 subject to similar horizon. There are
benchmarks also set in terms of managing the operations and management of organisation. It was
2
Paraphrase This Document
Need a fresh take? Get an instant paraphrase of this document with our AI Paraphraser
assumed by the organisation that he actual return volatility was evaluated as 1.7888% of return
over the 30 days as investment horizon also defined in organisational context. DOW inherits was
evaluated 0.0% risk subject to 30 days horizon (Molot, 2014).
As per analysis of ROE it is analysed that organisation is mainly calculated as 12 months
performance with the average of 24.38% subject to same period. There are type of investors and
financiers are also analysed in in analysis of ROE. Break down return on equity was evaluated as
basic calculation in terms of net income as a percentage of total capital committed by
stakeholders and equity stakeholders. The North ROE was evaluated as 20% return on every
dollar invested.
There is an analysis also done in respect of debt holders who was driving by investing in
debt market. Expected return to account for market risk defined in respect of equity investors
show their potential interest towards minimising the risk and generating the high profitability and
capital market. Market risk also be derived towards the capital asset pricing models and the TLS
was recorded as 8.43% and ROE was recorded as 25.2%.
As per the analysis of historical debt it is observed that the leverage was evaluated as debt
equity profile and rapidly rising debt compared to equity. Profit margin and assets turnover also
measured as underperformed raised a red flag on the return on capital employed. Most of the
tasks and the corporate changes were continuously seen in TLS in terms of long term debt
financing and the assets turnover. Moreover it is observed that there are favourable aspects and
results are seen in respect of defining the profitability of organisation.
As per profitability records it is considered that return on equity was evaluated as 25% at
present and the 5 year's average return on equity was evaluated as 31.7% and the median sector
was evaluated as 14.0% and the country median was evaluated as 12.9%. return on assets was
evaluated as 8.9% and five year's average profitability was evaluated as 31.7% sector median
was calculated as 4.9% and country median was calculated as 6.8%. solvency score presents
favourable aspects in terms of current position and last five year's position of organisation.
Return on assets% was considered essential in terms of making the country effective as 436.7,
sector median was calculated as 533.8 and country median was evaluated as 506.4. assets/equity
was evaluated as 2.9 which was also the same for the last three years, as per individual long
terms assets and analysis also done in respect of defining the long term debt and equity was also
evaluated in organisational context. 1.0 was calculated in present time and last five years average
3
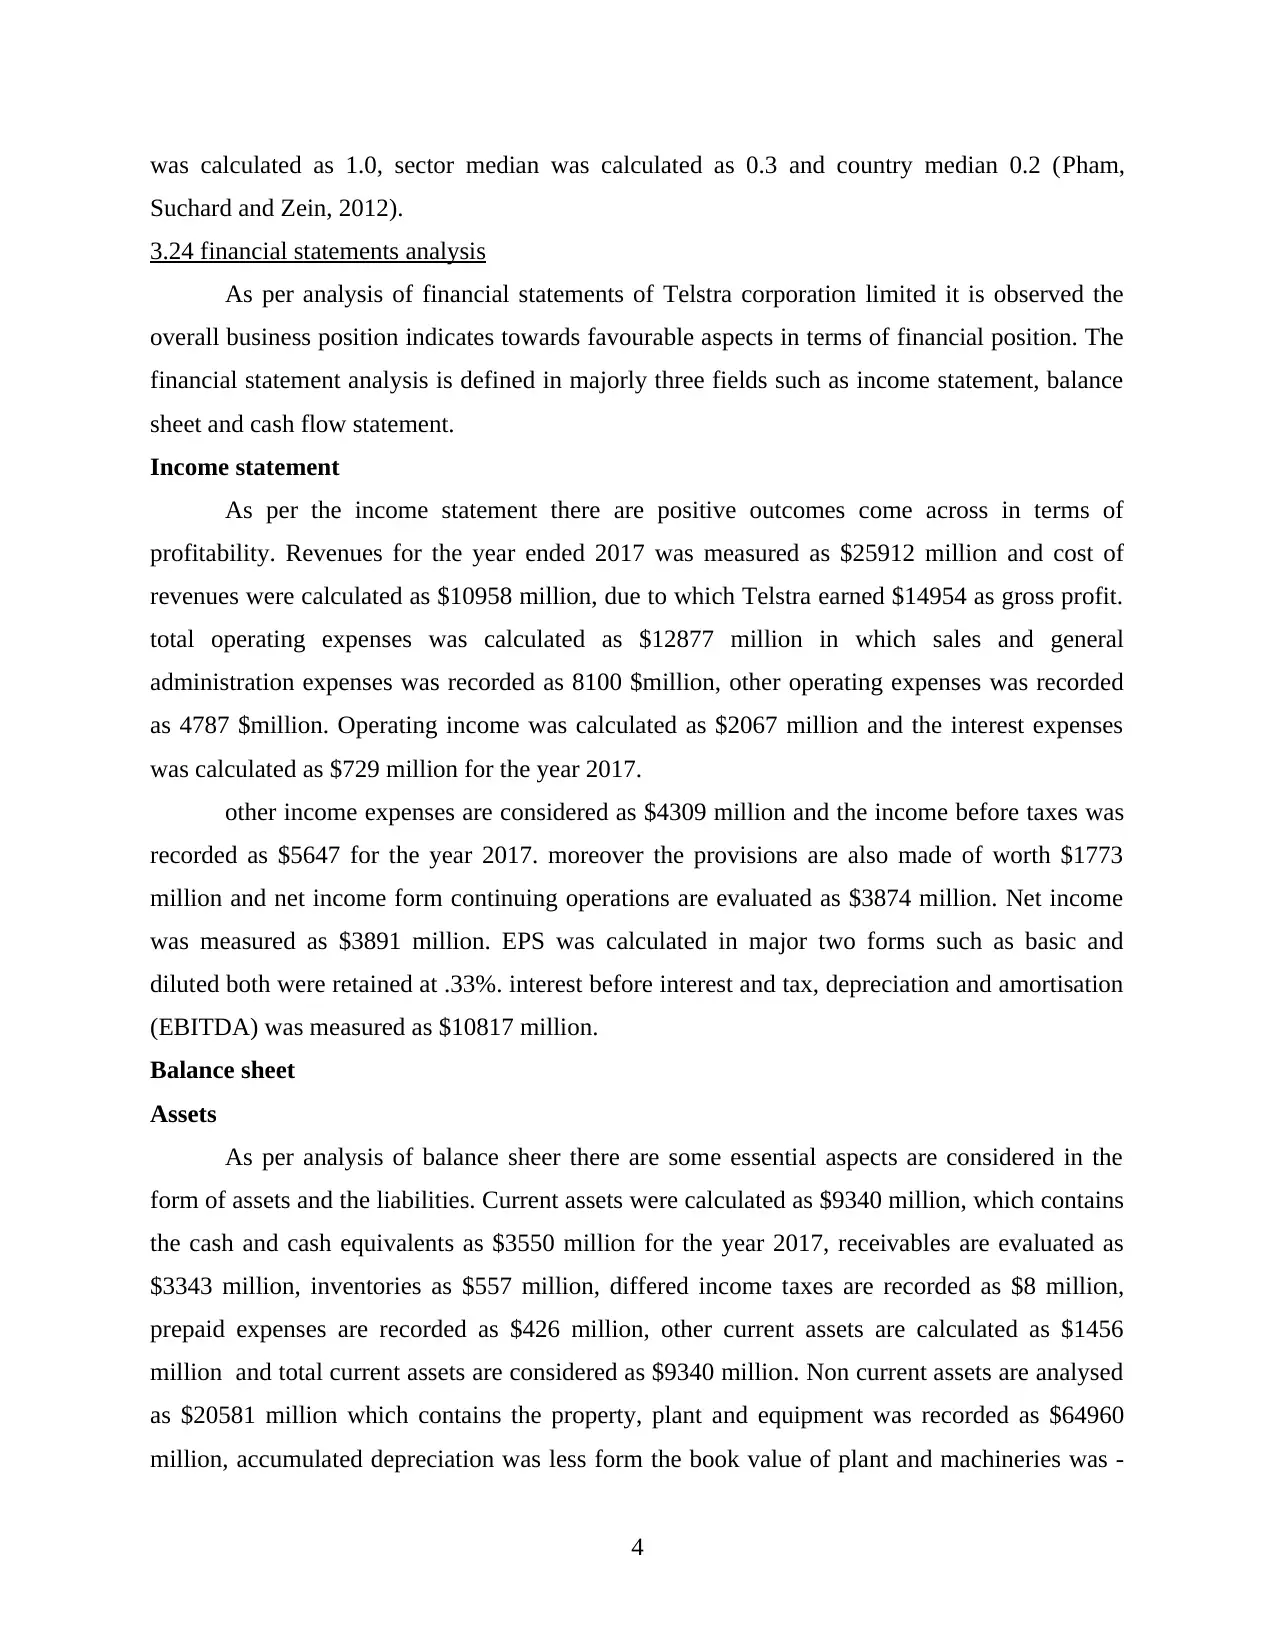
was calculated as 1.0, sector median was calculated as 0.3 and country median 0.2 (Pham,
Suchard and Zein, 2012).
3.24 financial statements analysis
As per analysis of financial statements of Telstra corporation limited it is observed the
overall business position indicates towards favourable aspects in terms of financial position. The
financial statement analysis is defined in majorly three fields such as income statement, balance
sheet and cash flow statement.
Income statement
As per the income statement there are positive outcomes come across in terms of
profitability. Revenues for the year ended 2017 was measured as $25912 million and cost of
revenues were calculated as $10958 million, due to which Telstra earned $14954 as gross profit.
total operating expenses was calculated as $12877 million in which sales and general
administration expenses was recorded as 8100 $million, other operating expenses was recorded
as 4787 $million. Operating income was calculated as $2067 million and the interest expenses
was calculated as $729 million for the year 2017.
other income expenses are considered as $4309 million and the income before taxes was
recorded as $5647 for the year 2017. moreover the provisions are also made of worth $1773
million and net income form continuing operations are evaluated as $3874 million. Net income
was measured as $3891 million. EPS was calculated in major two forms such as basic and
diluted both were retained at .33%. interest before interest and tax, depreciation and amortisation
(EBITDA) was measured as $10817 million.
Balance sheet
Assets
As per analysis of balance sheer there are some essential aspects are considered in the
form of assets and the liabilities. Current assets were calculated as $9340 million, which contains
the cash and cash equivalents as $3550 million for the year 2017, receivables are evaluated as
$3343 million, inventories as $557 million, differed income taxes are recorded as $8 million,
prepaid expenses are recorded as $426 million, other current assets are calculated as $1456
million and total current assets are considered as $9340 million. Non current assets are analysed
as $20581 million which contains the property, plant and equipment was recorded as $64960
million, accumulated depreciation was less form the book value of plant and machineries was -
4
⊘ This is a preview!⊘
Do you want full access?
Subscribe today to unlock all pages.
Trusted by 1+ million students worldwide
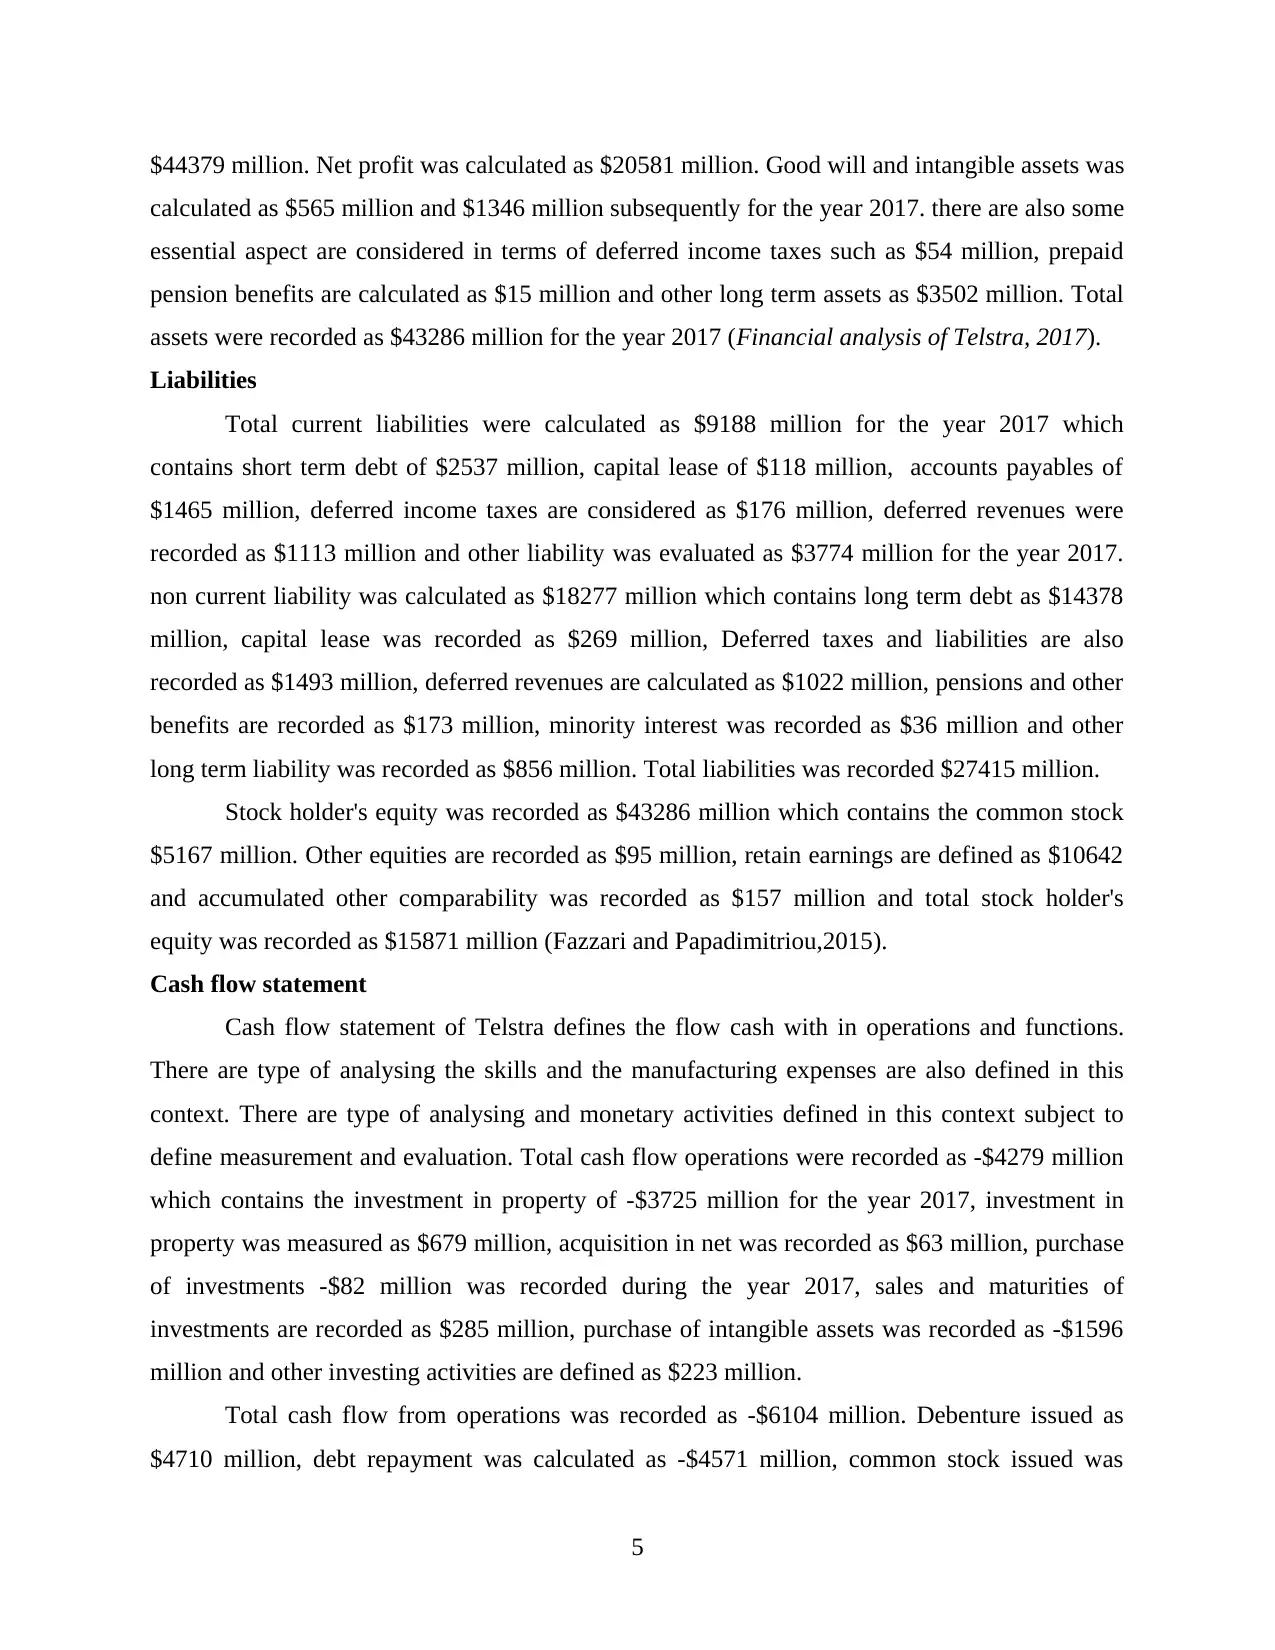
$44379 million. Net profit was calculated as $20581 million. Good will and intangible assets was
calculated as $565 million and $1346 million subsequently for the year 2017. there are also some
essential aspect are considered in terms of deferred income taxes such as $54 million, prepaid
pension benefits are calculated as $15 million and other long term assets as $3502 million. Total
assets were recorded as $43286 million for the year 2017 (Financial analysis of Telstra, 2017).
Liabilities
Total current liabilities were calculated as $9188 million for the year 2017 which
contains short term debt of $2537 million, capital lease of $118 million, accounts payables of
$1465 million, deferred income taxes are considered as $176 million, deferred revenues were
recorded as $1113 million and other liability was evaluated as $3774 million for the year 2017.
non current liability was calculated as $18277 million which contains long term debt as $14378
million, capital lease was recorded as $269 million, Deferred taxes and liabilities are also
recorded as $1493 million, deferred revenues are calculated as $1022 million, pensions and other
benefits are recorded as $173 million, minority interest was recorded as $36 million and other
long term liability was recorded as $856 million. Total liabilities was recorded $27415 million.
Stock holder's equity was recorded as $43286 million which contains the common stock
$5167 million. Other equities are recorded as $95 million, retain earnings are defined as $10642
and accumulated other comparability was recorded as $157 million and total stock holder's
equity was recorded as $15871 million (Fazzari and Papadimitriou,2015).
Cash flow statement
Cash flow statement of Telstra defines the flow cash with in operations and functions.
There are type of analysing the skills and the manufacturing expenses are also defined in this
context. There are type of analysing and monetary activities defined in this context subject to
define measurement and evaluation. Total cash flow operations were recorded as -$4279 million
which contains the investment in property of -$3725 million for the year 2017, investment in
property was measured as $679 million, acquisition in net was recorded as $63 million, purchase
of investments -$82 million was recorded during the year 2017, sales and maturities of
investments are recorded as $285 million, purchase of intangible assets was recorded as -$1596
million and other investing activities are defined as $223 million.
Total cash flow from operations was recorded as -$6104 million. Debenture issued as
$4710 million, debt repayment was calculated as -$4571 million, common stock issued was
5
Paraphrase This Document
Need a fresh take? Get an instant paraphrase of this document with our AI Paraphraser
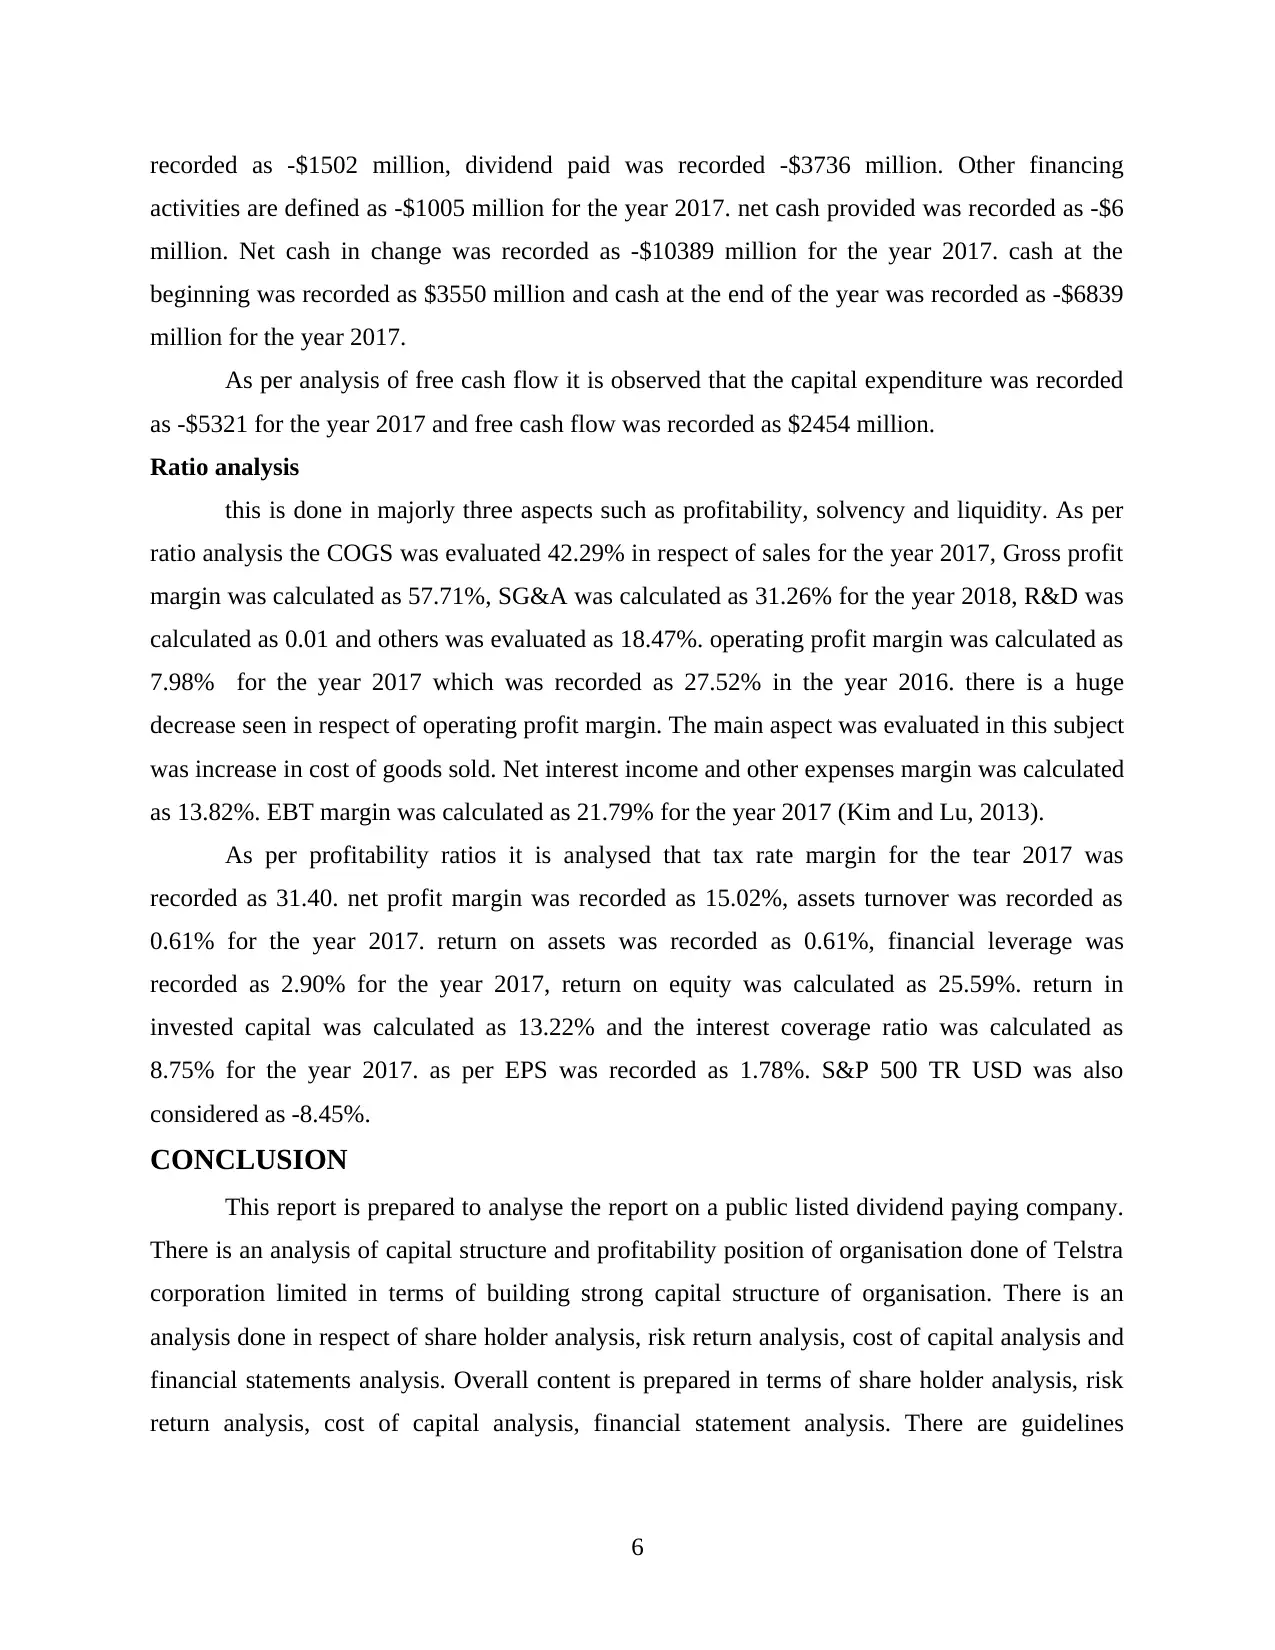
recorded as -$1502 million, dividend paid was recorded -$3736 million. Other financing
activities are defined as -$1005 million for the year 2017. net cash provided was recorded as -$6
million. Net cash in change was recorded as -$10389 million for the year 2017. cash at the
beginning was recorded as $3550 million and cash at the end of the year was recorded as -$6839
million for the year 2017.
As per analysis of free cash flow it is observed that the capital expenditure was recorded
as -$5321 for the year 2017 and free cash flow was recorded as $2454 million.
Ratio analysis
this is done in majorly three aspects such as profitability, solvency and liquidity. As per
ratio analysis the COGS was evaluated 42.29% in respect of sales for the year 2017, Gross profit
margin was calculated as 57.71%, SG&A was calculated as 31.26% for the year 2018, R&D was
calculated as 0.01 and others was evaluated as 18.47%. operating profit margin was calculated as
7.98% for the year 2017 which was recorded as 27.52% in the year 2016. there is a huge
decrease seen in respect of operating profit margin. The main aspect was evaluated in this subject
was increase in cost of goods sold. Net interest income and other expenses margin was calculated
as 13.82%. EBT margin was calculated as 21.79% for the year 2017 (Kim and Lu, 2013).
As per profitability ratios it is analysed that tax rate margin for the tear 2017 was
recorded as 31.40. net profit margin was recorded as 15.02%, assets turnover was recorded as
0.61% for the year 2017. return on assets was recorded as 0.61%, financial leverage was
recorded as 2.90% for the year 2017, return on equity was calculated as 25.59%. return in
invested capital was calculated as 13.22% and the interest coverage ratio was calculated as
8.75% for the year 2017. as per EPS was recorded as 1.78%. S&P 500 TR USD was also
considered as -8.45%.
CONCLUSION
This report is prepared to analyse the report on a public listed dividend paying company.
There is an analysis of capital structure and profitability position of organisation done of Telstra
corporation limited in terms of building strong capital structure of organisation. There is an
analysis done in respect of share holder analysis, risk return analysis, cost of capital analysis and
financial statements analysis. Overall content is prepared in terms of share holder analysis, risk
return analysis, cost of capital analysis, financial statement analysis. There are guidelines
6

regarding analysis of all the above discussed scenarios are defined in this context. Capital
growth, dividend payout ratios and return on investments also defined in this context.
7
growth, dividend payout ratios and return on investments also defined in this context.
7
⊘ This is a preview!⊘
Do you want full access?
Subscribe today to unlock all pages.
Trusted by 1+ million students worldwide
REFERENCES
Books and Journals:
Brealey, R.A and et. al., 2012. Principles of corporate finance. Tata McGraw-Hill Education.
Coles, J.L., Lemmon, M.L. and Meschke, J.F., 2012. Structural models and endogeneity in
corporate finance: The link between managerial ownership and corporate
performance. Journal of Financial Economics, 103(1), pp.149-168.
Huang, J. and Kisgen, D.J., 2013. Gender and corporate finance: Are male executives
overconfident relative to female executives?. Journal of Financial Economics, 108(3),
pp.822-839.
Ehrhardt, M.C. and Brigham, E.F., 2016. Corporate finance: A focused approach. Cengage
learning.
Molot, J.T., 2014. What's Wrong with Law Firms: A Corporate Finance Solution to Law Firm
Short-Termism. S. Cal. L. Rev., 88, p.1.
Pham, P.K., Suchard, J.A. and Zein, J., 2012. Corporate governance and the cost of capital:
Evidence from Australian companies. Journal of Applied Corporate Finance, 24(3),
pp.84-93.
Fazzari, S.M. and Papadimitriou, D.B., 2015. Financial conditions and macroeconomic
performance: Essays in honor of Hyman P. Minsky. Routledge.
Kim, E.H. and Lu, Y., 2013. Corporate governance reforms around the world and cross-border
acquisitions. Journal of Corporate Finance, 22, pp.236-253.
Online
Financial analysis of Telstra, 2017. [online] Available through:
<http://financials.morningstar.com/income-statement/is.html?t=TLS®ion=aus>.
8
1 out of 10
Related Documents


Your All-in-One AI-Powered Toolkit for Academic Success.
+13062052269
info@desklib.com
Available 24*7 on WhatsApp / Email
![[object Object]](/_next/static/media/star-bottom.7253800d.svg)
Unlock your academic potential
Copyright © 2020–2025 A2Z Services. All Rights Reserved. Developed and managed by ZUCOL.