Corporate Finance: Boral Limited Analysis and Recommendations
VerifiedAdded on 2021/04/24
|10
|2398
|52
Report
AI Summary
This report, focusing on corporate finance, analyzes Boral Limited's capital structure, capital budgeting, and dividend policy. Task 1 delves into the company's capital structure and dividend pay-out policy, examining historical data and evaluating the policy's implications. Task 2 involves a financial analysis of a proposed project using spreadsheet modeling, calculating NPV, IRR, payback period, and profitability index. A memo to the CEO justifies the chosen methods and recommendations based on the financial analysis. The report concludes that the project is a viable investment, recommending its commencement to generate high returns. The report uses financial data from 2015 to 2017 and incorporates relevant academic sources to support its findings. The analysis includes detailed calculations of cash flows, depreciation, and tax implications to assess the project's financial viability.

Running head: CORPORATE FINANCE
Corporate Finance
Name of the Student:
Name of the University:
Authors Note:
Corporate Finance
Name of the Student:
Name of the University:
Authors Note:
Paraphrase This Document
Need a fresh take? Get an instant paraphrase of this document with our AI Paraphraser
CORPORATE FINANCE
1
Table of Contents
Assessment 4: Task for Case Study 2........................................................................................2
Task 1: Capital Structure and Pay-out Policy Analysis.............................................................2
1) Describing the policy based on current and historical data:..................................................2
2) Evaluating the policy, drawing on practical considerations covered applied to the
company’s current characteristics and situation:.......................................................................4
Task 2: Capital Budgeting Task.................................................................................................5
1) Spreadsheet financial analysis of the proposed project:........................................................5
2) Memo to the CEO addressing, explaining, and justifying the chosen methods:...................8
Reference and Bibliography:....................................................................................................11
CORPORATE FINANCE
2
Assessment 4: Task for Case Study 2
Task 1: Capital Structure and Pay-out Policy Analysis
1) Describing the policy based on current and historical data:
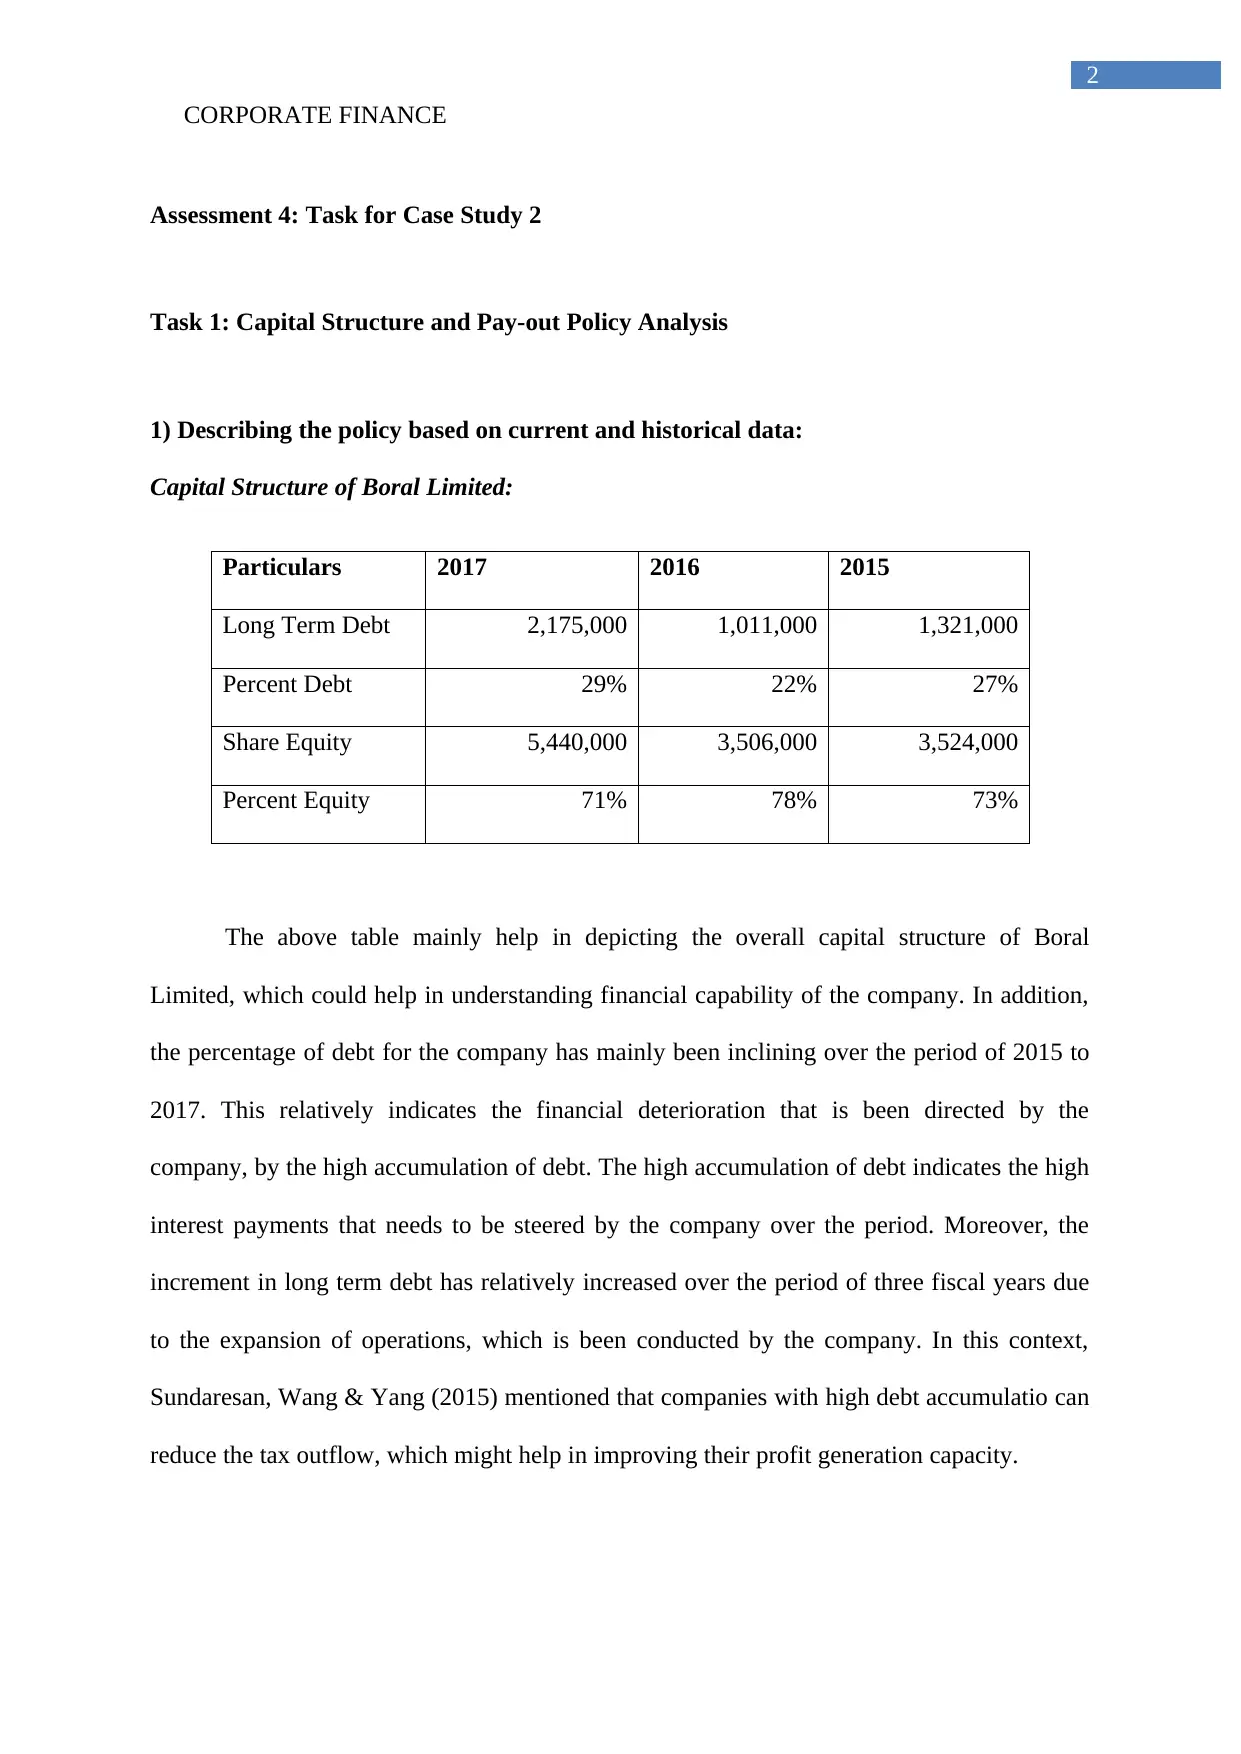
Capital Structure of Boral Limited:
Particulars 2017 2016 2015
Long Term Debt 2,175,000 1,011,000 1,321,000
Percent Debt 29% 22% 27%
Share Equity 5,440,000 3,506,000 3,524,000
Percent Equity 71% 78% 73%
The above table mainly help in depicting the overall capital structure of Boral
Limited, which could help in understanding financial capability of the company. In addition,
the percentage of debt for the company has mainly been inclining over the period of 2015 to
2017. This relatively indicates the financial deterioration that is been directed by the
company, by the high accumulation of debt. The high accumulation of debt indicates the high
interest payments that needs to be steered by the company over the period. Moreover, the
increment in long term debt has relatively increased over the period of three fiscal years due
to the expansion of operations, which is been conducted by the company. In this context,
Sundaresan, Wang & Yang (2015) mentioned that companies with high debt accumulatio can
reduce the tax outflow, which might help in improving their profit generation capacity.
2
Assessment 4: Task for Case Study 2
Task 1: Capital Structure and Pay-out Policy Analysis
1) Describing the policy based on current and historical data:
Capital Structure of Boral Limited:
Particulars 2017 2016 2015
Long Term Debt 2,175,000 1,011,000 1,321,000
Percent Debt 29% 22% 27%
Share Equity 5,440,000 3,506,000 3,524,000
Percent Equity 71% 78% 73%
The above table mainly help in depicting the overall capital structure of Boral
Limited, which could help in understanding financial capability of the company. In addition,
the percentage of debt for the company has mainly been inclining over the period of 2015 to
2017. This relatively indicates the financial deterioration that is been directed by the
company, by the high accumulation of debt. The high accumulation of debt indicates the high
interest payments that needs to be steered by the company over the period. Moreover, the
increment in long term debt has relatively increased over the period of three fiscal years due
to the expansion of operations, which is been conducted by the company. In this context,
Sundaresan, Wang & Yang (2015) mentioned that companies with high debt accumulatio can
reduce the tax outflow, which might help in improving their profit generation capacity.
⊘ This is a preview!⊘
Do you want full access?
Subscribe today to unlock all pages.
Trusted by 1+ million students worldwide
CORPORATE FINANCE
3
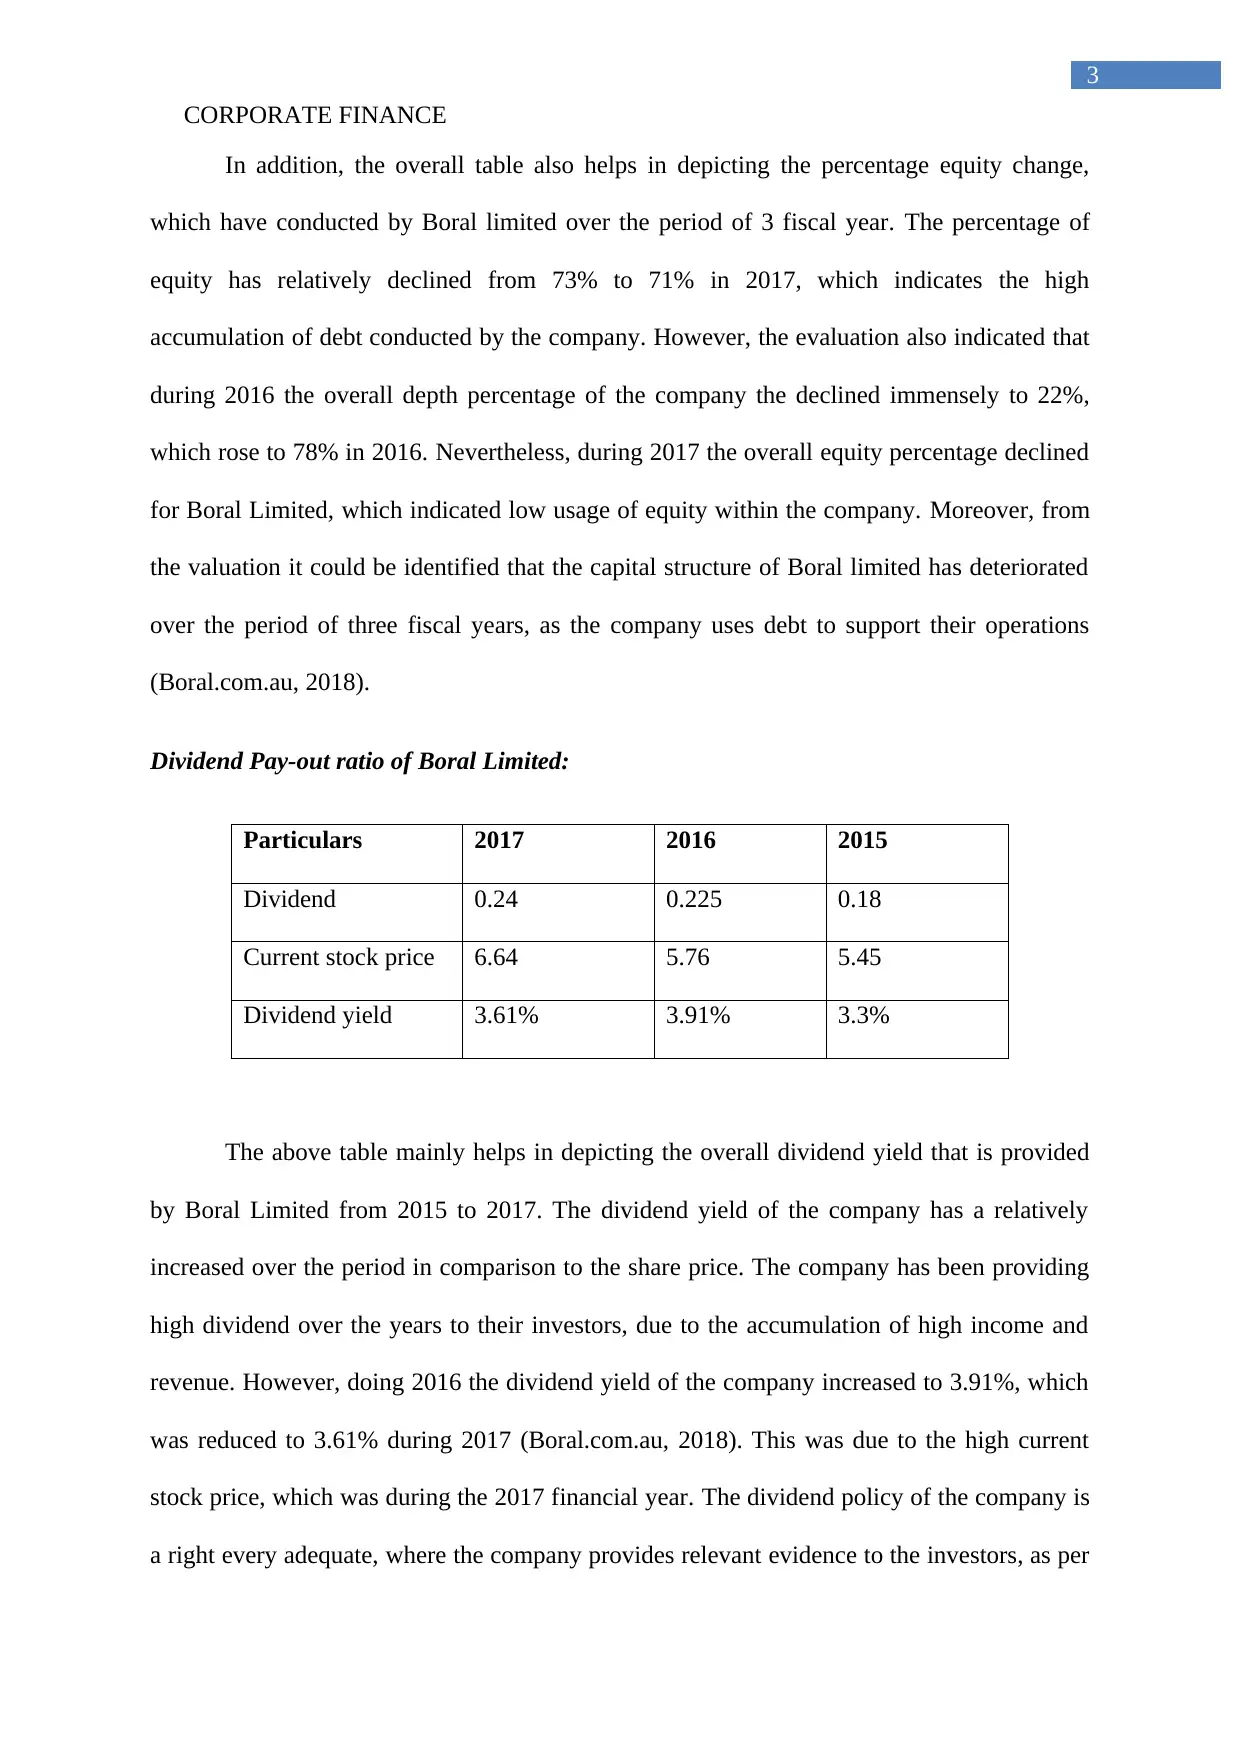
In addition, the overall table also helps in depicting the percentage equity change,
which have conducted by Boral limited over the period of 3 fiscal year. The percentage of
equity has relatively declined from 73% to 71% in 2017, which indicates the high
accumulation of debt conducted by the company. However, the evaluation also indicated that
during 2016 the overall depth percentage of the company the declined immensely to 22%,
which rose to 78% in 2016. Nevertheless, during 2017 the overall equity percentage declined
for Boral Limited, which indicated low usage of equity within the company. Moreover, from
the valuation it could be identified that the capital structure of Boral limited has deteriorated
over the period of three fiscal years, as the company uses debt to support their operations
(Boral.com.au, 2018).
Dividend Pay-out ratio of Boral Limited:
Particulars 2017 2016 2015
Dividend 0.24 0.225 0.18
Current stock price 6.64 5.76 5.45
Dividend yield 3.61% 3.91% 3.3%
The above table mainly helps in depicting the overall dividend yield that is provided
by Boral Limited from 2015 to 2017. The dividend yield of the company has a relatively
increased over the period in comparison to the share price. The company has been providing
high dividend over the years to their investors, due to the accumulation of high income and
revenue. However, doing 2016 the dividend yield of the company increased to 3.91%, which
was reduced to 3.61% during 2017 (Boral.com.au, 2018). This was due to the high current
stock price, which was during the 2017 financial year. The dividend policy of the company is
a right every adequate, where the company provides relevant evidence to the investors, as per
3
In addition, the overall table also helps in depicting the percentage equity change,
which have conducted by Boral limited over the period of 3 fiscal year. The percentage of
equity has relatively declined from 73% to 71% in 2017, which indicates the high
accumulation of debt conducted by the company. However, the evaluation also indicated that
during 2016 the overall depth percentage of the company the declined immensely to 22%,
which rose to 78% in 2016. Nevertheless, during 2017 the overall equity percentage declined
for Boral Limited, which indicated low usage of equity within the company. Moreover, from
the valuation it could be identified that the capital structure of Boral limited has deteriorated
over the period of three fiscal years, as the company uses debt to support their operations
(Boral.com.au, 2018).
Dividend Pay-out ratio of Boral Limited:
Particulars 2017 2016 2015
Dividend 0.24 0.225 0.18
Current stock price 6.64 5.76 5.45
Dividend yield 3.61% 3.91% 3.3%
The above table mainly helps in depicting the overall dividend yield that is provided
by Boral Limited from 2015 to 2017. The dividend yield of the company has a relatively
increased over the period in comparison to the share price. The company has been providing
high dividend over the years to their investors, due to the accumulation of high income and
revenue. However, doing 2016 the dividend yield of the company increased to 3.91%, which
was reduced to 3.61% during 2017 (Boral.com.au, 2018). This was due to the high current
stock price, which was during the 2017 financial year. The dividend policy of the company is
a right every adequate, where the company provides relevant evidence to the investors, as per
Paraphrase This Document
Need a fresh take? Get an instant paraphrase of this document with our AI Paraphraser
CORPORATE FINANCE
4
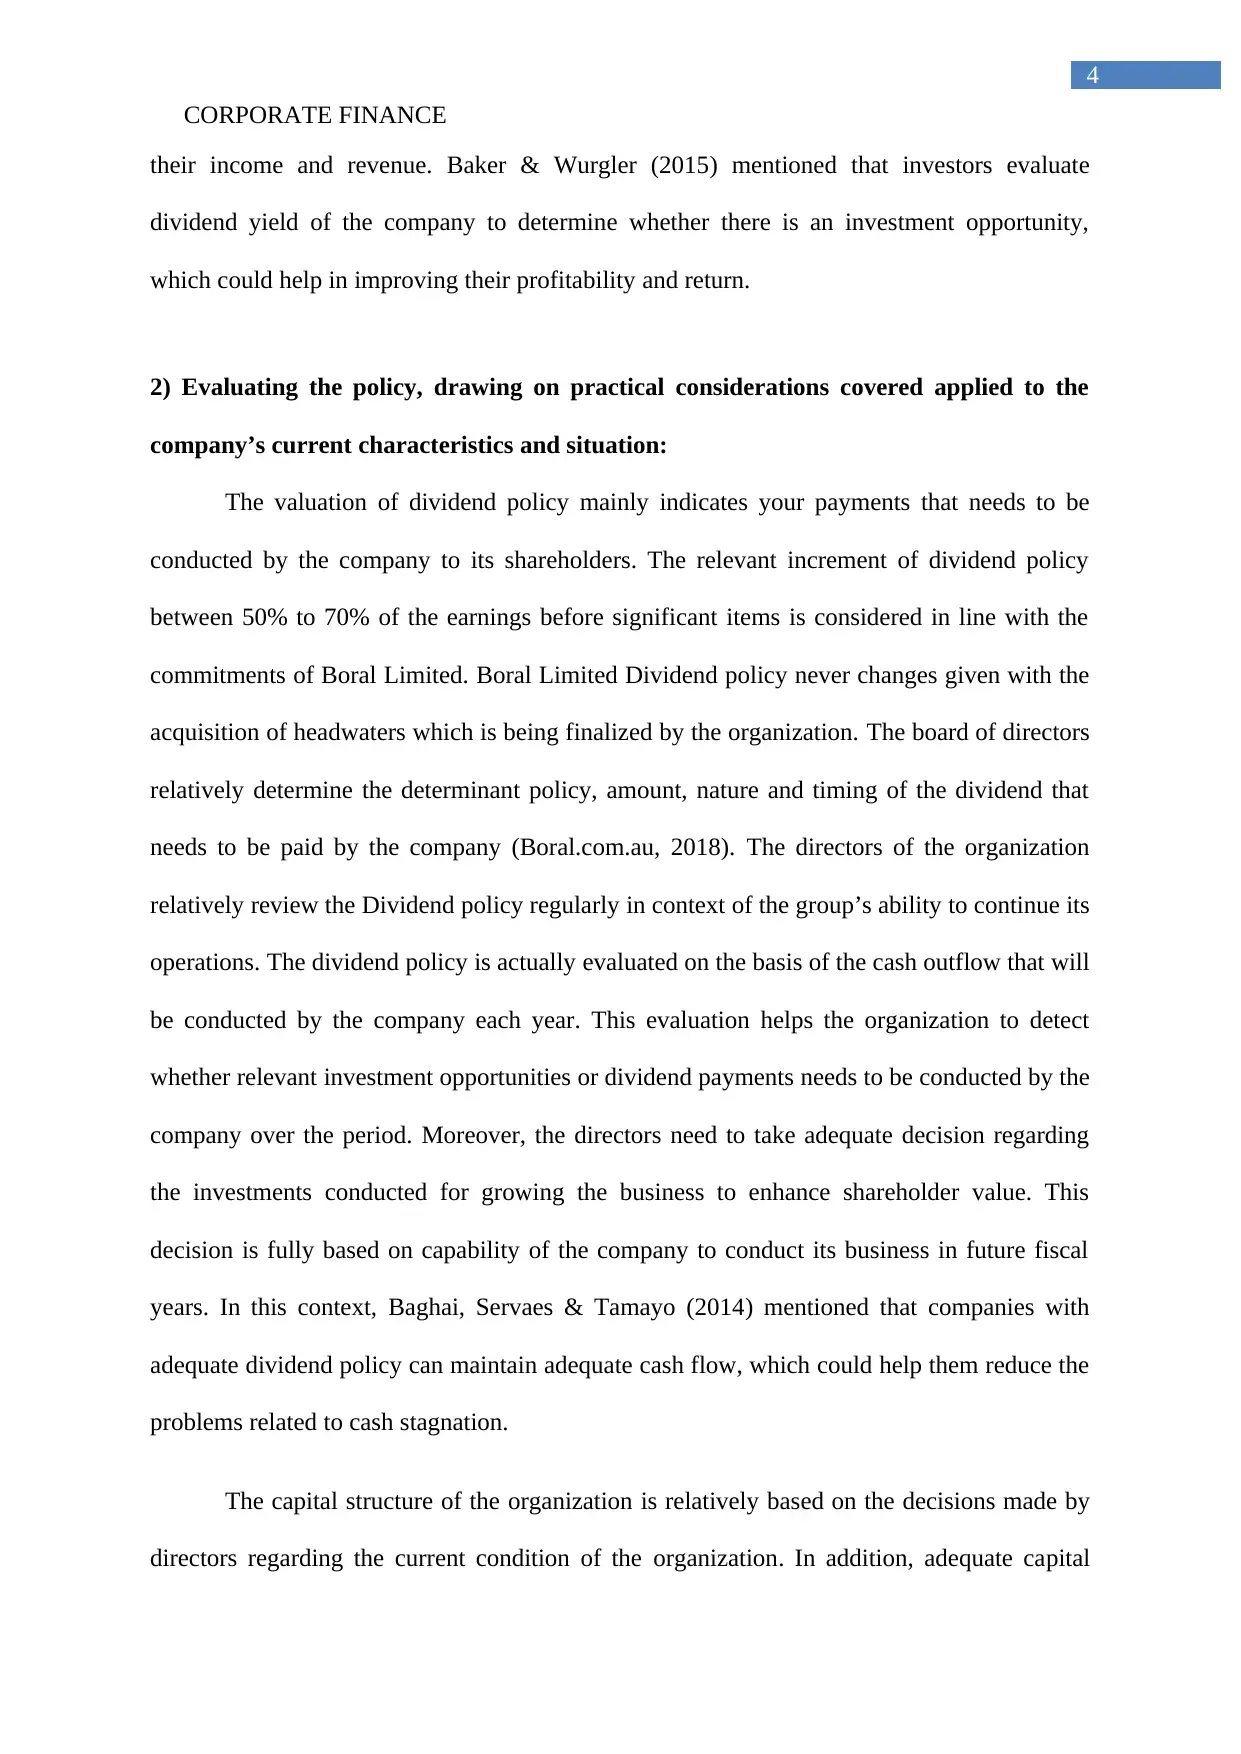
their income and revenue. Baker & Wurgler (2015) mentioned that investors evaluate
dividend yield of the company to determine whether there is an investment opportunity,
which could help in improving their profitability and return.
2) Evaluating the policy, drawing on practical considerations covered applied to the
company’s current characteristics and situation:
The valuation of dividend policy mainly indicates your payments that needs to be
conducted by the company to its shareholders. The relevant increment of dividend policy
between 50% to 70% of the earnings before significant items is considered in line with the
commitments of Boral Limited. Boral Limited Dividend policy never changes given with the
acquisition of headwaters which is being finalized by the organization. The board of directors
relatively determine the determinant policy, amount, nature and timing of the dividend that
needs to be paid by the company (Boral.com.au, 2018). The directors of the organization
relatively review the Dividend policy regularly in context of the group’s ability to continue its
operations. The dividend policy is actually evaluated on the basis of the cash outflow that will
be conducted by the company each year. This evaluation helps the organization to detect
whether relevant investment opportunities or dividend payments needs to be conducted by the
company over the period. Moreover, the directors need to take adequate decision regarding
the investments conducted for growing the business to enhance shareholder value. This
decision is fully based on capability of the company to conduct its business in future fiscal
years. In this context, Baghai, Servaes & Tamayo (2014) mentioned that companies with
adequate dividend policy can maintain adequate cash flow, which could help them reduce the
problems related to cash stagnation.
The capital structure of the organization is relatively based on the decisions made by
directors regarding the current condition of the organization. In addition, adequate capital
4
their income and revenue. Baker & Wurgler (2015) mentioned that investors evaluate
dividend yield of the company to determine whether there is an investment opportunity,
which could help in improving their profitability and return.
2) Evaluating the policy, drawing on practical considerations covered applied to the
company’s current characteristics and situation:
The valuation of dividend policy mainly indicates your payments that needs to be
conducted by the company to its shareholders. The relevant increment of dividend policy
between 50% to 70% of the earnings before significant items is considered in line with the
commitments of Boral Limited. Boral Limited Dividend policy never changes given with the
acquisition of headwaters which is being finalized by the organization. The board of directors
relatively determine the determinant policy, amount, nature and timing of the dividend that
needs to be paid by the company (Boral.com.au, 2018). The directors of the organization
relatively review the Dividend policy regularly in context of the group’s ability to continue its
operations. The dividend policy is actually evaluated on the basis of the cash outflow that will
be conducted by the company each year. This evaluation helps the organization to detect
whether relevant investment opportunities or dividend payments needs to be conducted by the
company over the period. Moreover, the directors need to take adequate decision regarding
the investments conducted for growing the business to enhance shareholder value. This
decision is fully based on capability of the company to conduct its business in future fiscal
years. In this context, Baghai, Servaes & Tamayo (2014) mentioned that companies with
adequate dividend policy can maintain adequate cash flow, which could help them reduce the
problems related to cash stagnation.
The capital structure of the organization is relatively based on the decisions made by
directors regarding the current condition of the organization. In addition, adequate capital
CORPORATE FINANCE
5
structure is followed by increasing both equity and debt of the organization at the same time.
The debt position of the company is not increased abruptly without the increment of equity
position, which helps in maintaining adequate weightage and ratio (Boral.com.au, 2018).
Task 2: Capital Budgeting Task
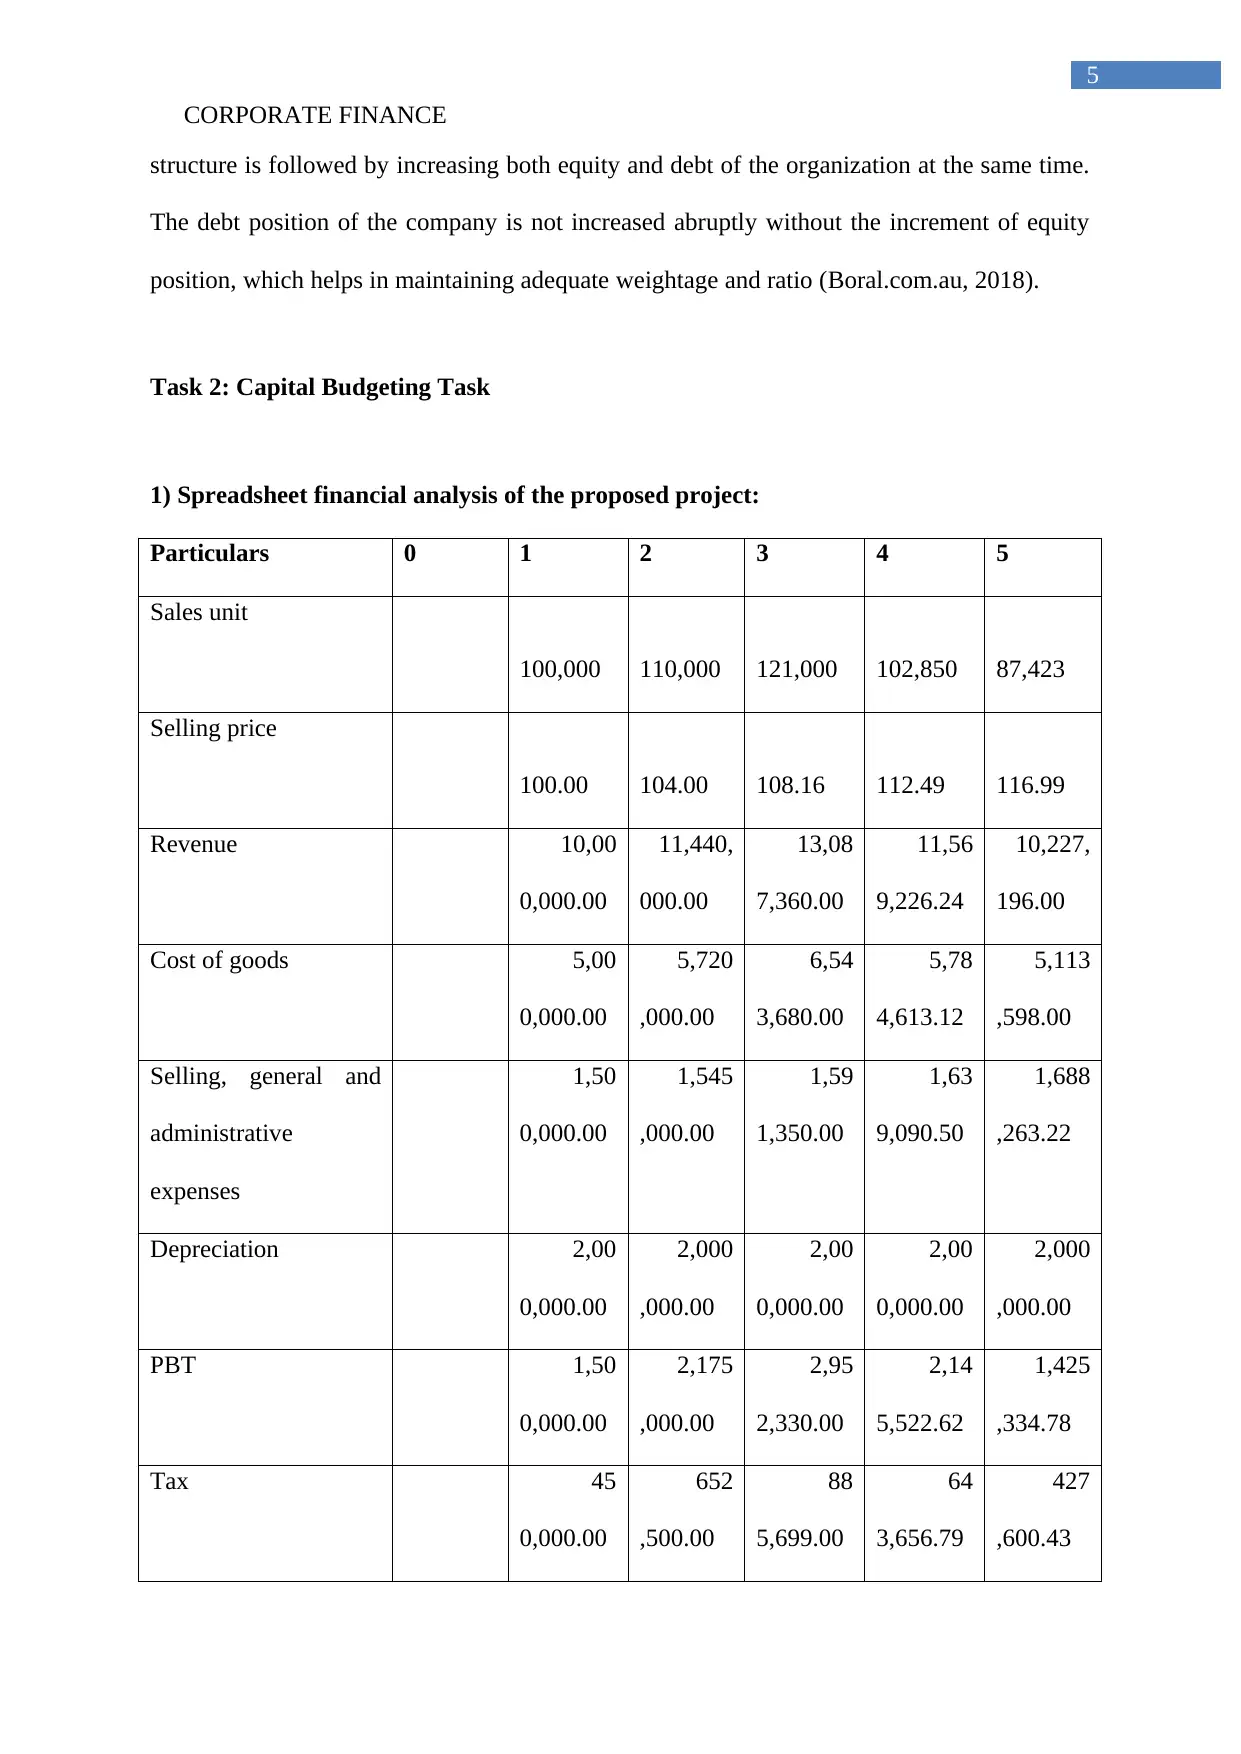
1) Spreadsheet financial analysis of the proposed project:
Particulars 0 1 2 3 4 5
Sales unit
100,000 110,000 121,000 102,850 87,423
Selling price
100.00 104.00 108.16 112.49 116.99
Revenue 10,00
0,000.00
11,440,
000.00
13,08
7,360.00
11,56
9,226.24
10,227,
196.00
Cost of goods 5,00
0,000.00
5,720
,000.00
6,54
3,680.00
5,78
4,613.12
5,113
,598.00
Selling, general and
administrative
expenses
1,50
0,000.00
1,545
,000.00
1,59
1,350.00
1,63
9,090.50
1,688
,263.22
Depreciation 2,00
0,000.00
2,000
,000.00
2,00
0,000.00
2,00
0,000.00
2,000
,000.00
PBT 1,50
0,000.00
2,175
,000.00
2,95
2,330.00
2,14
5,522.62
1,425
,334.78
Tax 45
0,000.00
652
,500.00
88
5,699.00
64
3,656.79
427
,600.43
5
structure is followed by increasing both equity and debt of the organization at the same time.
The debt position of the company is not increased abruptly without the increment of equity
position, which helps in maintaining adequate weightage and ratio (Boral.com.au, 2018).
Task 2: Capital Budgeting Task
1) Spreadsheet financial analysis of the proposed project:
Particulars 0 1 2 3 4 5
Sales unit
100,000 110,000 121,000 102,850 87,423
Selling price
100.00 104.00 108.16 112.49 116.99
Revenue 10,00
0,000.00
11,440,
000.00
13,08
7,360.00
11,56
9,226.24
10,227,
196.00
Cost of goods 5,00
0,000.00
5,720
,000.00
6,54
3,680.00
5,78
4,613.12
5,113
,598.00
Selling, general and
administrative
expenses
1,50
0,000.00
1,545
,000.00
1,59
1,350.00
1,63
9,090.50
1,688
,263.22
Depreciation 2,00
0,000.00
2,000
,000.00
2,00
0,000.00
2,00
0,000.00
2,000
,000.00
PBT 1,50
0,000.00
2,175
,000.00
2,95
2,330.00
2,14
5,522.62
1,425
,334.78
Tax 45
0,000.00
652
,500.00
88
5,699.00
64
3,656.79
427
,600.43
⊘ This is a preview!⊘
Do you want full access?
Subscribe today to unlock all pages.
Trusted by 1+ million students worldwide
CORPORATE FINANCE
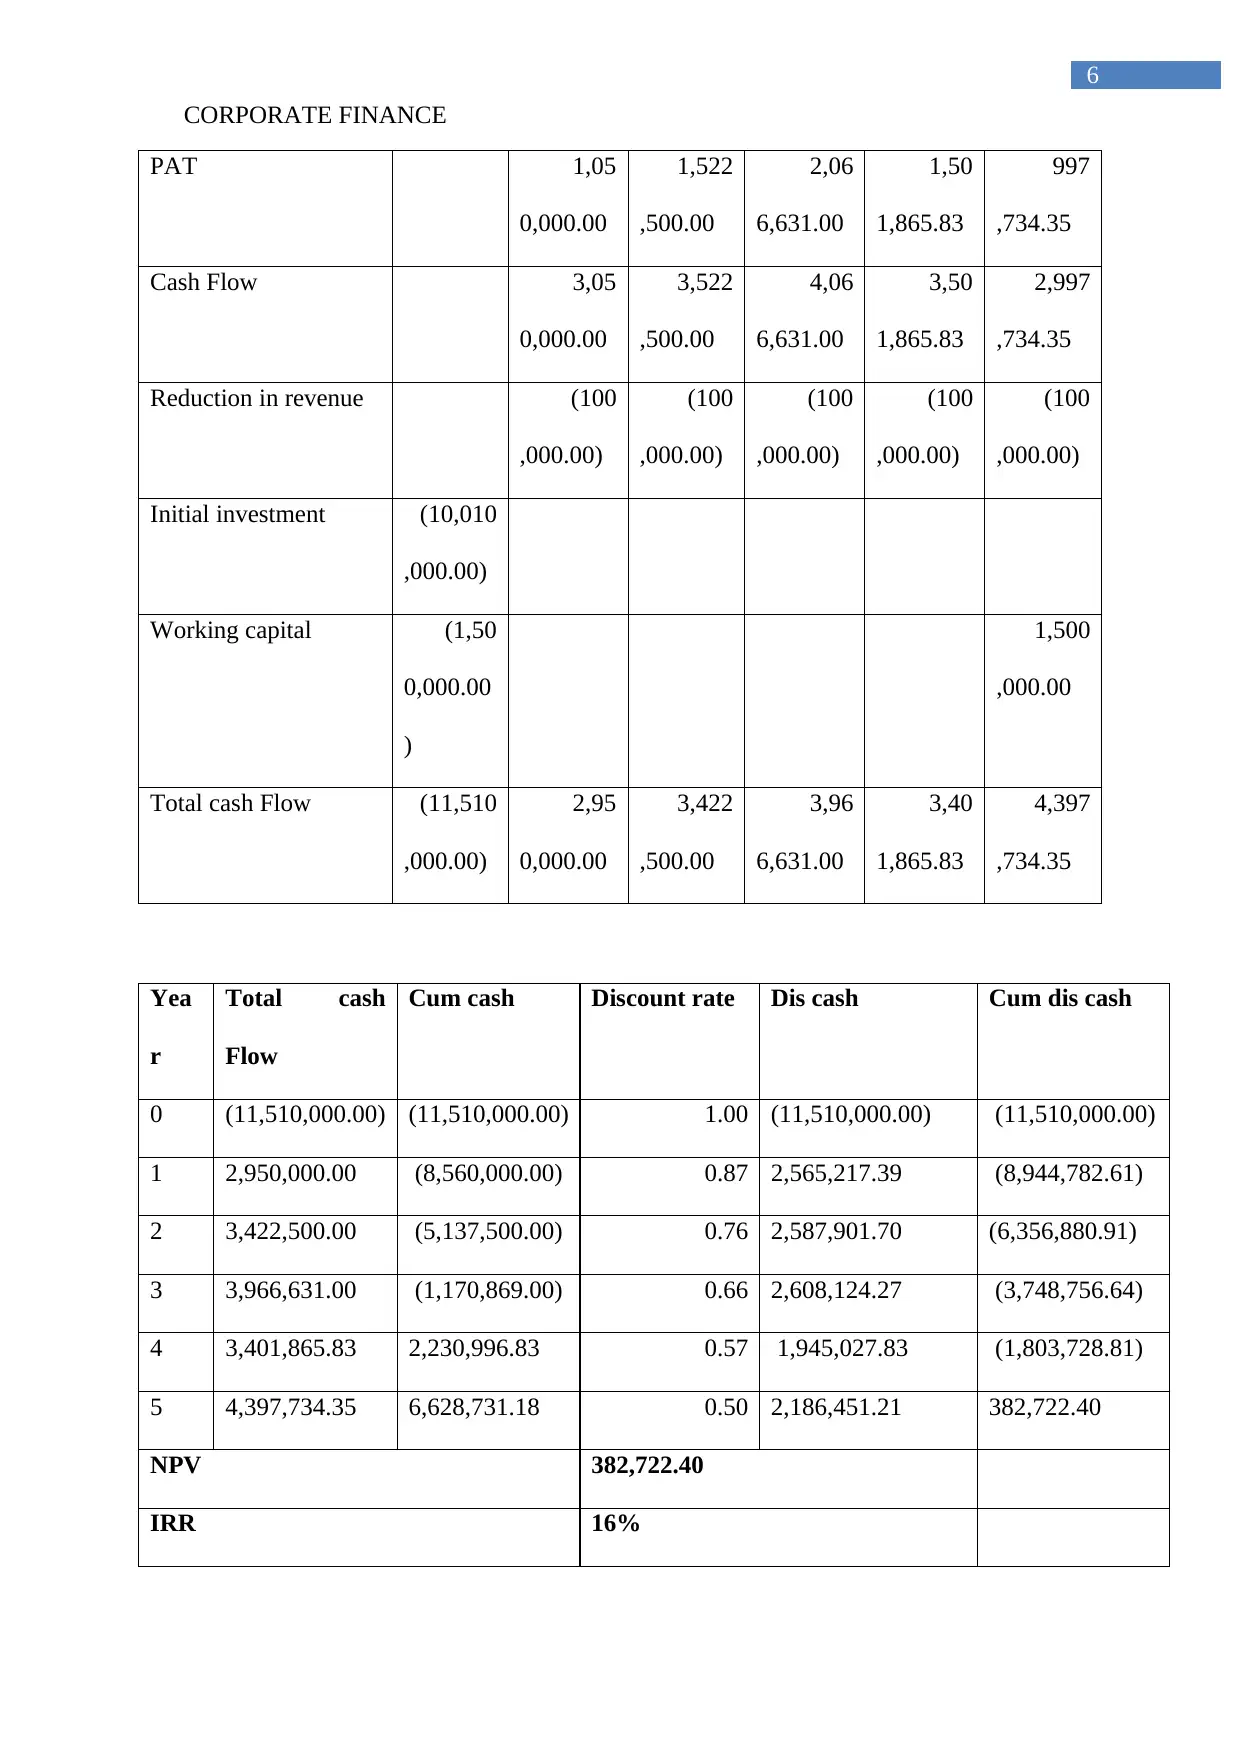
6
PAT 1,05
0,000.00
1,522
,500.00
2,06
6,631.00
1,50
1,865.83
997
,734.35
Cash Flow 3,05
0,000.00
3,522
,500.00
4,06
6,631.00
3,50
1,865.83
2,997
,734.35
Reduction in revenue (100
,000.00)
(100
,000.00)
(100
,000.00)
(100
,000.00)
(100
,000.00)
Initial investment (10,010
,000.00)
Working capital (1,50
0,000.00
)
1,500
,000.00
Total cash Flow (11,510
,000.00)
2,95
0,000.00
3,422
,500.00
3,96
6,631.00
3,40
1,865.83
4,397
,734.35
Yea
r
Total cash
Flow
Cum cash Discount rate Dis cash Cum dis cash
0 (11,510,000.00) (11,510,000.00) 1.00 (11,510,000.00) (11,510,000.00)
1 2,950,000.00 (8,560,000.00) 0.87 2,565,217.39 (8,944,782.61)
2 3,422,500.00 (5,137,500.00) 0.76 2,587,901.70 (6,356,880.91)
3 3,966,631.00 (1,170,869.00) 0.66 2,608,124.27 (3,748,756.64)
4 3,401,865.83 2,230,996.83 0.57 1,945,027.83 (1,803,728.81)
5 4,397,734.35 6,628,731.18 0.50 2,186,451.21 382,722.40
NPV 382,722.40
IRR 16%
Paraphrase This Document
Need a fresh take? Get an instant paraphrase of this document with our AI Paraphraser

CORPORATE FINANCE
7
Payback period 3.3 years
Discounted payback period 4.8 years
Profitability index 1.03
7
Payback period 3.3 years
Discounted payback period 4.8 years
Profitability index 1.03
CORPORATE FINANCE
8
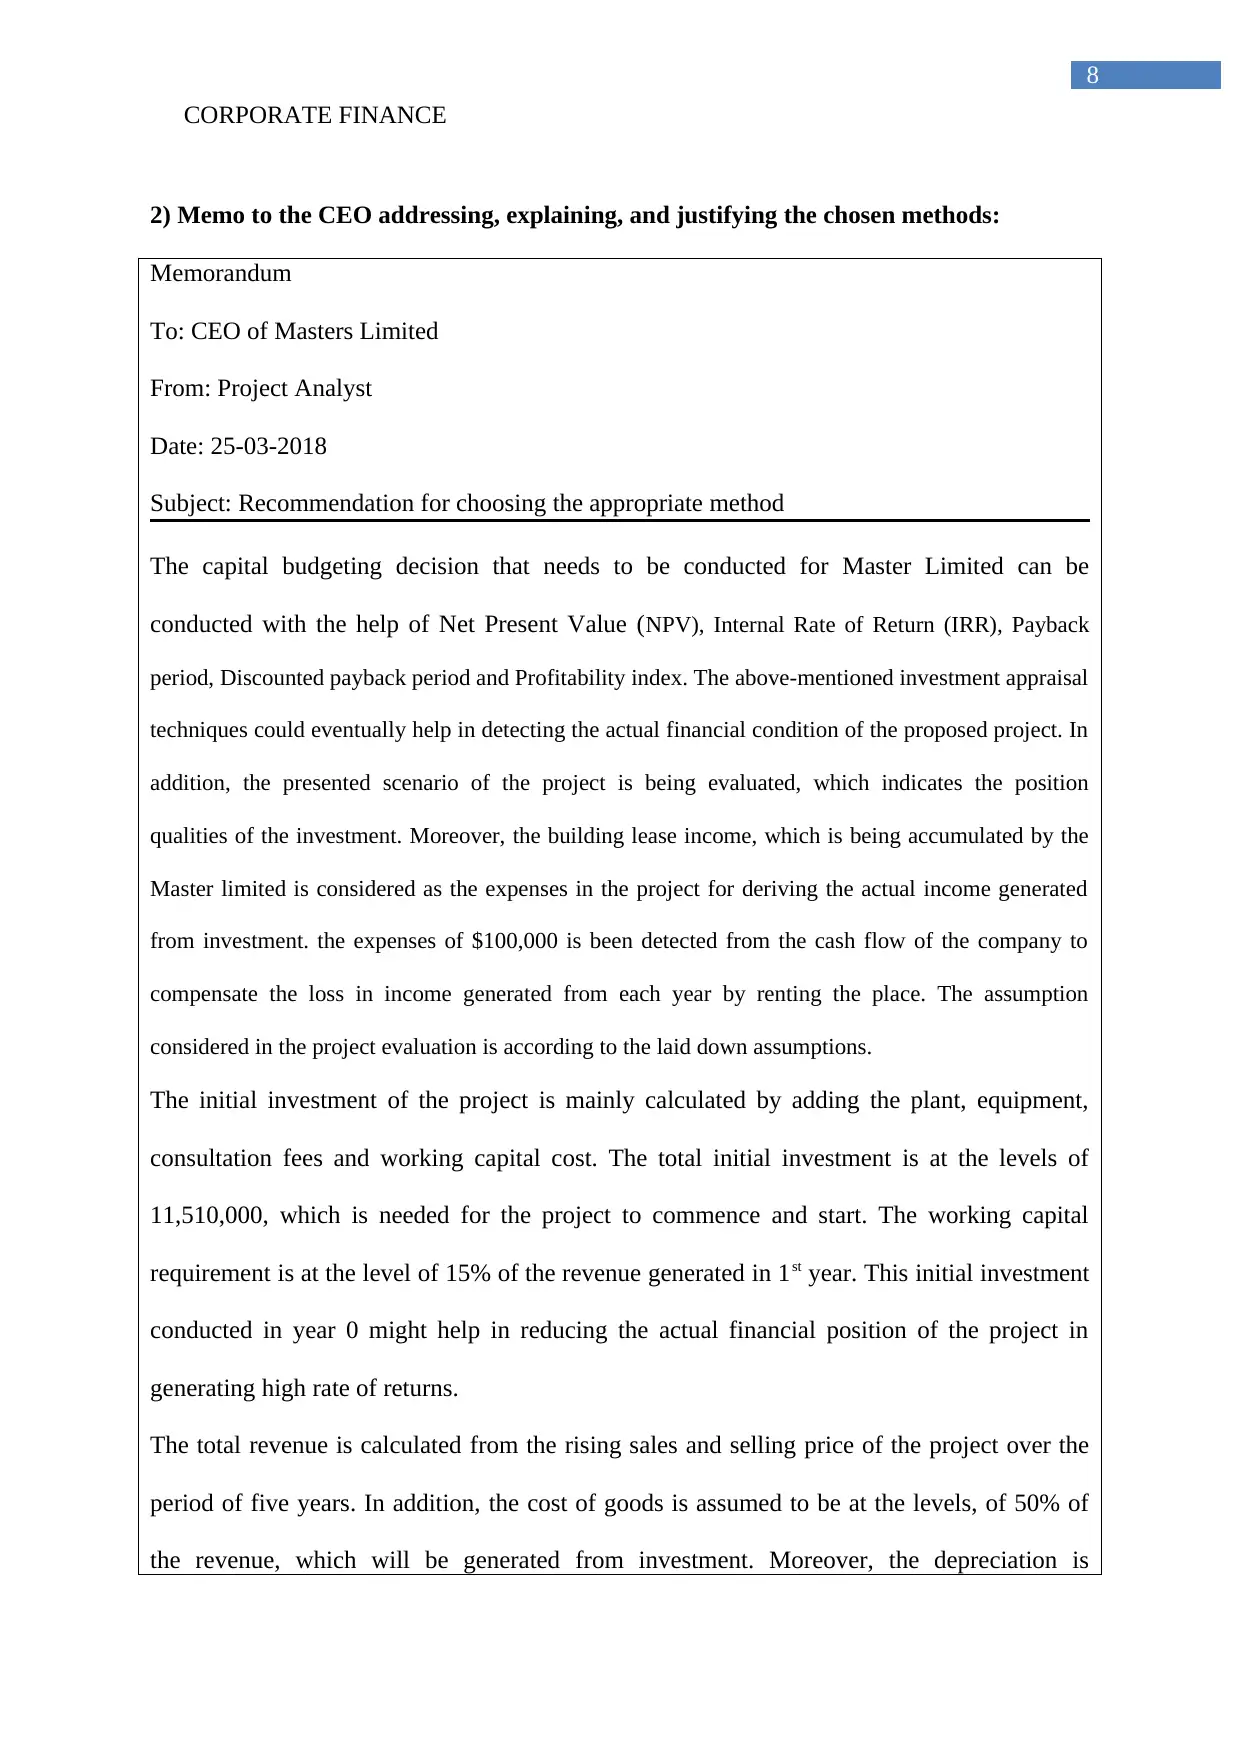
2) Memo to the CEO addressing, explaining, and justifying the chosen methods:
Memorandum
To: CEO of Masters Limited
From: Project Analyst
Date: 25-03-2018
Subject: Recommendation for choosing the appropriate method
The capital budgeting decision that needs to be conducted for Master Limited can be
conducted with the help of Net Present Value (NPV), Internal Rate of Return (IRR), Payback
period, Discounted payback period and Profitability index. The above-mentioned investment appraisal
techniques could eventually help in detecting the actual financial condition of the proposed project. In
addition, the presented scenario of the project is being evaluated, which indicates the position
qualities of the investment. Moreover, the building lease income, which is being accumulated by the
Master limited is considered as the expenses in the project for deriving the actual income generated
from investment. the expenses of $100,000 is been detected from the cash flow of the company to
compensate the loss in income generated from each year by renting the place. The assumption
considered in the project evaluation is according to the laid down assumptions.
The initial investment of the project is mainly calculated by adding the plant, equipment,
consultation fees and working capital cost. The total initial investment is at the levels of
11,510,000, which is needed for the project to commence and start. The working capital
requirement is at the level of 15% of the revenue generated in 1st year. This initial investment
conducted in year 0 might help in reducing the actual financial position of the project in
generating high rate of returns.
The total revenue is calculated from the rising sales and selling price of the project over the
period of five years. In addition, the cost of goods is assumed to be at the levels, of 50% of
the revenue, which will be generated from investment. Moreover, the depreciation is
8
2) Memo to the CEO addressing, explaining, and justifying the chosen methods:
Memorandum
To: CEO of Masters Limited
From: Project Analyst
Date: 25-03-2018
Subject: Recommendation for choosing the appropriate method
The capital budgeting decision that needs to be conducted for Master Limited can be
conducted with the help of Net Present Value (NPV), Internal Rate of Return (IRR), Payback
period, Discounted payback period and Profitability index. The above-mentioned investment appraisal
techniques could eventually help in detecting the actual financial condition of the proposed project. In
addition, the presented scenario of the project is being evaluated, which indicates the position
qualities of the investment. Moreover, the building lease income, which is being accumulated by the
Master limited is considered as the expenses in the project for deriving the actual income generated
from investment. the expenses of $100,000 is been detected from the cash flow of the company to
compensate the loss in income generated from each year by renting the place. The assumption
considered in the project evaluation is according to the laid down assumptions.
The initial investment of the project is mainly calculated by adding the plant, equipment,
consultation fees and working capital cost. The total initial investment is at the levels of
11,510,000, which is needed for the project to commence and start. The working capital
requirement is at the level of 15% of the revenue generated in 1st year. This initial investment
conducted in year 0 might help in reducing the actual financial position of the project in
generating high rate of returns.
The total revenue is calculated from the rising sales and selling price of the project over the
period of five years. In addition, the cost of goods is assumed to be at the levels, of 50% of
the revenue, which will be generated from investment. Moreover, the depreciation is
⊘ This is a preview!⊘
Do you want full access?
Subscribe today to unlock all pages.
Trusted by 1+ million students worldwide
CORPORATE FINANCE
9
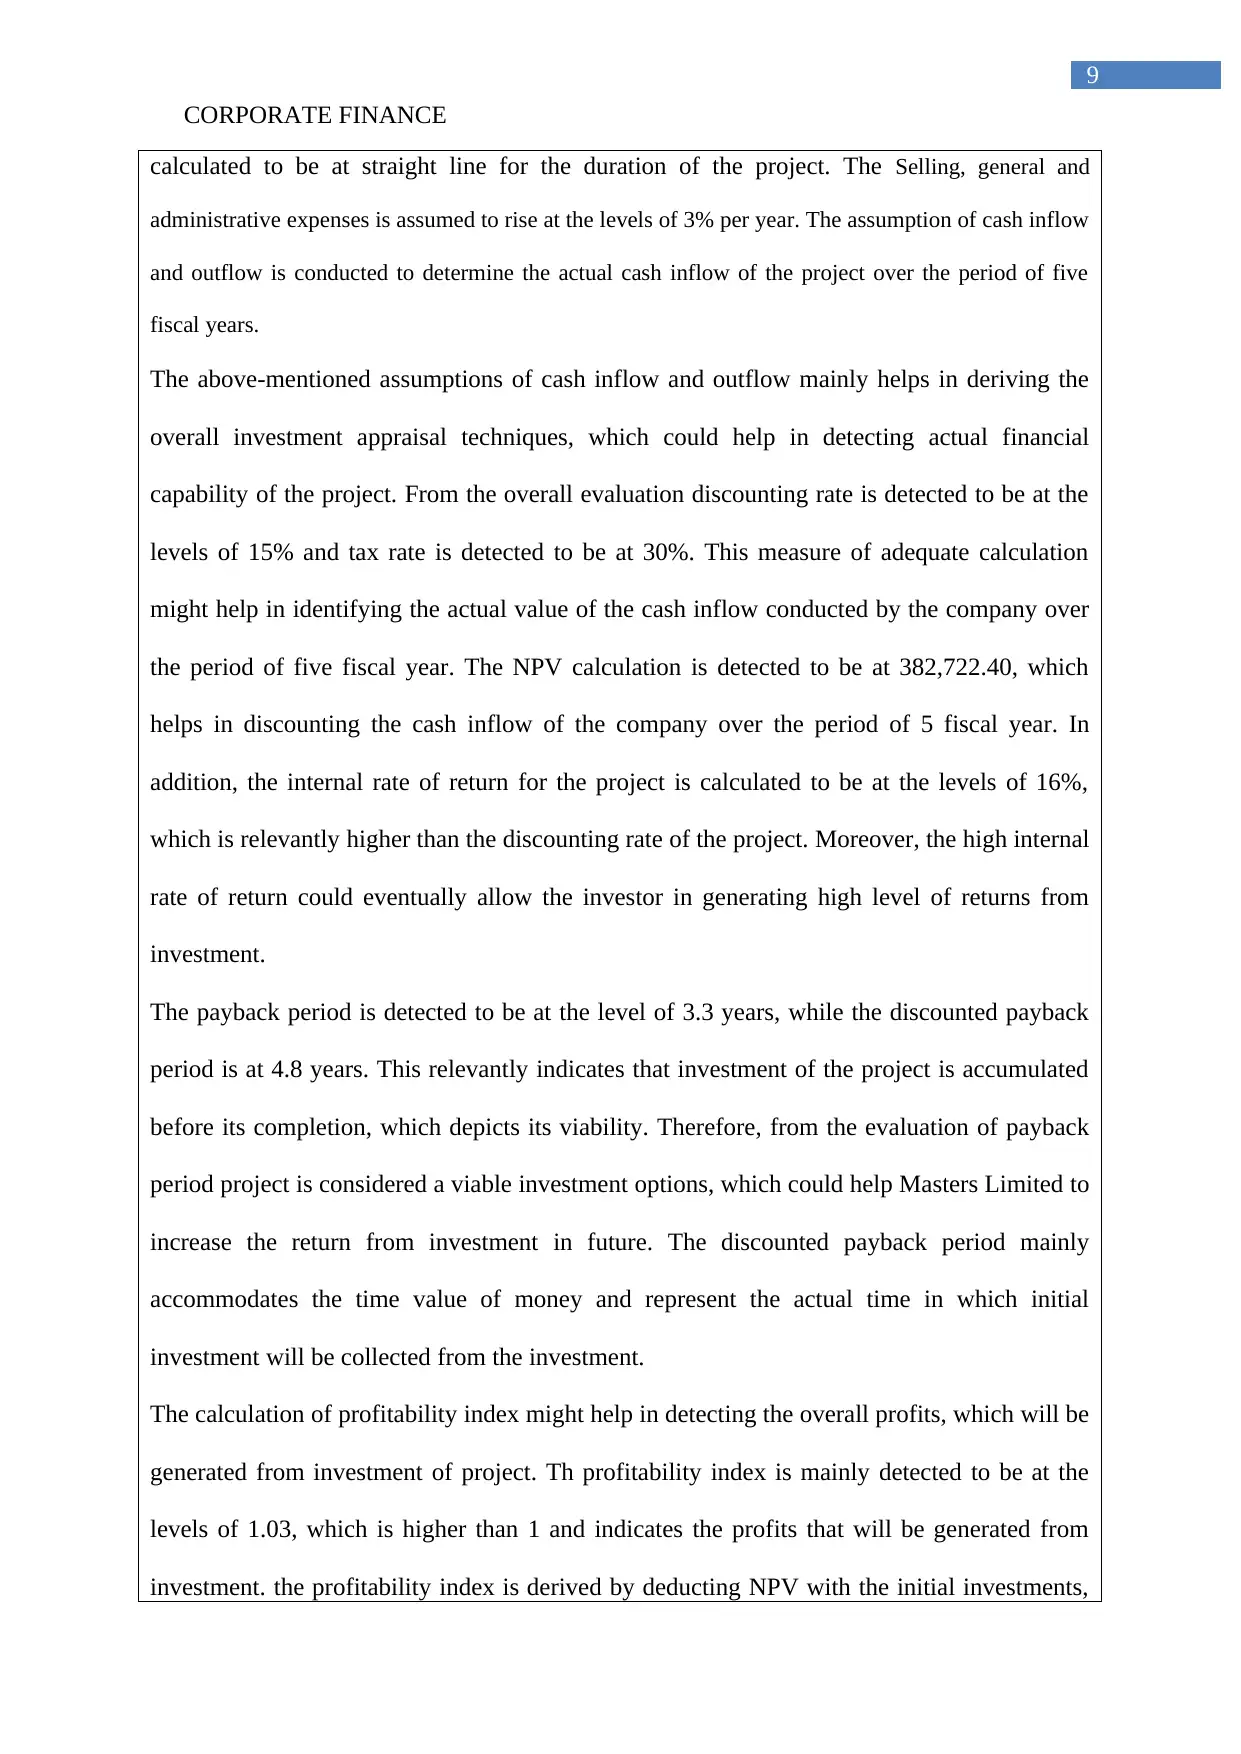
calculated to be at straight line for the duration of the project. The Selling, general and
administrative expenses is assumed to rise at the levels of 3% per year. The assumption of cash inflow
and outflow is conducted to determine the actual cash inflow of the project over the period of five
fiscal years.
The above-mentioned assumptions of cash inflow and outflow mainly helps in deriving the
overall investment appraisal techniques, which could help in detecting actual financial
capability of the project. From the overall evaluation discounting rate is detected to be at the
levels of 15% and tax rate is detected to be at 30%. This measure of adequate calculation
might help in identifying the actual value of the cash inflow conducted by the company over
the period of five fiscal year. The NPV calculation is detected to be at 382,722.40, which
helps in discounting the cash inflow of the company over the period of 5 fiscal year. In
addition, the internal rate of return for the project is calculated to be at the levels of 16%,
which is relevantly higher than the discounting rate of the project. Moreover, the high internal
rate of return could eventually allow the investor in generating high level of returns from
investment.
The payback period is detected to be at the level of 3.3 years, while the discounted payback
period is at 4.8 years. This relevantly indicates that investment of the project is accumulated
before its completion, which depicts its viability. Therefore, from the evaluation of payback
period project is considered a viable investment options, which could help Masters Limited to
increase the return from investment in future. The discounted payback period mainly
accommodates the time value of money and represent the actual time in which initial
investment will be collected from the investment.
The calculation of profitability index might help in detecting the overall profits, which will be
generated from investment of project. Th profitability index is mainly detected to be at the
levels of 1.03, which is higher than 1 and indicates the profits that will be generated from
investment. the profitability index is derived by deducting NPV with the initial investments,
9
calculated to be at straight line for the duration of the project. The Selling, general and
administrative expenses is assumed to rise at the levels of 3% per year. The assumption of cash inflow
and outflow is conducted to determine the actual cash inflow of the project over the period of five
fiscal years.
The above-mentioned assumptions of cash inflow and outflow mainly helps in deriving the
overall investment appraisal techniques, which could help in detecting actual financial
capability of the project. From the overall evaluation discounting rate is detected to be at the
levels of 15% and tax rate is detected to be at 30%. This measure of adequate calculation
might help in identifying the actual value of the cash inflow conducted by the company over
the period of five fiscal year. The NPV calculation is detected to be at 382,722.40, which
helps in discounting the cash inflow of the company over the period of 5 fiscal year. In
addition, the internal rate of return for the project is calculated to be at the levels of 16%,
which is relevantly higher than the discounting rate of the project. Moreover, the high internal
rate of return could eventually allow the investor in generating high level of returns from
investment.
The payback period is detected to be at the level of 3.3 years, while the discounted payback
period is at 4.8 years. This relevantly indicates that investment of the project is accumulated
before its completion, which depicts its viability. Therefore, from the evaluation of payback
period project is considered a viable investment options, which could help Masters Limited to
increase the return from investment in future. The discounted payback period mainly
accommodates the time value of money and represent the actual time in which initial
investment will be collected from the investment.
The calculation of profitability index might help in detecting the overall profits, which will be
generated from investment of project. Th profitability index is mainly detected to be at the
levels of 1.03, which is higher than 1 and indicates the profits that will be generated from
investment. the profitability index is derived by deducting NPV with the initial investments,
1 out of 10
Related Documents


Your All-in-One AI-Powered Toolkit for Academic Success.
+13062052269
info@desklib.com
Available 24*7 on WhatsApp / Email
![[object Object]](/_next/static/media/star-bottom.7253800d.svg)
Unlock your academic potential
Copyright © 2020–2026 A2Z Services. All Rights Reserved. Developed and managed by ZUCOL.