Corporate Finance Analysis Report: Woodside Petroleum Ltd
VerifiedAdded on 2020/05/28
|11
|2049
|76
Report
AI Summary
This comprehensive corporate finance report examines the financial performance and strategic decisions of Woodside Petroleum Ltd and Royal Dutch Shell. It begins with an overview of the companies' backgrounds, industry analysis, identification of key opportunities and threats, and then proceeds to calculate and analyze the cash conversion cycle for Woodside Petroleum. The report also explores short-term and long-term debt financing instruments, assessing the company's debt usage. Further analysis includes the valuation of bonds, the portrayal of share prices, and the projection of Free Cash Flow (FCF) for a gas project. Finally, the report calculates and evaluates the Net Present Value (NPV) of the gas project under different Weighted Average Cost of Capital (WACC) scenarios, providing insights into project viability and financial implications. The report concludes with a detailed reference and bibliography of the sources used.
Running head: CORPORATE FINANCE
Corporate Finance
Name of the Student:
Name of the University:
Authors Note:
Corporate Finance
Name of the Student:
Name of the University:
Authors Note:
Paraphrase This Document
Need a fresh take? Get an instant paraphrase of this document with our AI Paraphraser
CORPORATE FINANCE
1
Table of Contents
2a. Describing background and the industry in which company operates. Identifying one key
opportunity and two key threats of the company:......................................................................2
2b. Calculating cash conversion cycle and comparing it with previous year and industry peer:
....................................................................................................................................................3
2c. Stating example of short term debt financing instrument and long-term debt financing
instrument, while depicting whether the company has used debt financing in 2016:................4
2d.i) Conniving bond price for 6/12/2018:................................................................................4
2d.ii) Evaluating the bond price with calculated figure and mentioned figure, while detecting
the reason behind its selling at par:............................................................................................5
2e.) Portraying share price of Shell in euros:.............................................................................5
3a) Portraying FCF of Shell’s gas project:.................................................................................6
3b.a) Portraying Net present value of the project at WACC 5.94%:.........................................7
3b.b) Portraying Net present value of the project at WACC 8.00%:.........................................7
Reference and Bibliography:......................................................................................................9
CORPORATE FINANCE
2
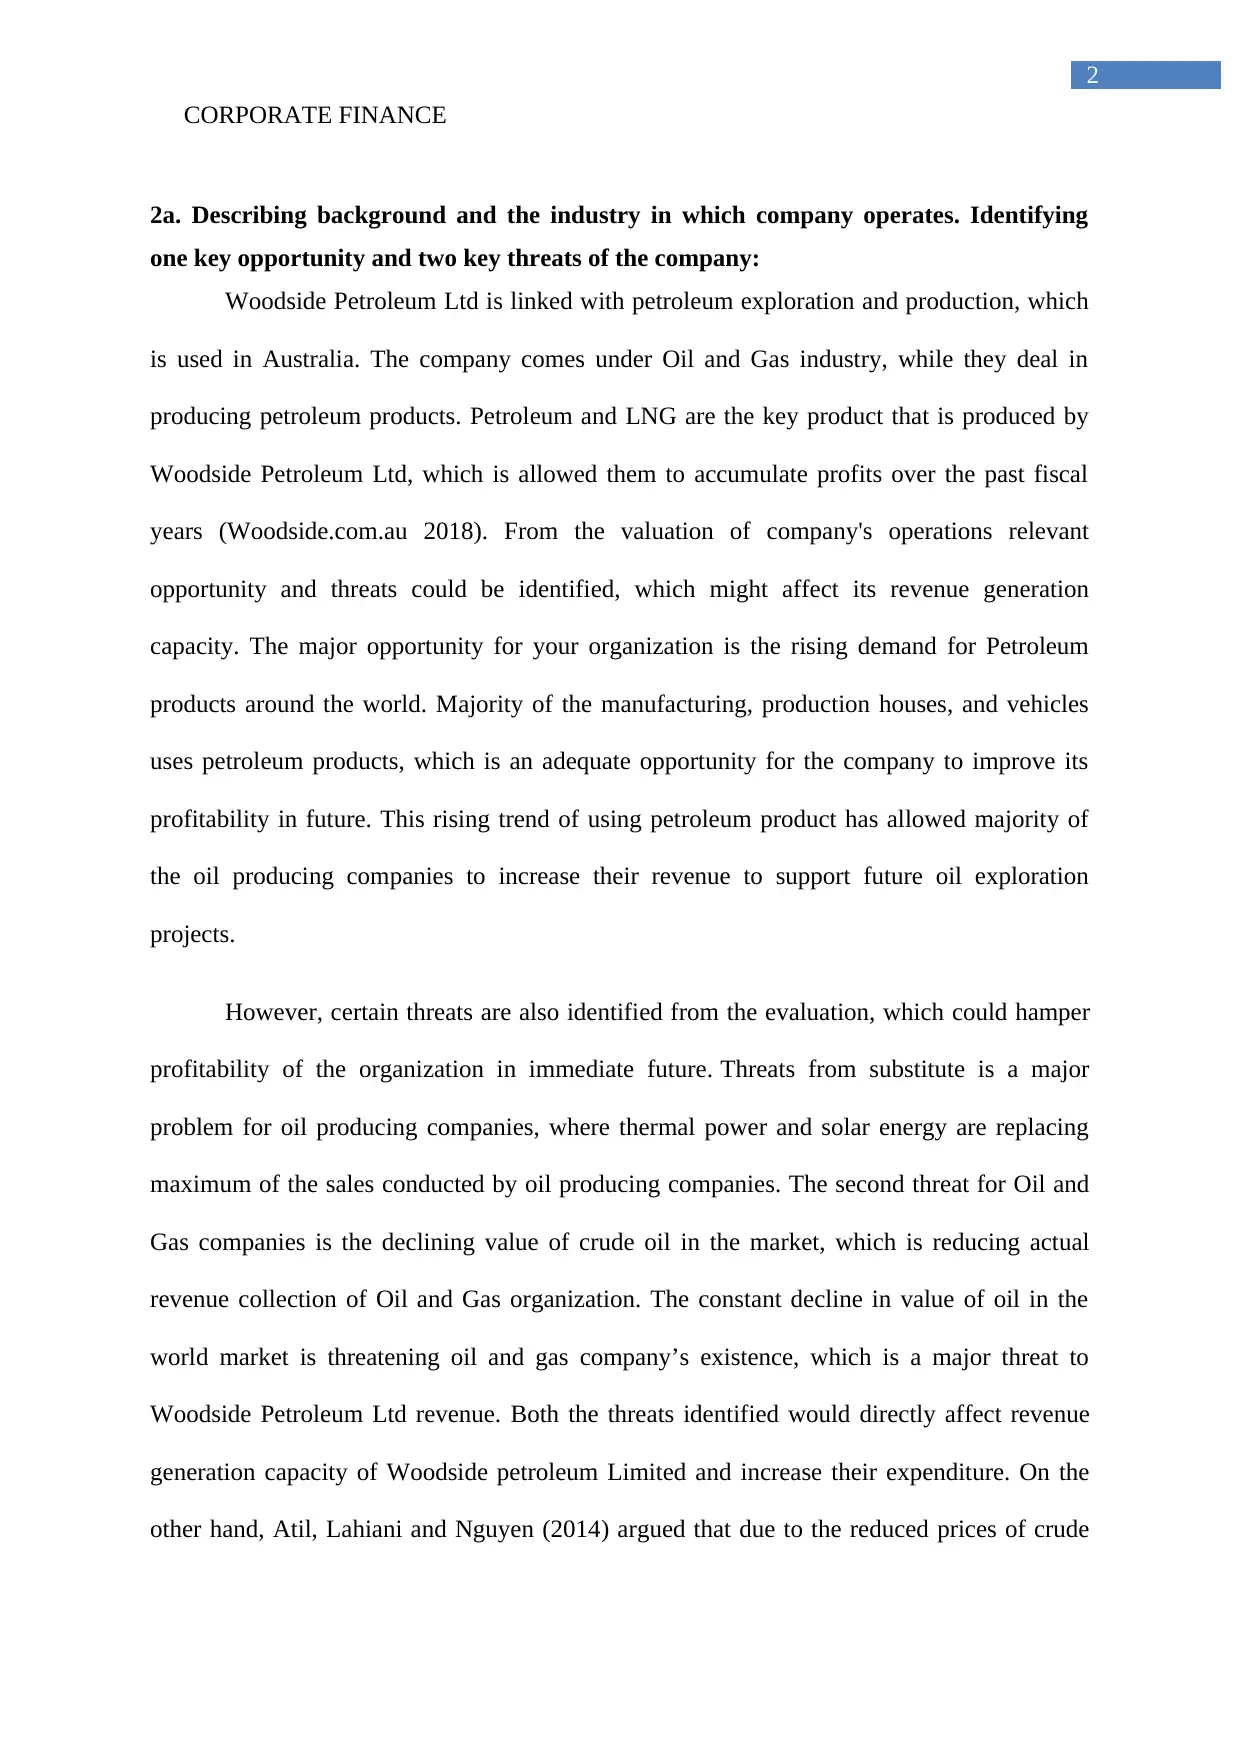
2a. Describing background and the industry in which company operates. Identifying
one key opportunity and two key threats of the company:
Woodside Petroleum Ltd is linked with petroleum exploration and production, which
is used in Australia. The company comes under Oil and Gas industry, while they deal in
producing petroleum products. Petroleum and LNG are the key product that is produced by
Woodside Petroleum Ltd, which is allowed them to accumulate profits over the past fiscal
years (Woodside.com.au 2018). From the valuation of company's operations relevant
opportunity and threats could be identified, which might affect its revenue generation
capacity. The major opportunity for your organization is the rising demand for Petroleum
products around the world. Majority of the manufacturing, production houses, and vehicles
uses petroleum products, which is an adequate opportunity for the company to improve its
profitability in future. This rising trend of using petroleum product has allowed majority of
the oil producing companies to increase their revenue to support future oil exploration
projects.
However, certain threats are also identified from the evaluation, which could hamper
profitability of the organization in immediate future. Threats from substitute is a major
problem for oil producing companies, where thermal power and solar energy are replacing
maximum of the sales conducted by oil producing companies. The second threat for Oil and
Gas companies is the declining value of crude oil in the market, which is reducing actual
revenue collection of Oil and Gas organization. The constant decline in value of oil in the
world market is threatening oil and gas company’s existence, which is a major threat to
Woodside Petroleum Ltd revenue. Both the threats identified would directly affect revenue
generation capacity of Woodside petroleum Limited and increase their expenditure. On the
other hand, Atil, Lahiani and Nguyen (2014) argued that due to the reduced prices of crude
2
2a. Describing background and the industry in which company operates. Identifying
one key opportunity and two key threats of the company:
Woodside Petroleum Ltd is linked with petroleum exploration and production, which
is used in Australia. The company comes under Oil and Gas industry, while they deal in
producing petroleum products. Petroleum and LNG are the key product that is produced by
Woodside Petroleum Ltd, which is allowed them to accumulate profits over the past fiscal
years (Woodside.com.au 2018). From the valuation of company's operations relevant
opportunity and threats could be identified, which might affect its revenue generation
capacity. The major opportunity for your organization is the rising demand for Petroleum
products around the world. Majority of the manufacturing, production houses, and vehicles
uses petroleum products, which is an adequate opportunity for the company to improve its
profitability in future. This rising trend of using petroleum product has allowed majority of
the oil producing companies to increase their revenue to support future oil exploration
projects.
However, certain threats are also identified from the evaluation, which could hamper
profitability of the organization in immediate future. Threats from substitute is a major
problem for oil producing companies, where thermal power and solar energy are replacing
maximum of the sales conducted by oil producing companies. The second threat for Oil and
Gas companies is the declining value of crude oil in the market, which is reducing actual
revenue collection of Oil and Gas organization. The constant decline in value of oil in the
world market is threatening oil and gas company’s existence, which is a major threat to
Woodside Petroleum Ltd revenue. Both the threats identified would directly affect revenue
generation capacity of Woodside petroleum Limited and increase their expenditure. On the
other hand, Atil, Lahiani and Nguyen (2014) argued that due to the reduced prices of crude
⊘ This is a preview!⊘
Do you want full access?
Subscribe today to unlock all pages.
Trusted by 1+ million students worldwide
CORPORATE FINANCE
3
oil products the increment in substitute demand is declining, which is relatively a positive
action for oil and gas companies.
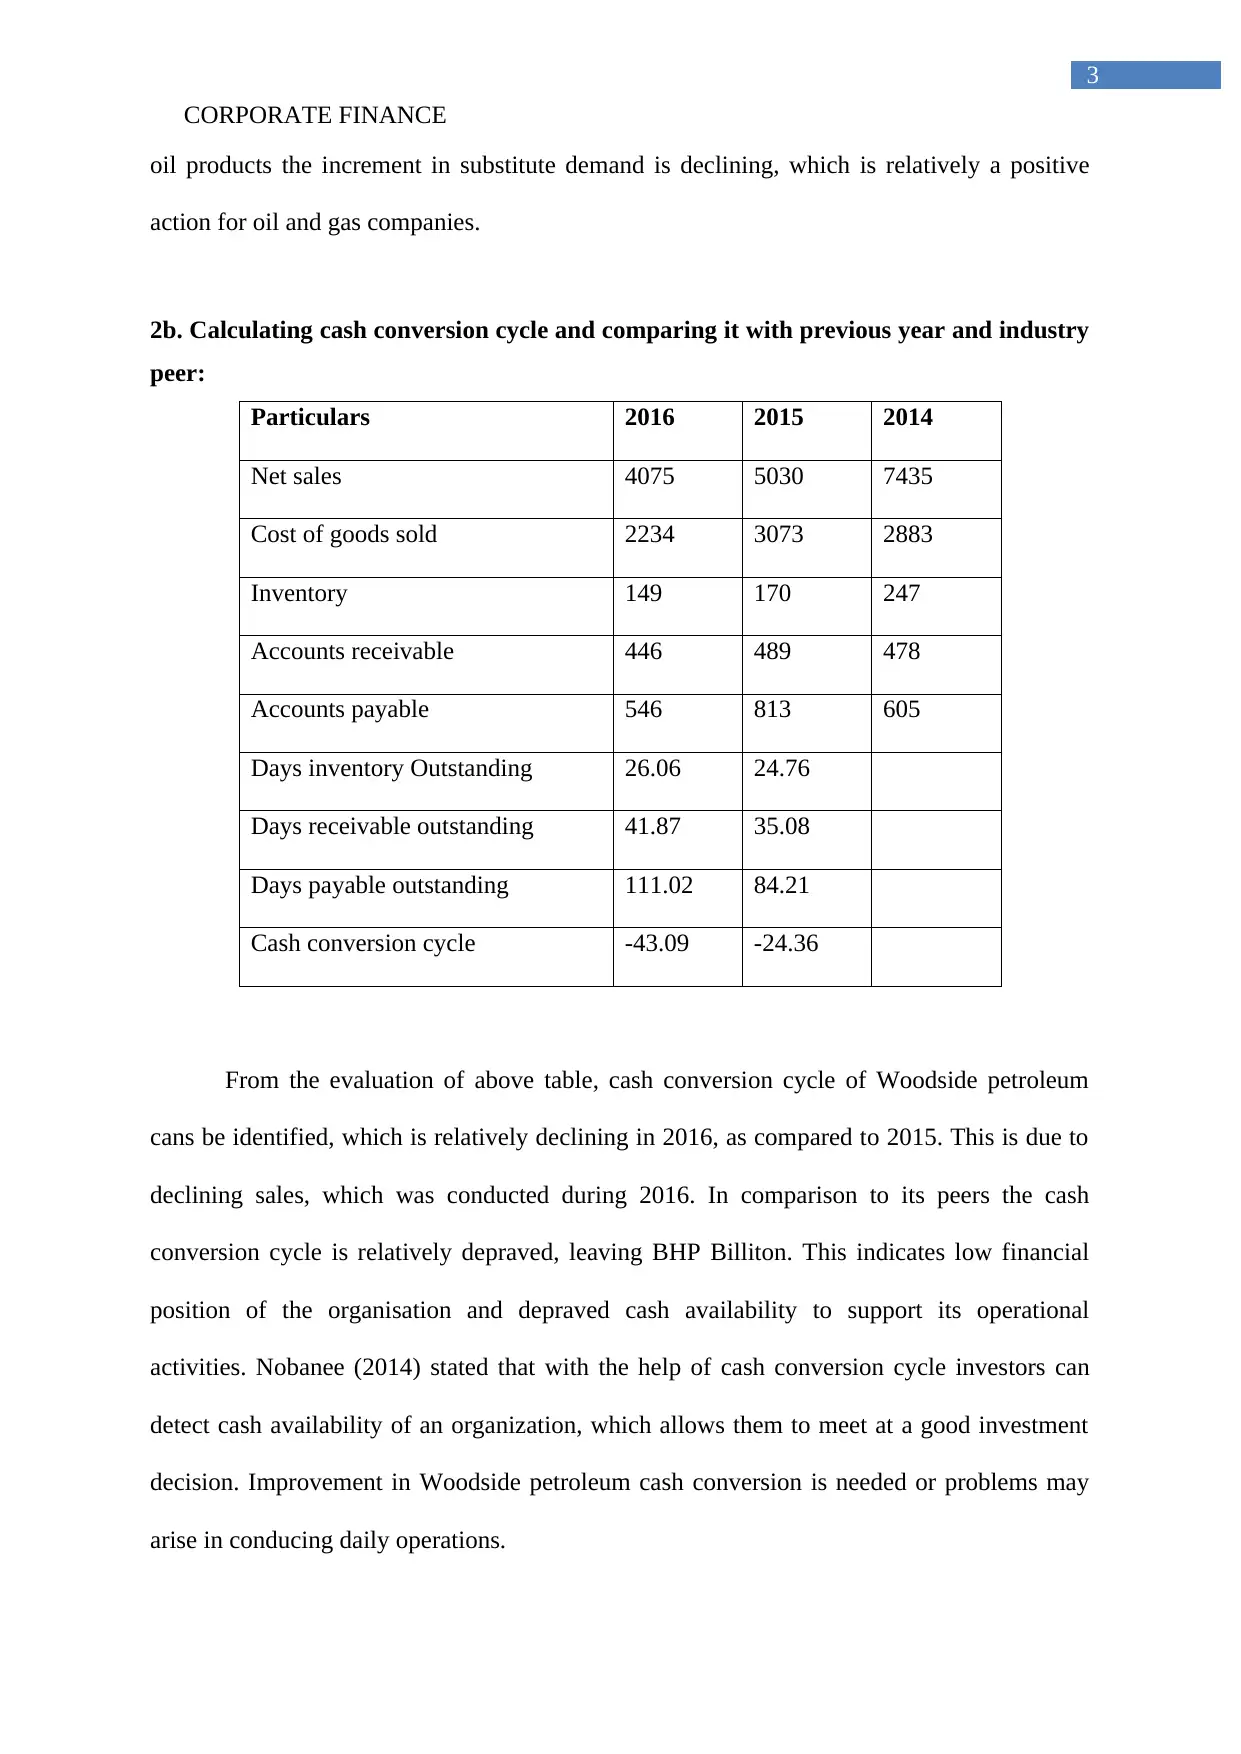
2b. Calculating cash conversion cycle and comparing it with previous year and industry
peer:
Particulars 2016 2015 2014
Net sales 4075 5030 7435
Cost of goods sold 2234 3073 2883
Inventory 149 170 247
Accounts receivable 446 489 478
Accounts payable 546 813 605
Days inventory Outstanding 26.06 24.76
Days receivable outstanding 41.87 35.08
Days payable outstanding 111.02 84.21
Cash conversion cycle -43.09 -24.36
From the evaluation of above table, cash conversion cycle of Woodside petroleum
cans be identified, which is relatively declining in 2016, as compared to 2015. This is due to
declining sales, which was conducted during 2016. In comparison to its peers the cash
conversion cycle is relatively depraved, leaving BHP Billiton. This indicates low financial
position of the organisation and depraved cash availability to support its operational
activities. Nobanee (2014) stated that with the help of cash conversion cycle investors can
detect cash availability of an organization, which allows them to meet at a good investment
decision. Improvement in Woodside petroleum cash conversion is needed or problems may
arise in conducing daily operations.
3
oil products the increment in substitute demand is declining, which is relatively a positive
action for oil and gas companies.
2b. Calculating cash conversion cycle and comparing it with previous year and industry
peer:
Particulars 2016 2015 2014
Net sales 4075 5030 7435
Cost of goods sold 2234 3073 2883
Inventory 149 170 247
Accounts receivable 446 489 478
Accounts payable 546 813 605
Days inventory Outstanding 26.06 24.76
Days receivable outstanding 41.87 35.08
Days payable outstanding 111.02 84.21
Cash conversion cycle -43.09 -24.36
From the evaluation of above table, cash conversion cycle of Woodside petroleum
cans be identified, which is relatively declining in 2016, as compared to 2015. This is due to
declining sales, which was conducted during 2016. In comparison to its peers the cash
conversion cycle is relatively depraved, leaving BHP Billiton. This indicates low financial
position of the organisation and depraved cash availability to support its operational
activities. Nobanee (2014) stated that with the help of cash conversion cycle investors can
detect cash availability of an organization, which allows them to meet at a good investment
decision. Improvement in Woodside petroleum cash conversion is needed or problems may
arise in conducing daily operations.
Paraphrase This Document
Need a fresh take? Get an instant paraphrase of this document with our AI Paraphraser
CORPORATE FINANCE
4
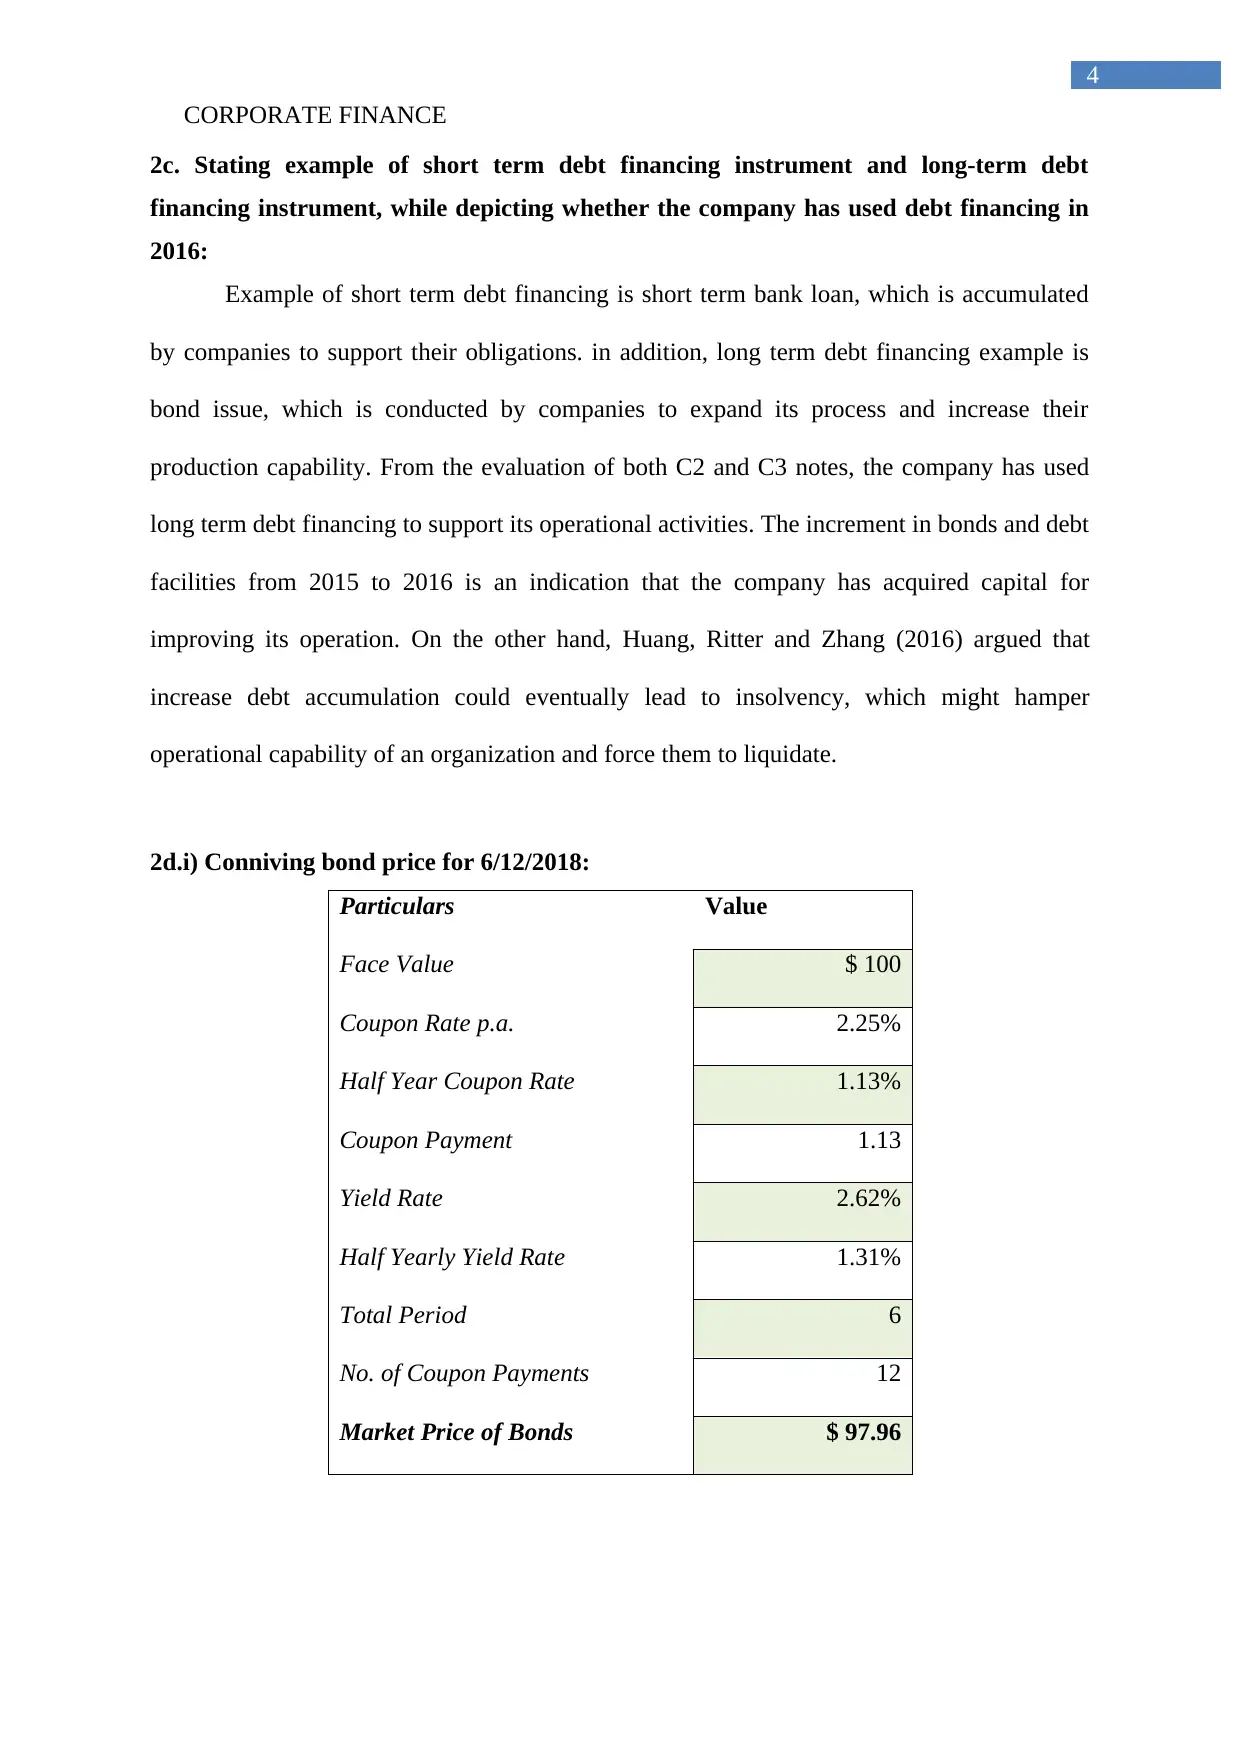
2c. Stating example of short term debt financing instrument and long-term debt
financing instrument, while depicting whether the company has used debt financing in
2016:
Example of short term debt financing is short term bank loan, which is accumulated
by companies to support their obligations. in addition, long term debt financing example is
bond issue, which is conducted by companies to expand its process and increase their
production capability. From the evaluation of both C2 and C3 notes, the company has used
long term debt financing to support its operational activities. The increment in bonds and debt
facilities from 2015 to 2016 is an indication that the company has acquired capital for
improving its operation. On the other hand, Huang, Ritter and Zhang (2016) argued that
increase debt accumulation could eventually lead to insolvency, which might hamper
operational capability of an organization and force them to liquidate.
2d.i) Conniving bond price for 6/12/2018:
Particulars Value
Face Value $ 100
Coupon Rate p.a. 2.25%
Half Year Coupon Rate 1.13%
Coupon Payment 1.13
Yield Rate 2.62%
Half Yearly Yield Rate 1.31%
Total Period 6
No. of Coupon Payments 12
Market Price of Bonds $ 97.96
4
2c. Stating example of short term debt financing instrument and long-term debt
financing instrument, while depicting whether the company has used debt financing in
2016:
Example of short term debt financing is short term bank loan, which is accumulated
by companies to support their obligations. in addition, long term debt financing example is
bond issue, which is conducted by companies to expand its process and increase their
production capability. From the evaluation of both C2 and C3 notes, the company has used
long term debt financing to support its operational activities. The increment in bonds and debt
facilities from 2015 to 2016 is an indication that the company has acquired capital for
improving its operation. On the other hand, Huang, Ritter and Zhang (2016) argued that
increase debt accumulation could eventually lead to insolvency, which might hamper
operational capability of an organization and force them to liquidate.
2d.i) Conniving bond price for 6/12/2018:
Particulars Value
Face Value $ 100
Coupon Rate p.a. 2.25%
Half Year Coupon Rate 1.13%
Coupon Payment 1.13
Yield Rate 2.62%
Half Yearly Yield Rate 1.31%
Total Period 6
No. of Coupon Payments 12
Market Price of Bonds $ 97.96
CORPORATE FINANCE
5
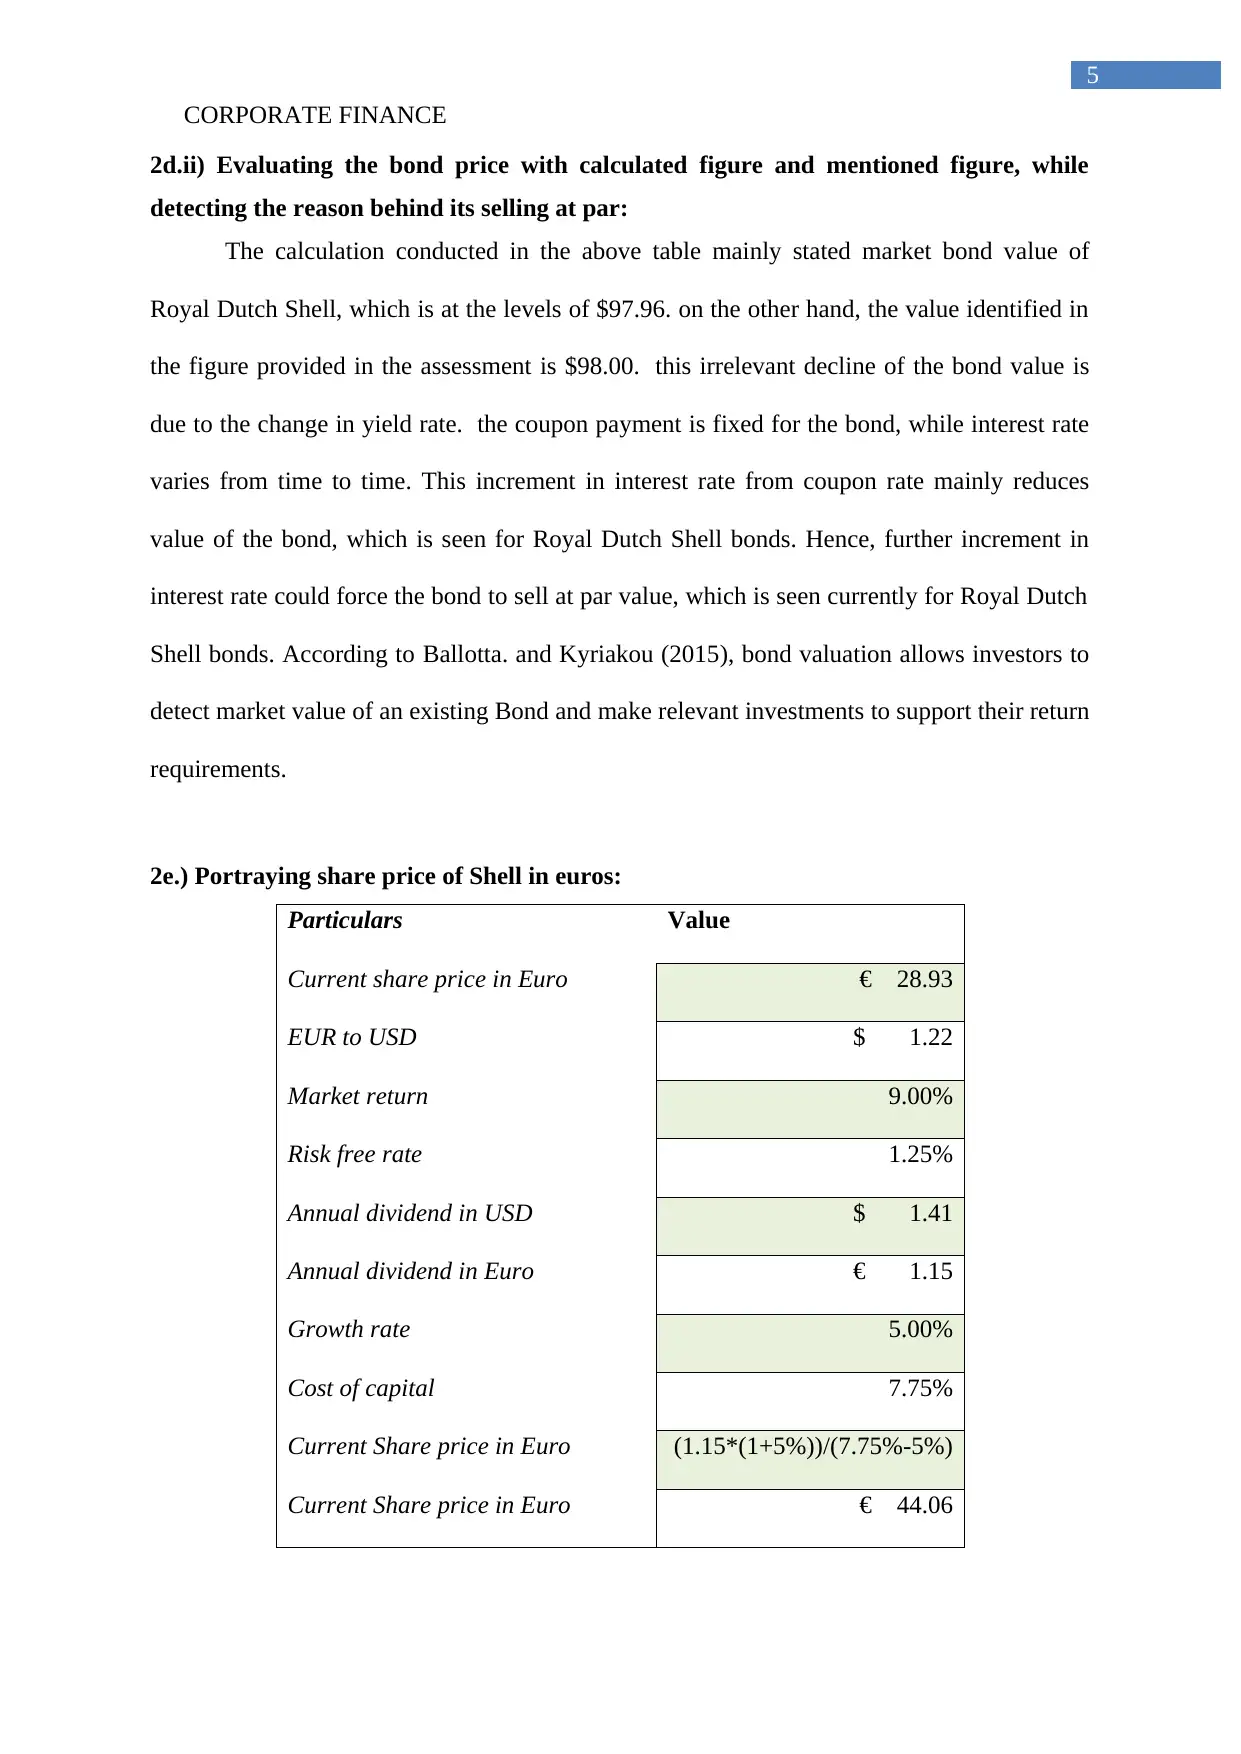
2d.ii) Evaluating the bond price with calculated figure and mentioned figure, while
detecting the reason behind its selling at par:
The calculation conducted in the above table mainly stated market bond value of
Royal Dutch Shell, which is at the levels of $97.96. on the other hand, the value identified in
the figure provided in the assessment is $98.00. this irrelevant decline of the bond value is
due to the change in yield rate. the coupon payment is fixed for the bond, while interest rate
varies from time to time. This increment in interest rate from coupon rate mainly reduces
value of the bond, which is seen for Royal Dutch Shell bonds. Hence, further increment in
interest rate could force the bond to sell at par value, which is seen currently for Royal Dutch
Shell bonds. According to Ballotta. and Kyriakou (2015), bond valuation allows investors to
detect market value of an existing Bond and make relevant investments to support their return
requirements.
2e.) Portraying share price of Shell in euros:
Particulars Value
Current share price in Euro € 28.93
EUR to USD $ 1.22
Market return 9.00%
Risk free rate 1.25%
Annual dividend in USD $ 1.41
Annual dividend in Euro € 1.15
Growth rate 5.00%
Cost of capital 7.75%
Current Share price in Euro (1.15*(1+5%))/(7.75%-5%)
Current Share price in Euro € 44.06
5
2d.ii) Evaluating the bond price with calculated figure and mentioned figure, while
detecting the reason behind its selling at par:
The calculation conducted in the above table mainly stated market bond value of
Royal Dutch Shell, which is at the levels of $97.96. on the other hand, the value identified in
the figure provided in the assessment is $98.00. this irrelevant decline of the bond value is
due to the change in yield rate. the coupon payment is fixed for the bond, while interest rate
varies from time to time. This increment in interest rate from coupon rate mainly reduces
value of the bond, which is seen for Royal Dutch Shell bonds. Hence, further increment in
interest rate could force the bond to sell at par value, which is seen currently for Royal Dutch
Shell bonds. According to Ballotta. and Kyriakou (2015), bond valuation allows investors to
detect market value of an existing Bond and make relevant investments to support their return
requirements.
2e.) Portraying share price of Shell in euros:
Particulars Value
Current share price in Euro € 28.93
EUR to USD $ 1.22
Market return 9.00%
Risk free rate 1.25%
Annual dividend in USD $ 1.41
Annual dividend in Euro € 1.15
Growth rate 5.00%
Cost of capital 7.75%
Current Share price in Euro (1.15*(1+5%))/(7.75%-5%)
Current Share price in Euro € 44.06
⊘ This is a preview!⊘
Do you want full access?
Subscribe today to unlock all pages.
Trusted by 1+ million students worldwide
CORPORATE FINANCE
6
The above calculation mainly helps in identifying theoretical share value of Royal Dutch
Shell, which could allow investors in making adequate investment decisions. Furthermore,
the current price level of the organization is mainly at € 28.93, while the theoretical share
price is at € 44.06. This indicates that more growth in share value of the organization can be
achieved in future, which would allow investors to increase the return from investment.
Hence, buying shares of Royal Dutch Shell is adequate, which would allow investors to
improve their capital growth. Lazzati and Menichini (2015) mentioned that by using dividend
discount model investors can detect investment opportunities, which might increase their
return from investments and raise their portfolio value. On the other hand, D'Amico (2016)
dividend discount model mainly utilizes one factor for determining actual share value of an
organization, which can be manipulated by organizations.
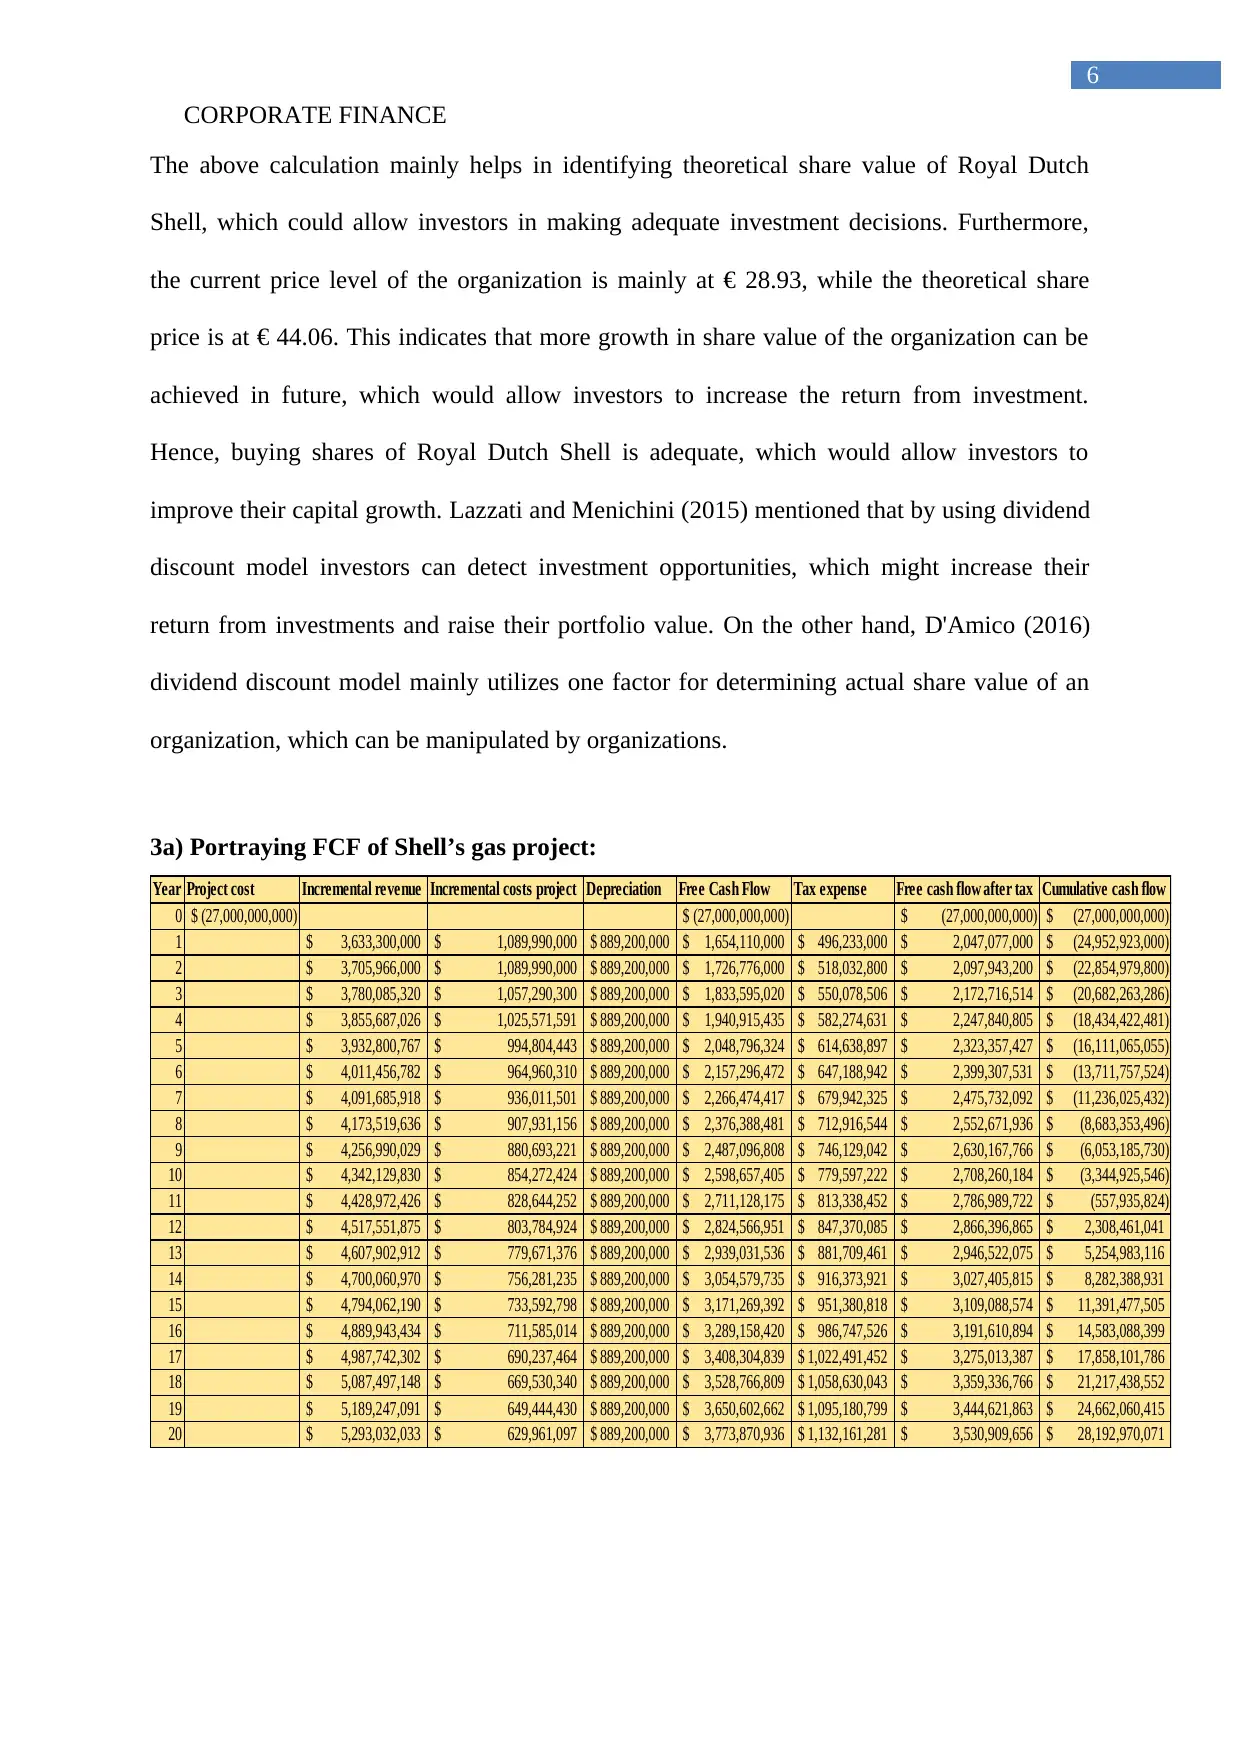
3a) Portraying FCF of Shell’s gas project:
Year Project cost Incremental revenue Incremental costs project Depreciation Free Cash Flow Tax expense Free cash flow after tax Cumulative cash flow
0 (27,000,000,000)$ (27,000,000,000)$ (27,000,000,000)$ (27,000,000,000)$
1 3,633,300,000$ 1,089,990,000$ 889,200,000$ 1,654,110,000$ 496,233,000$ 2,047,077,000$ (24,952,923,000)$
2 3,705,966,000$ 1,089,990,000$ 889,200,000$ 1,726,776,000$ 518,032,800$ 2,097,943,200$ (22,854,979,800)$
3 3,780,085,320$ 1,057,290,300$ 889,200,000$ 1,833,595,020$ 550,078,506$ 2,172,716,514$ (20,682,263,286)$
4 3,855,687,026$ 1,025,571,591$ 889,200,000$ 1,940,915,435$ 582,274,631$ 2,247,840,805$ (18,434,422,481)$
5 3,932,800,767$ 994,804,443$ 889,200,000$ 2,048,796,324$ 614,638,897$ 2,323,357,427$ (16,111,065,055)$
6 4,011,456,782$ 964,960,310$ 889,200,000$ 2,157,296,472$ 647,188,942$ 2,399,307,531$ (13,711,757,524)$
7 4,091,685,918$ 936,011,501$ 889,200,000$ 2,266,474,417$ 679,942,325$ 2,475,732,092$ (11,236,025,432)$
8 4,173,519,636$ 907,931,156$ 889,200,000$ 2,376,388,481$ 712,916,544$ 2,552,671,936$ (8,683,353,496)$
9 4,256,990,029$ 880,693,221$ 889,200,000$ 2,487,096,808$ 746,129,042$ 2,630,167,766$ (6,053,185,730)$
10 4,342,129,830$ 854,272,424$ 889,200,000$ 2,598,657,405$ 779,597,222$ 2,708,260,184$ (3,344,925,546)$
11 4,428,972,426$ 828,644,252$ 889,200,000$ 2,711,128,175$ 813,338,452$ 2,786,989,722$ (557,935,824)$
12 4,517,551,875$ 803,784,924$ 889,200,000$ 2,824,566,951$ 847,370,085$ 2,866,396,865$ 2,308,461,041$
13 4,607,902,912$ 779,671,376$ 889,200,000$ 2,939,031,536$ 881,709,461$ 2,946,522,075$ 5,254,983,116$
14 4,700,060,970$ 756,281,235$ 889,200,000$ 3,054,579,735$ 916,373,921$ 3,027,405,815$ 8,282,388,931$
15 4,794,062,190$ 733,592,798$ 889,200,000$ 3,171,269,392$ 951,380,818$ 3,109,088,574$ 11,391,477,505$
16 4,889,943,434$ 711,585,014$ 889,200,000$ 3,289,158,420$ 986,747,526$ 3,191,610,894$ 14,583,088,399$
17 4,987,742,302$ 690,237,464$ 889,200,000$ 3,408,304,839$ 1,022,491,452$ 3,275,013,387$ 17,858,101,786$
18 5,087,497,148$ 669,530,340$ 889,200,000$ 3,528,766,809$ 1,058,630,043$ 3,359,336,766$ 21,217,438,552$
19 5,189,247,091$ 649,444,430$ 889,200,000$ 3,650,602,662$ 1,095,180,799$ 3,444,621,863$ 24,662,060,415$
20 5,293,032,033$ 629,961,097$ 889,200,000$ 3,773,870,936$ 1,132,161,281$ 3,530,909,656$ 28,192,970,071$
6
The above calculation mainly helps in identifying theoretical share value of Royal Dutch
Shell, which could allow investors in making adequate investment decisions. Furthermore,
the current price level of the organization is mainly at € 28.93, while the theoretical share
price is at € 44.06. This indicates that more growth in share value of the organization can be
achieved in future, which would allow investors to increase the return from investment.
Hence, buying shares of Royal Dutch Shell is adequate, which would allow investors to
improve their capital growth. Lazzati and Menichini (2015) mentioned that by using dividend
discount model investors can detect investment opportunities, which might increase their
return from investments and raise their portfolio value. On the other hand, D'Amico (2016)
dividend discount model mainly utilizes one factor for determining actual share value of an
organization, which can be manipulated by organizations.
3a) Portraying FCF of Shell’s gas project:
Year Project cost Incremental revenue Incremental costs project Depreciation Free Cash Flow Tax expense Free cash flow after tax Cumulative cash flow
0 (27,000,000,000)$ (27,000,000,000)$ (27,000,000,000)$ (27,000,000,000)$
1 3,633,300,000$ 1,089,990,000$ 889,200,000$ 1,654,110,000$ 496,233,000$ 2,047,077,000$ (24,952,923,000)$
2 3,705,966,000$ 1,089,990,000$ 889,200,000$ 1,726,776,000$ 518,032,800$ 2,097,943,200$ (22,854,979,800)$
3 3,780,085,320$ 1,057,290,300$ 889,200,000$ 1,833,595,020$ 550,078,506$ 2,172,716,514$ (20,682,263,286)$
4 3,855,687,026$ 1,025,571,591$ 889,200,000$ 1,940,915,435$ 582,274,631$ 2,247,840,805$ (18,434,422,481)$
5 3,932,800,767$ 994,804,443$ 889,200,000$ 2,048,796,324$ 614,638,897$ 2,323,357,427$ (16,111,065,055)$
6 4,011,456,782$ 964,960,310$ 889,200,000$ 2,157,296,472$ 647,188,942$ 2,399,307,531$ (13,711,757,524)$
7 4,091,685,918$ 936,011,501$ 889,200,000$ 2,266,474,417$ 679,942,325$ 2,475,732,092$ (11,236,025,432)$
8 4,173,519,636$ 907,931,156$ 889,200,000$ 2,376,388,481$ 712,916,544$ 2,552,671,936$ (8,683,353,496)$
9 4,256,990,029$ 880,693,221$ 889,200,000$ 2,487,096,808$ 746,129,042$ 2,630,167,766$ (6,053,185,730)$
10 4,342,129,830$ 854,272,424$ 889,200,000$ 2,598,657,405$ 779,597,222$ 2,708,260,184$ (3,344,925,546)$
11 4,428,972,426$ 828,644,252$ 889,200,000$ 2,711,128,175$ 813,338,452$ 2,786,989,722$ (557,935,824)$
12 4,517,551,875$ 803,784,924$ 889,200,000$ 2,824,566,951$ 847,370,085$ 2,866,396,865$ 2,308,461,041$
13 4,607,902,912$ 779,671,376$ 889,200,000$ 2,939,031,536$ 881,709,461$ 2,946,522,075$ 5,254,983,116$
14 4,700,060,970$ 756,281,235$ 889,200,000$ 3,054,579,735$ 916,373,921$ 3,027,405,815$ 8,282,388,931$
15 4,794,062,190$ 733,592,798$ 889,200,000$ 3,171,269,392$ 951,380,818$ 3,109,088,574$ 11,391,477,505$
16 4,889,943,434$ 711,585,014$ 889,200,000$ 3,289,158,420$ 986,747,526$ 3,191,610,894$ 14,583,088,399$
17 4,987,742,302$ 690,237,464$ 889,200,000$ 3,408,304,839$ 1,022,491,452$ 3,275,013,387$ 17,858,101,786$
18 5,087,497,148$ 669,530,340$ 889,200,000$ 3,528,766,809$ 1,058,630,043$ 3,359,336,766$ 21,217,438,552$
19 5,189,247,091$ 649,444,430$ 889,200,000$ 3,650,602,662$ 1,095,180,799$ 3,444,621,863$ 24,662,060,415$
20 5,293,032,033$ 629,961,097$ 889,200,000$ 3,773,870,936$ 1,132,161,281$ 3,530,909,656$ 28,192,970,071$
Paraphrase This Document
Need a fresh take? Get an instant paraphrase of this document with our AI Paraphraser
CORPORATE FINANCE
7
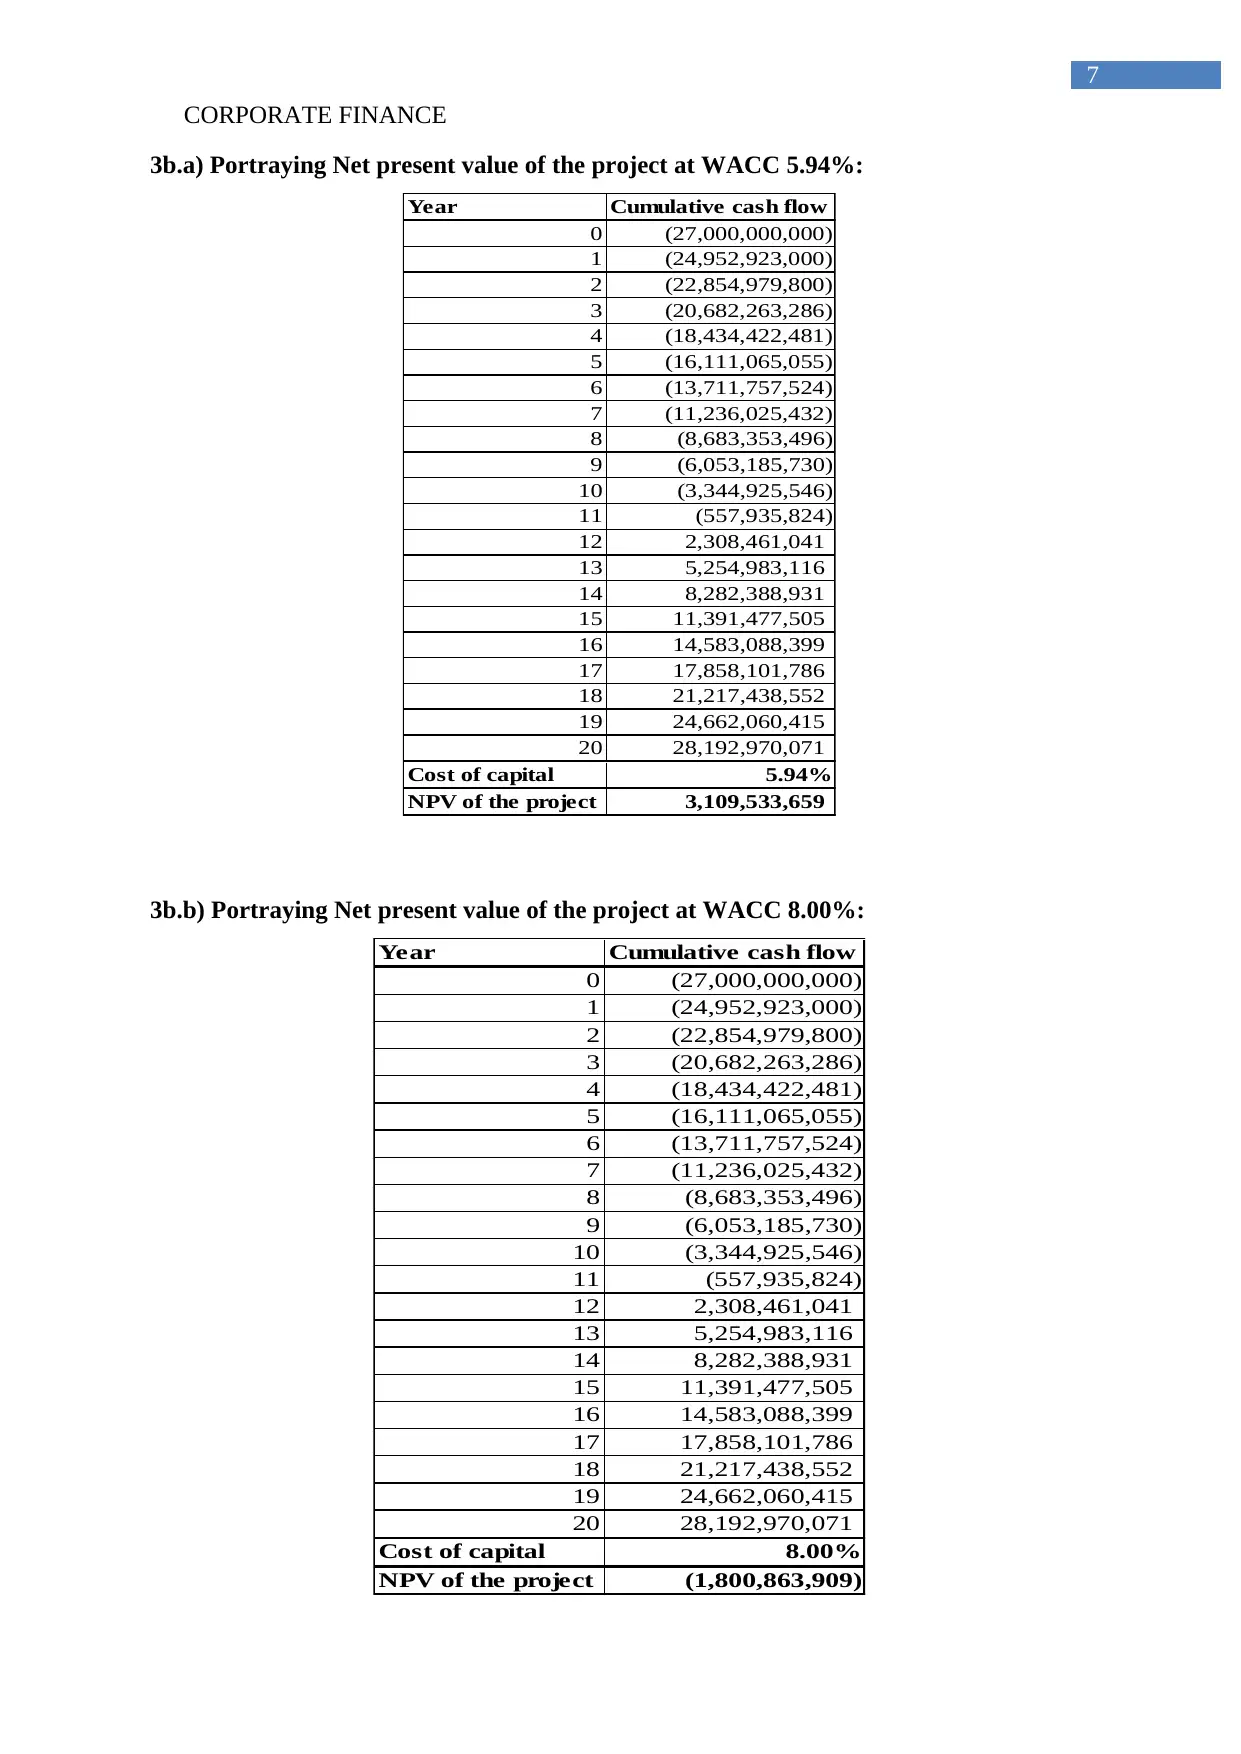
3b.a) Portraying Net present value of the project at WACC 5.94%:
Year Cumulative cash flow
0 (27,000,000,000)
1 (24,952,923,000)
2 (22,854,979,800)
3 (20,682,263,286)
4 (18,434,422,481)
5 (16,111,065,055)
6 (13,711,757,524)
7 (11,236,025,432)
8 (8,683,353,496)
9 (6,053,185,730)
10 (3,344,925,546)
11 (557,935,824)
12 2,308,461,041
13 5,254,983,116
14 8,282,388,931
15 11,391,477,505
16 14,583,088,399
17 17,858,101,786
18 21,217,438,552
19 24,662,060,415
20 28,192,970,071
Cost of capital 5.94%
NPV of the project 3,109,533,659
3b.b) Portraying Net present value of the project at WACC 8.00%:
Year Cumulative cash flow
0 (27,000,000,000)
1 (24,952,923,000)
2 (22,854,979,800)
3 (20,682,263,286)
4 (18,434,422,481)
5 (16,111,065,055)
6 (13,711,757,524)
7 (11,236,025,432)
8 (8,683,353,496)
9 (6,053,185,730)
10 (3,344,925,546)
11 (557,935,824)
12 2,308,461,041
13 5,254,983,116
14 8,282,388,931
15 11,391,477,505
16 14,583,088,399
17 17,858,101,786
18 21,217,438,552
19 24,662,060,415
20 28,192,970,071
Cost of capital 8.00%
NPV of the project (1,800,863,909)
7
3b.a) Portraying Net present value of the project at WACC 5.94%:
Year Cumulative cash flow
0 (27,000,000,000)
1 (24,952,923,000)
2 (22,854,979,800)
3 (20,682,263,286)
4 (18,434,422,481)
5 (16,111,065,055)
6 (13,711,757,524)
7 (11,236,025,432)
8 (8,683,353,496)
9 (6,053,185,730)
10 (3,344,925,546)
11 (557,935,824)
12 2,308,461,041
13 5,254,983,116
14 8,282,388,931
15 11,391,477,505
16 14,583,088,399
17 17,858,101,786
18 21,217,438,552
19 24,662,060,415
20 28,192,970,071
Cost of capital 5.94%
NPV of the project 3,109,533,659
3b.b) Portraying Net present value of the project at WACC 8.00%:
Year Cumulative cash flow
0 (27,000,000,000)
1 (24,952,923,000)
2 (22,854,979,800)
3 (20,682,263,286)
4 (18,434,422,481)
5 (16,111,065,055)
6 (13,711,757,524)
7 (11,236,025,432)
8 (8,683,353,496)
9 (6,053,185,730)
10 (3,344,925,546)
11 (557,935,824)
12 2,308,461,041
13 5,254,983,116
14 8,282,388,931
15 11,391,477,505
16 14,583,088,399
17 17,858,101,786
18 21,217,438,552
19 24,662,060,415
20 28,192,970,071
Cost of capital 8.00%
NPV of the project (1,800,863,909)
CORPORATE FINANCE
8
From the valuation of 5.94% and 8% WACC, Adequate cost of capital for the
organization is identified. The NPV provided from 5.94% WACC was relatively at the levels
of 3,109,533,659, which is high and provides the company with adequate returns. However,
the WACC of 8% mainly indicates a negative value of -1,800,863,909, while stating the loss
portrayed from the project. Hence, with 5.94% WACC the gas project is viable, while with
8% WACC the project is not viable for Royal Dutch Shell. With the use of net present value
organizations can detect actual viability of the project and understand the returns that could
be provided from their investment (Lokman et al. 2017). However, certain projects due to no
cash inflow are not able to support time value of money, which could directly affect
company's ability to increase firm value. Currently, the WACC of 5.94% is providing a
positive net present value for Royal Dutch Shell, which is a positive indication for the
company. On the other hand, the WACC of 8% is portraying a negative valuation for the
project, which indicates that cash flow of the project is not supporting time value of money.
⊘ This is a preview!⊘
Do you want full access?
Subscribe today to unlock all pages.
Trusted by 1+ million students worldwide
CORPORATE FINANCE
9
Reference and Bibliography:
Atil, A., Lahiani, A. and Nguyen, D.K., 2014. Asymmetric and nonlinear pass-through of
crude oil prices to gasoline and natural gas prices. Energy Policy, 65, pp.567-573.
Ballotta, L. and Kyriakou, I., 2015. Convertible bond valuation in a jump diffusion setting
with stochastic interest rates. Quantitative Finance, 15(1), pp.115-129.
D'Amico, G., 2016. Generalized semi-Markovian dividend discount model: risk and
return. arXiv preprint arXiv:1605.02472.
Eliasson, J. and Börjesson, M., 2014. On timetable assumptions in railway investment
appraisal. Transport Policy, 36, pp.118-126.
Florou, A. and Kosi, U., 2015. Does mandatory IFRS adoption facilitate debt
financing?. Review of Accounting Studies, 20(4), pp.1407-1456.
Huang, R., Ritter, J.R. and Zhang, D., 2016. Private equity firms’ reputational concerns and
the costs of debt financing. Journal of Financial and Quantitative Analysis, 51(1), pp.29-54.
Lazzati, N. and Menichini, A.A., 2015. A dynamic approach to the dividend discount
model. Review of Pacific Basin Financial Markets and Policies, 18(03), p.1550018.
Lokman, S., Volker, D., Zijlstra-Vlasveld, M.C., Brouwers, E.P., Boon, B., Beekman, A.T.,
Smit, F. and Van der Feltz-Cornelis, C.M., 2017. Return-to-work intervention versus usual
care for sick-listed employees: health-economic investment appraisal alongside a cluster
randomised trial. BMJ open, 7(10), p.e016348.
Nobanee, H., 2014. Working capital management and firm's profitability: an optimal cash
conversion cycle. International Research Journal of Finance and Economics. March (120),
pp.13-22.
Paraphrase This Document
Need a fresh take? Get an instant paraphrase of this document with our AI Paraphraser

CORPORATE FINANCE
10
Woodside.com.au. (2018). Woodside Energy | Home. [online] Available at:
http://www.woodside.com.au/Pages/home.aspx [Accessed 20 Jan. 2018].
Yazdanfar, D. and Öhman, P., 2014. The impact of cash conversion cycle on firm
profitability: an empirical study based on Swedish data. International Journal of Managerial
Finance, 10(4), pp.442-452.
1 out of 11
Related Documents


Your All-in-One AI-Powered Toolkit for Academic Success.
+13062052269
info@desklib.com
Available 24*7 on WhatsApp / Email
![[object Object]](/_next/static/media/star-bottom.7253800d.svg)
Unlock your academic potential
Copyright © 2020–2026 A2Z Services. All Rights Reserved. Developed and managed by ZUCOL.