Corporate Finance: Risk and Return Analysis Report - University of XYZ
VerifiedAdded on  2022/11/15
|7
|807
|375
Report
AI Summary
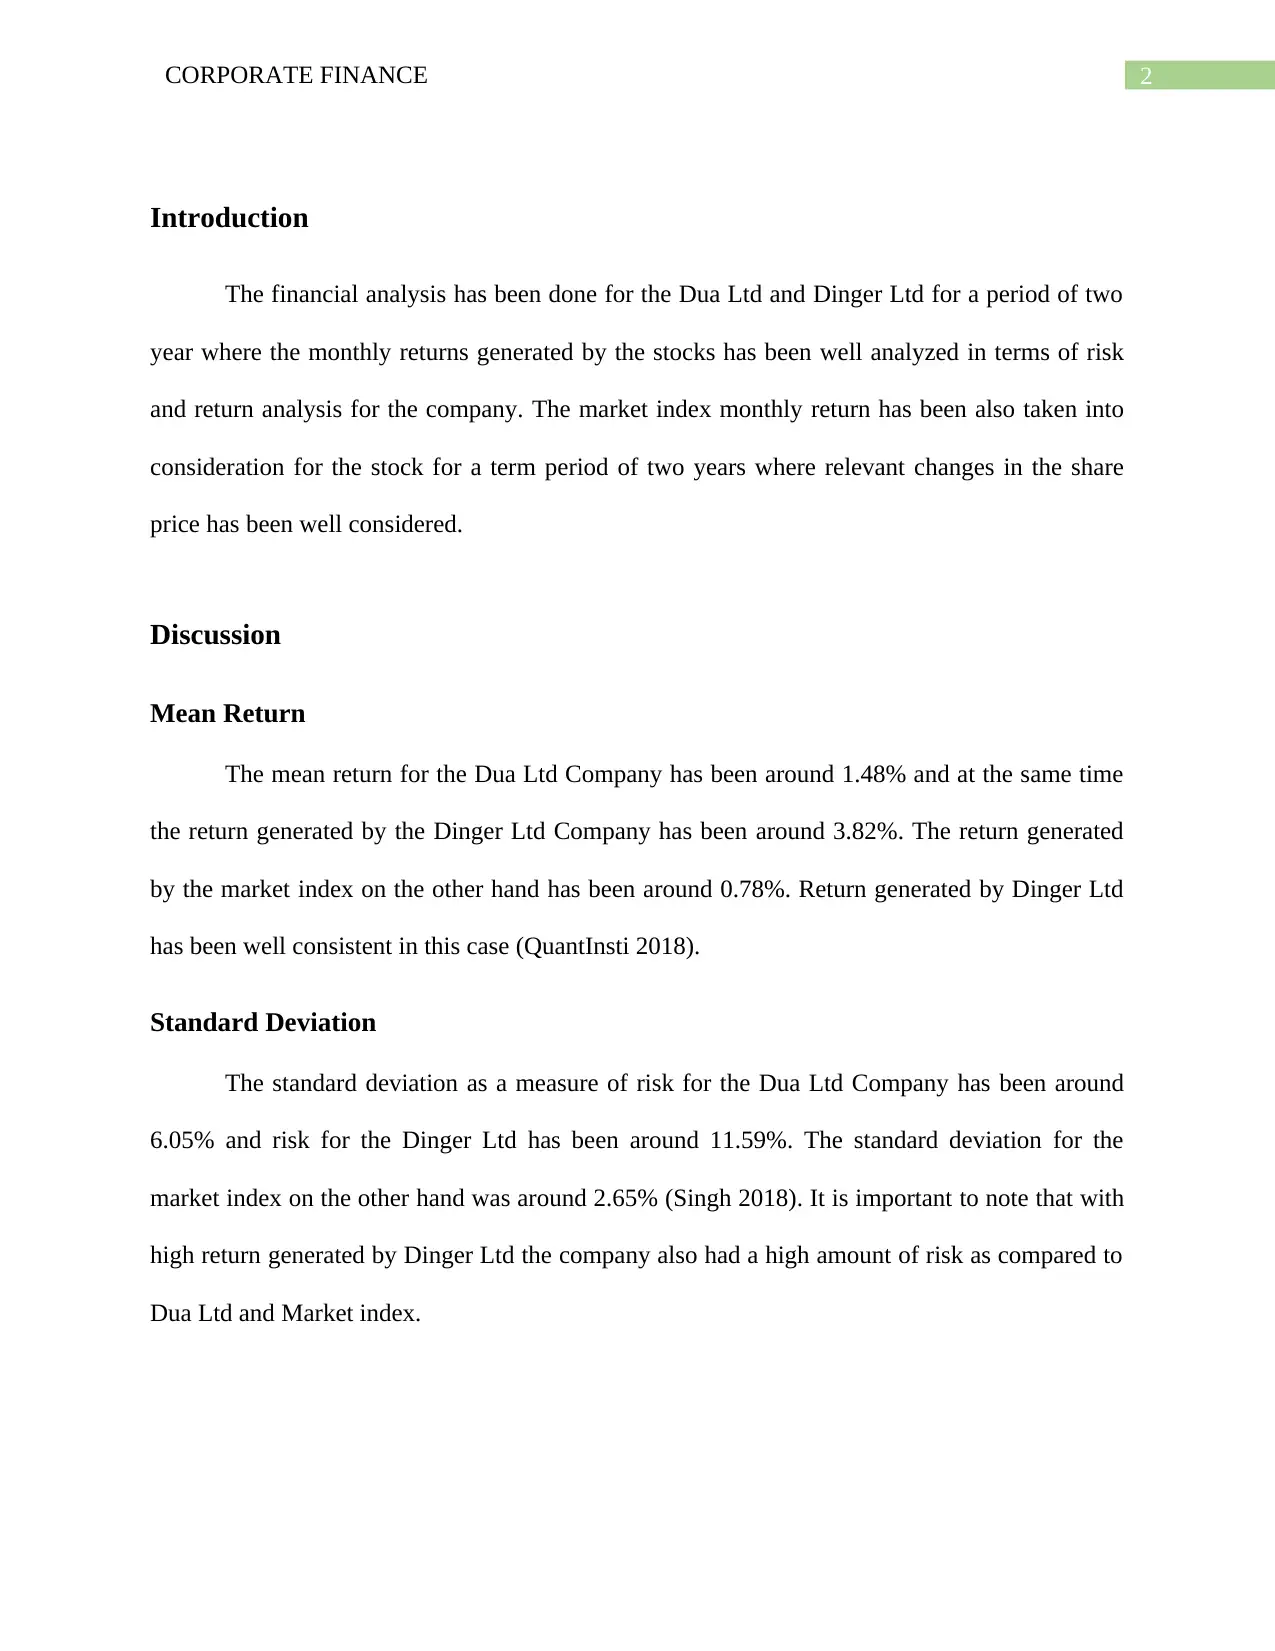
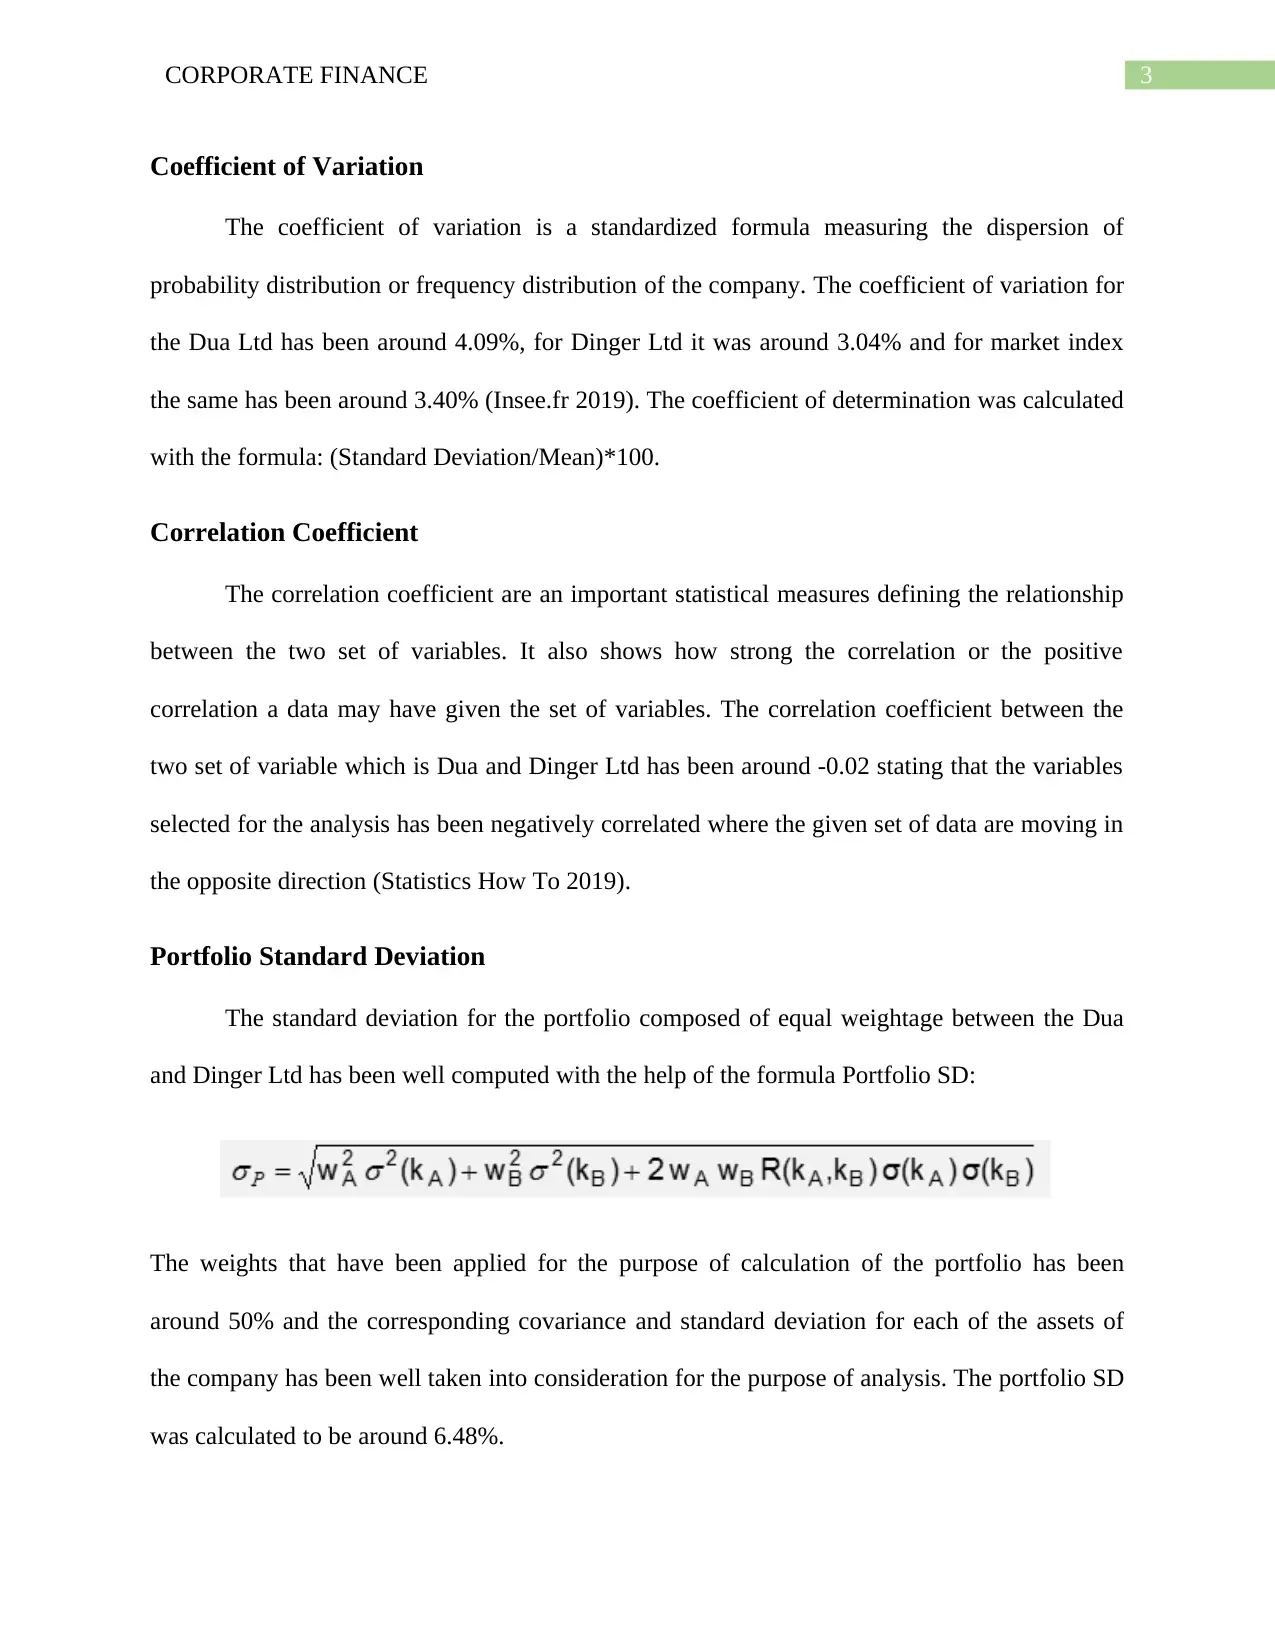
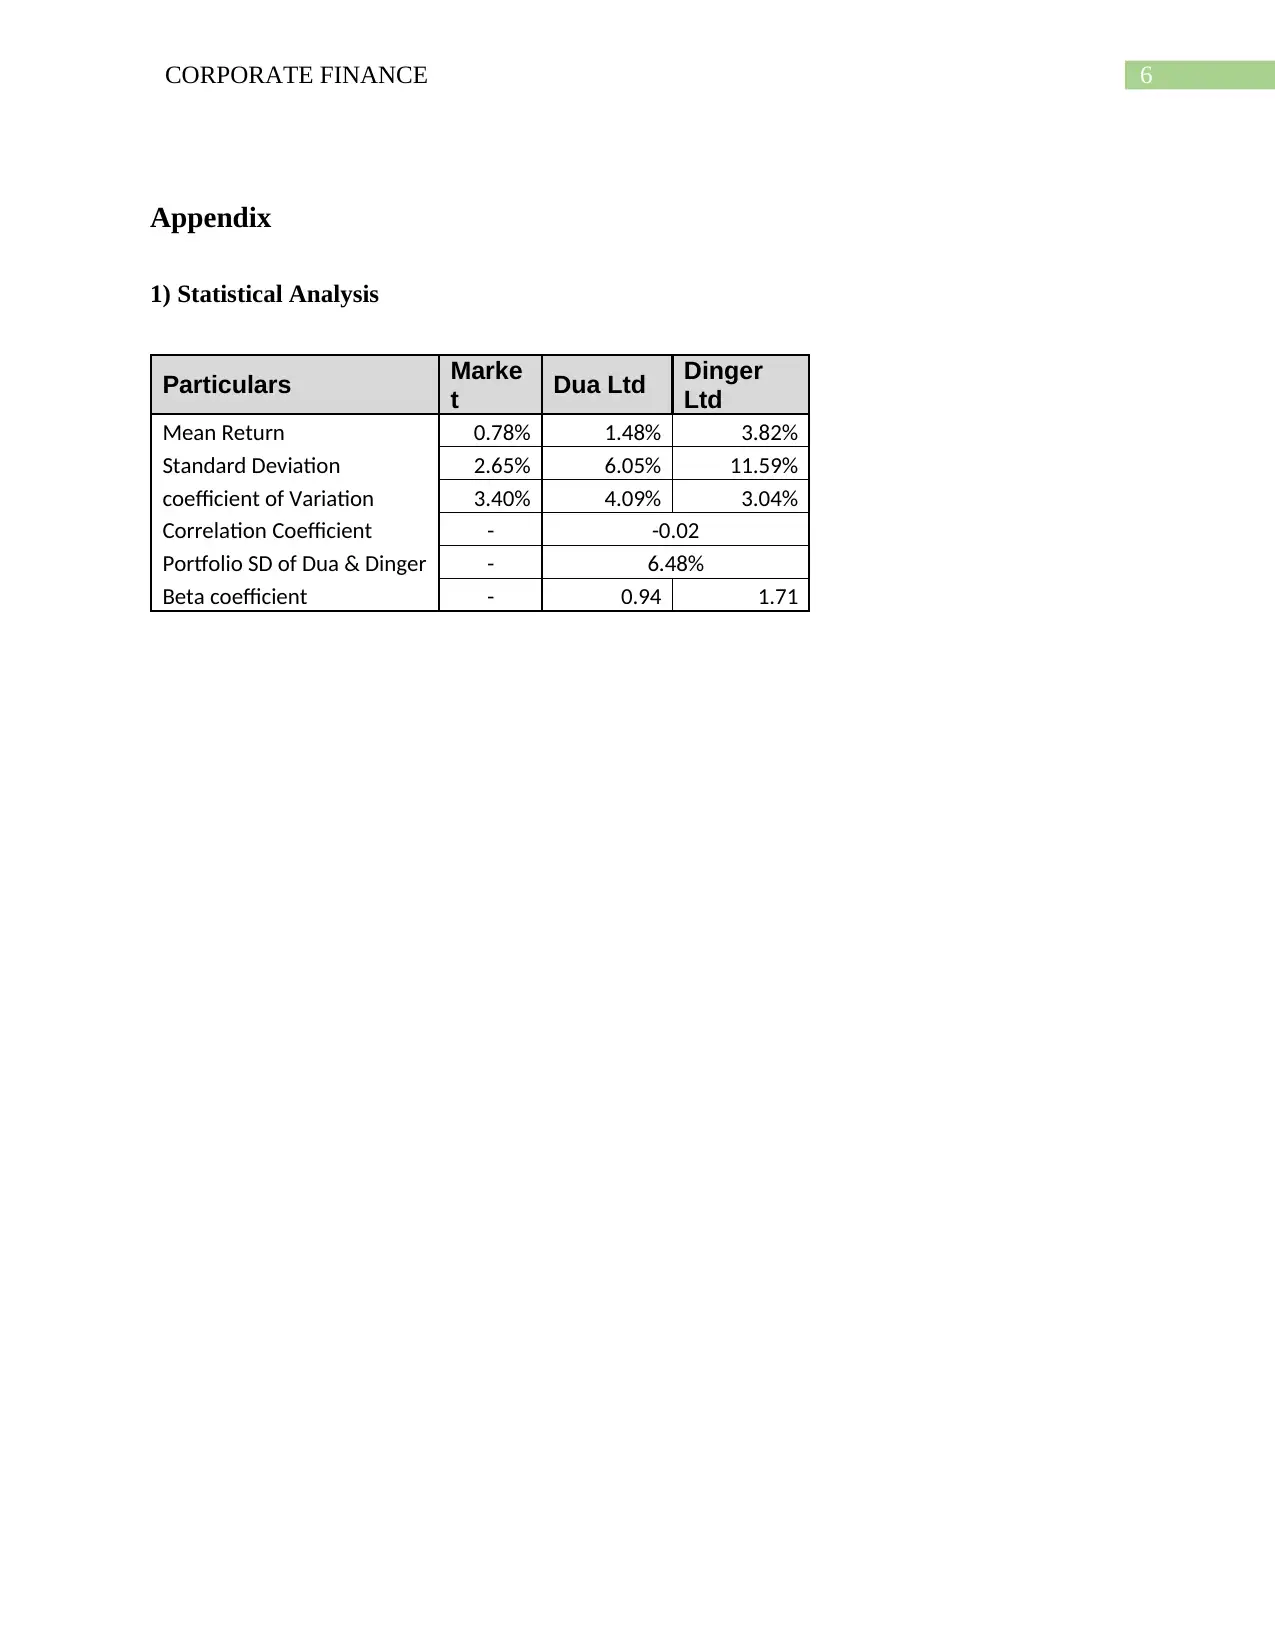
This report provides a comprehensive financial analysis of Dua Ltd and Dinger Ltd, focusing on risk and return metrics over a two-year period. The analysis includes the calculation of mean returns, standard deviations, and coefficients of variation for both companies and a market index. The report further explores the correlation coefficient between the two companies, portfolio standard deviation for an equal-weighted portfolio, and beta coefficients relative to the market index. The findings indicate that while Dinger Ltd generated higher returns, it also carried a higher level of risk. The report utilizes statistical functions in Excel to perform calculations and provides a detailed interpretation of the results, including a conclusion summarizing the risk-return profiles of the companies and relevant references.

Running head: CORPORATE FINANCE
Corporate Finance
Name of the Student:
Name of the University:
Author’s Note:
Corporate Finance
Name of the Student:
Name of the University:
Author’s Note:
Paraphrase This Document
Need a fresh take? Get an instant paraphrase of this document with our AI Paraphraser

1CORPORATE FINANCE
Table of Contents
Introduction......................................................................................................................................2
Discussion........................................................................................................................................2
Mean Return................................................................................................................................2
Standard Deviation......................................................................................................................2
Coefficient of Variation...............................................................................................................2
Correlation Coefficient................................................................................................................3
Portfolio Standard Deviation.......................................................................................................3
Beta coefficient............................................................................................................................3
Conclusion.......................................................................................................................................4
References........................................................................................................................................5
Appendix..........................................................................................................................................6

2CORPORATE FINANCE
Introduction
The financial analysis has been done for the Dua Ltd and Dinger Ltd for a period of two
year where the monthly returns generated by the stocks has been well analyzed in terms of risk
and return analysis for the company. The market index monthly return has been also taken into
consideration for the stock for a term period of two years where relevant changes in the share
price has been well considered.
Discussion
Mean Return
The mean return for the Dua Ltd Company has been around 1.48% and at the same time
the return generated by the Dinger Ltd Company has been around 3.82%. The return generated
by the market index on the other hand has been around 0.78%. Return generated by Dinger Ltd
has been well consistent in this case (QuantInsti 2018).
Standard Deviation
The standard deviation as a measure of risk for the Dua Ltd Company has been around
6.05% and risk for the Dinger Ltd has been around 11.59%. The standard deviation for the
market index on the other hand was around 2.65% (Singh 2018). It is important to note that with
high return generated by Dinger Ltd the company also had a high amount of risk as compared to
Dua Ltd and Market index.
⊘ This is a preview!⊘
Do you want full access?
Subscribe today to unlock all pages.

Trusted by 1+ million students worldwide

3CORPORATE FINANCE
Coefficient of Variation
The coefficient of variation is a standardized formula measuring the dispersion of
probability distribution or frequency distribution of the company. The coefficient of variation for
the Dua Ltd has been around 4.09%, for Dinger Ltd it was around 3.04% and for market index
the same has been around 3.40% (Insee.fr 2019). The coefficient of determination was calculated
with the formula: (Standard Deviation/Mean)*100.
Correlation Coefficient
The correlation coefficient are an important statistical measures defining the relationship
between the two set of variables. It also shows how strong the correlation or the positive
correlation a data may have given the set of variables. The correlation coefficient between the
two set of variable which is Dua and Dinger Ltd has been around -0.02 stating that the variables
selected for the analysis has been negatively correlated where the given set of data are moving in
the opposite direction (Statistics How To 2019).
Portfolio Standard Deviation
The standard deviation for the portfolio composed of equal weightage between the Dua
and Dinger Ltd has been well computed with the help of the formula Portfolio SD:
The weights that have been applied for the purpose of calculation of the portfolio has been
around 50% and the corresponding covariance and standard deviation for each of the assets of
the company has been well taken into consideration for the purpose of analysis. The portfolio SD
was calculated to be around 6.48%.
Paraphrase This Document
Need a fresh take? Get an instant paraphrase of this document with our AI Paraphraser

4CORPORATE FINANCE
Beta coefficient
The beta coefficient measuring the sensitivity of stock with respect to market index for
the Dua Ltd has been around 0.94 times and for Dinger Ltd it was around 1.71 times.
Conclusion
The analysis of the Dua and Dinger Ltd has been well done based on the risk and return
factor where it was found that Dinger Ltd on a risk return basis has performed well.

5CORPORATE FINANCE
References
Insee.fr. 2019. Définition - Coefficient of variation / CV / CV | Insee. [online] Available at:
https://www.insee.fr/en/metadonnees/definition/c1366 [Accessed 15 Sep. 2019].
QuantInsti. (2018). Portfolio Analysis: Calculating Risk and Returns. [online] Available at:
https://blog.quantinsti.com/portfolio-analysis-calculating-risk-returns/ [Accessed 15 Sep. 2019].
Singh, J. 2018. Portfolio Standard Deviation (Formula, Examples) | How to Calculate?. [online]
Wallstreetmojo.com. Available at: https://www.wallstreetmojo.com/portfolio-standard-deviation/
[Accessed 15 Sep. 2019].
Statistics How To. 2019. Correlation Coefficient: Simple Definition, Formula, Easy Calculation
Steps. [online] Available at: https://www.statisticshowto.datasciencecentral.com/probability-and-
statistics/correlation-coefficient-formula/ [Accessed 15 Sep. 2019].
⊘ This is a preview!⊘
Do you want full access?
Subscribe today to unlock all pages.

Trusted by 1+ million students worldwide

6CORPORATE FINANCE
Appendix
1) Statistical Analysis
Particulars Marke
t Dua Ltd Dinger
Ltd
Mean Return 0.78% 1.48% 3.82%
Standard Deviation 2.65% 6.05% 11.59%
coefficient of Variation 3.40% 4.09% 3.04%
Correlation Coefficient - -0.02
Portfolio SD of Dua & Dinger - 6.48%
Beta coefficient - 0.94 1.71
Appendix
1) Statistical Analysis
Particulars Marke
t Dua Ltd Dinger
Ltd
Mean Return 0.78% 1.48% 3.82%
Standard Deviation 2.65% 6.05% 11.59%
coefficient of Variation 3.40% 4.09% 3.04%
Correlation Coefficient - -0.02
Portfolio SD of Dua & Dinger - 6.48%
Beta coefficient - 0.94 1.71
1 out of 7
Related Documents

Your All-in-One AI-Powered Toolkit for Academic Success.
 +13062052269
info@desklib.com
Available 24*7 on WhatsApp / Email
Unlock your academic potential
Copyright © 2020–2025 A2Z Services. All Rights Reserved. Developed and managed by ZUCOL.