FIN203 Assessment: Corporate Finance Report on Fortescue Metals Group
VerifiedAdded on 2022/08/23
|12
|2200
|18
Report
AI Summary
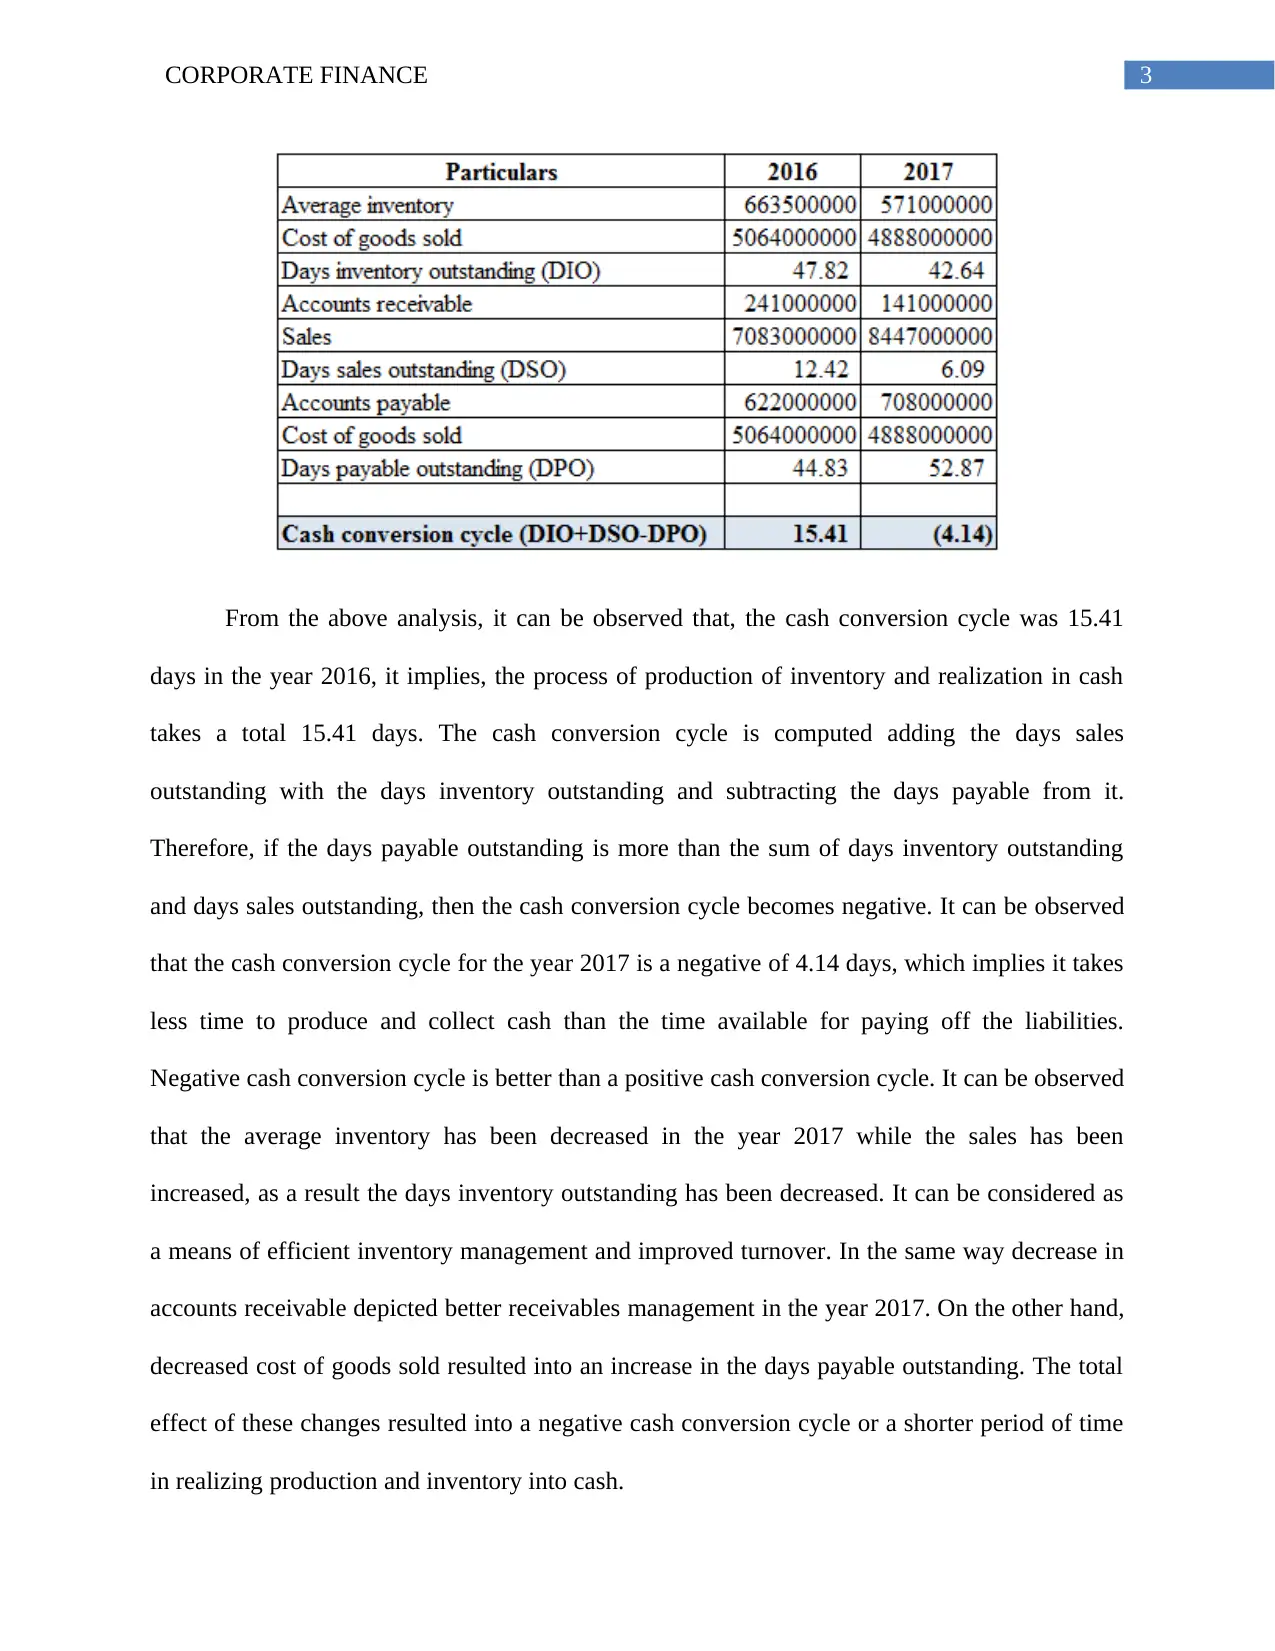
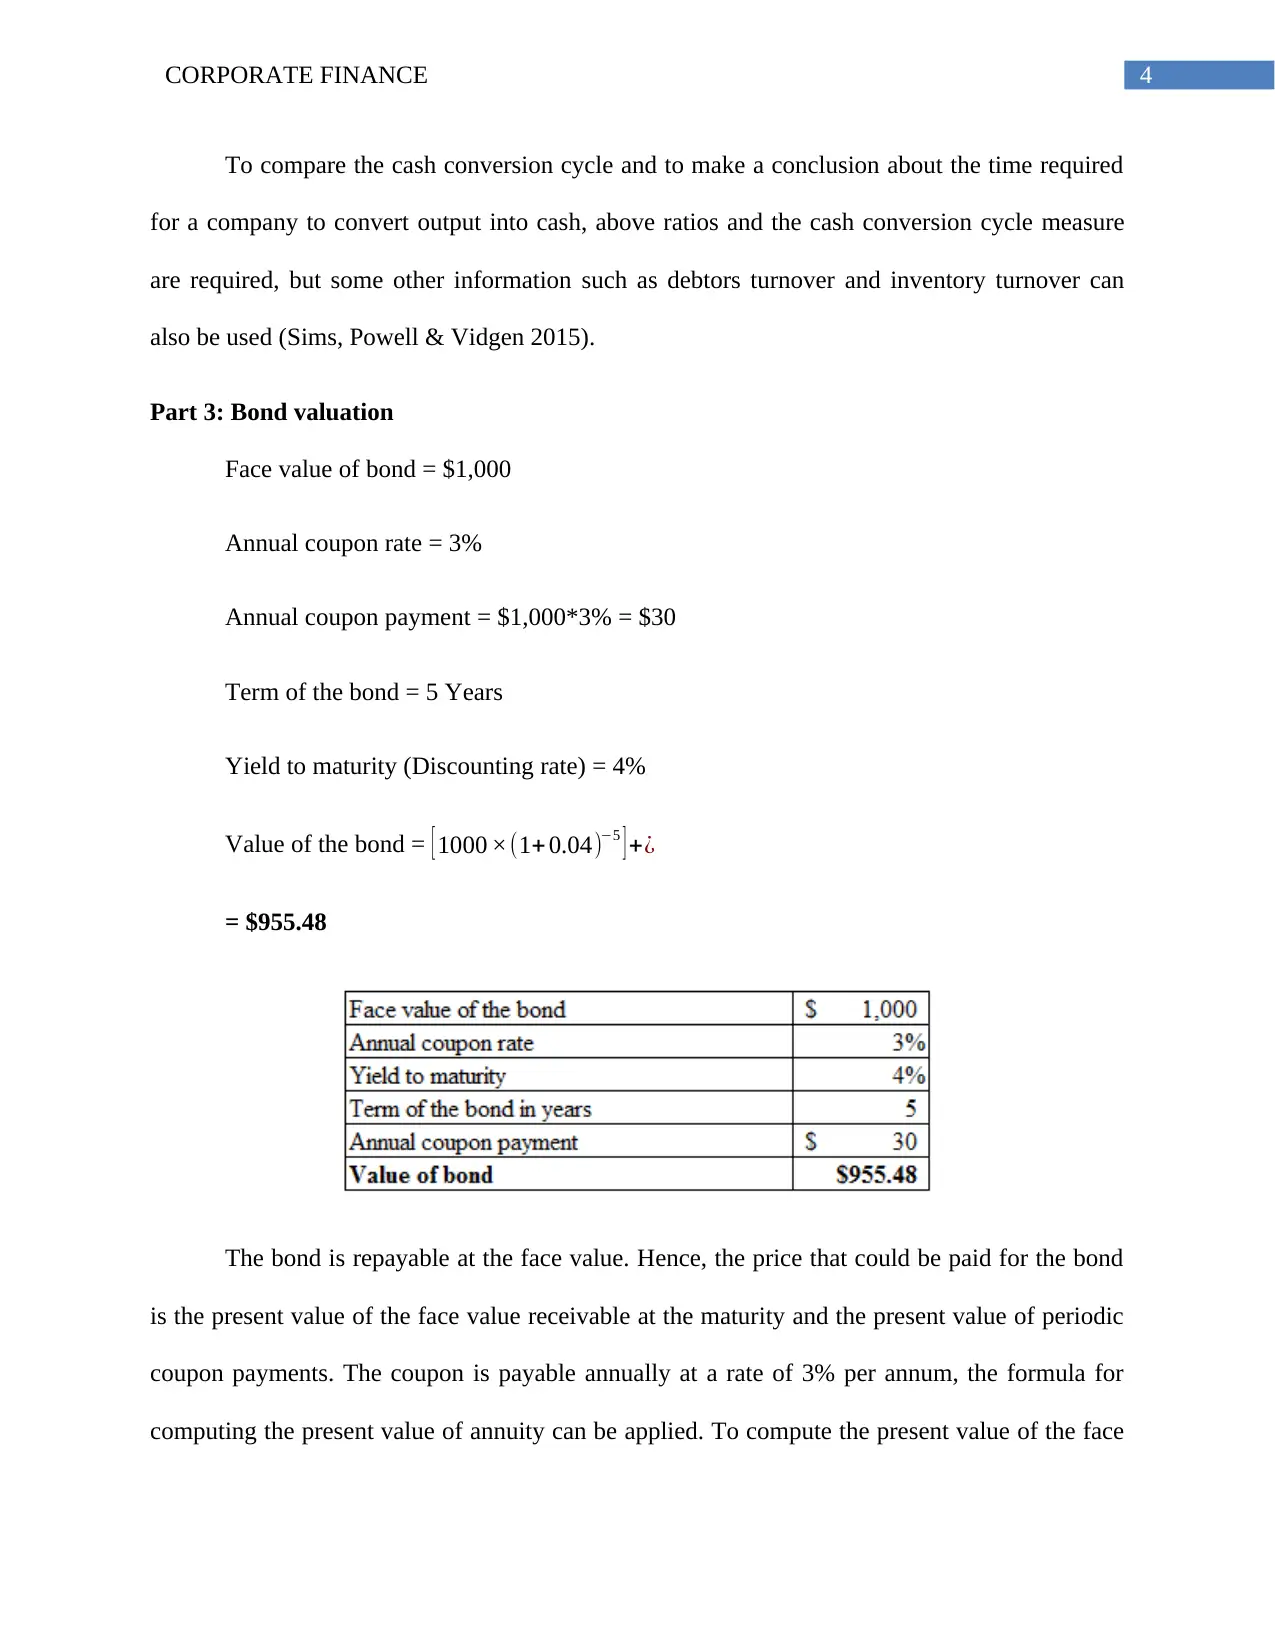
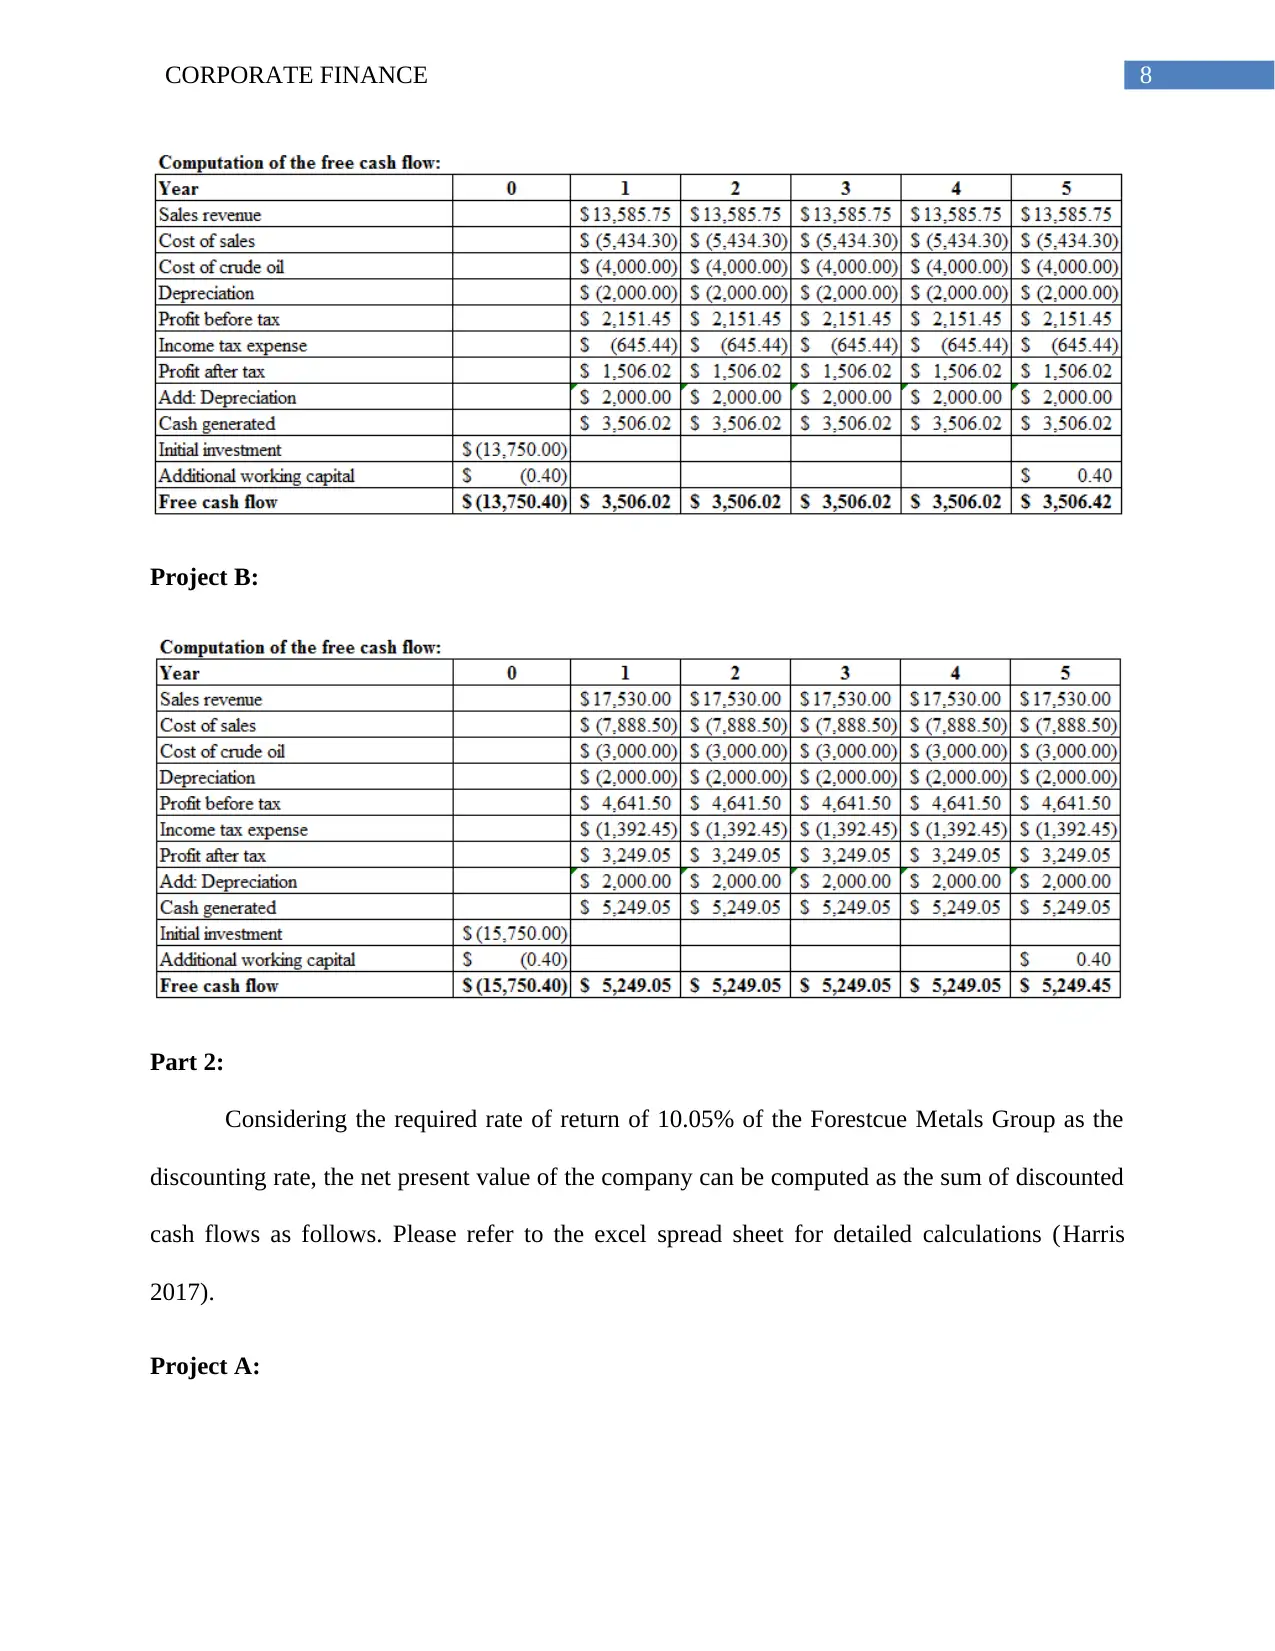
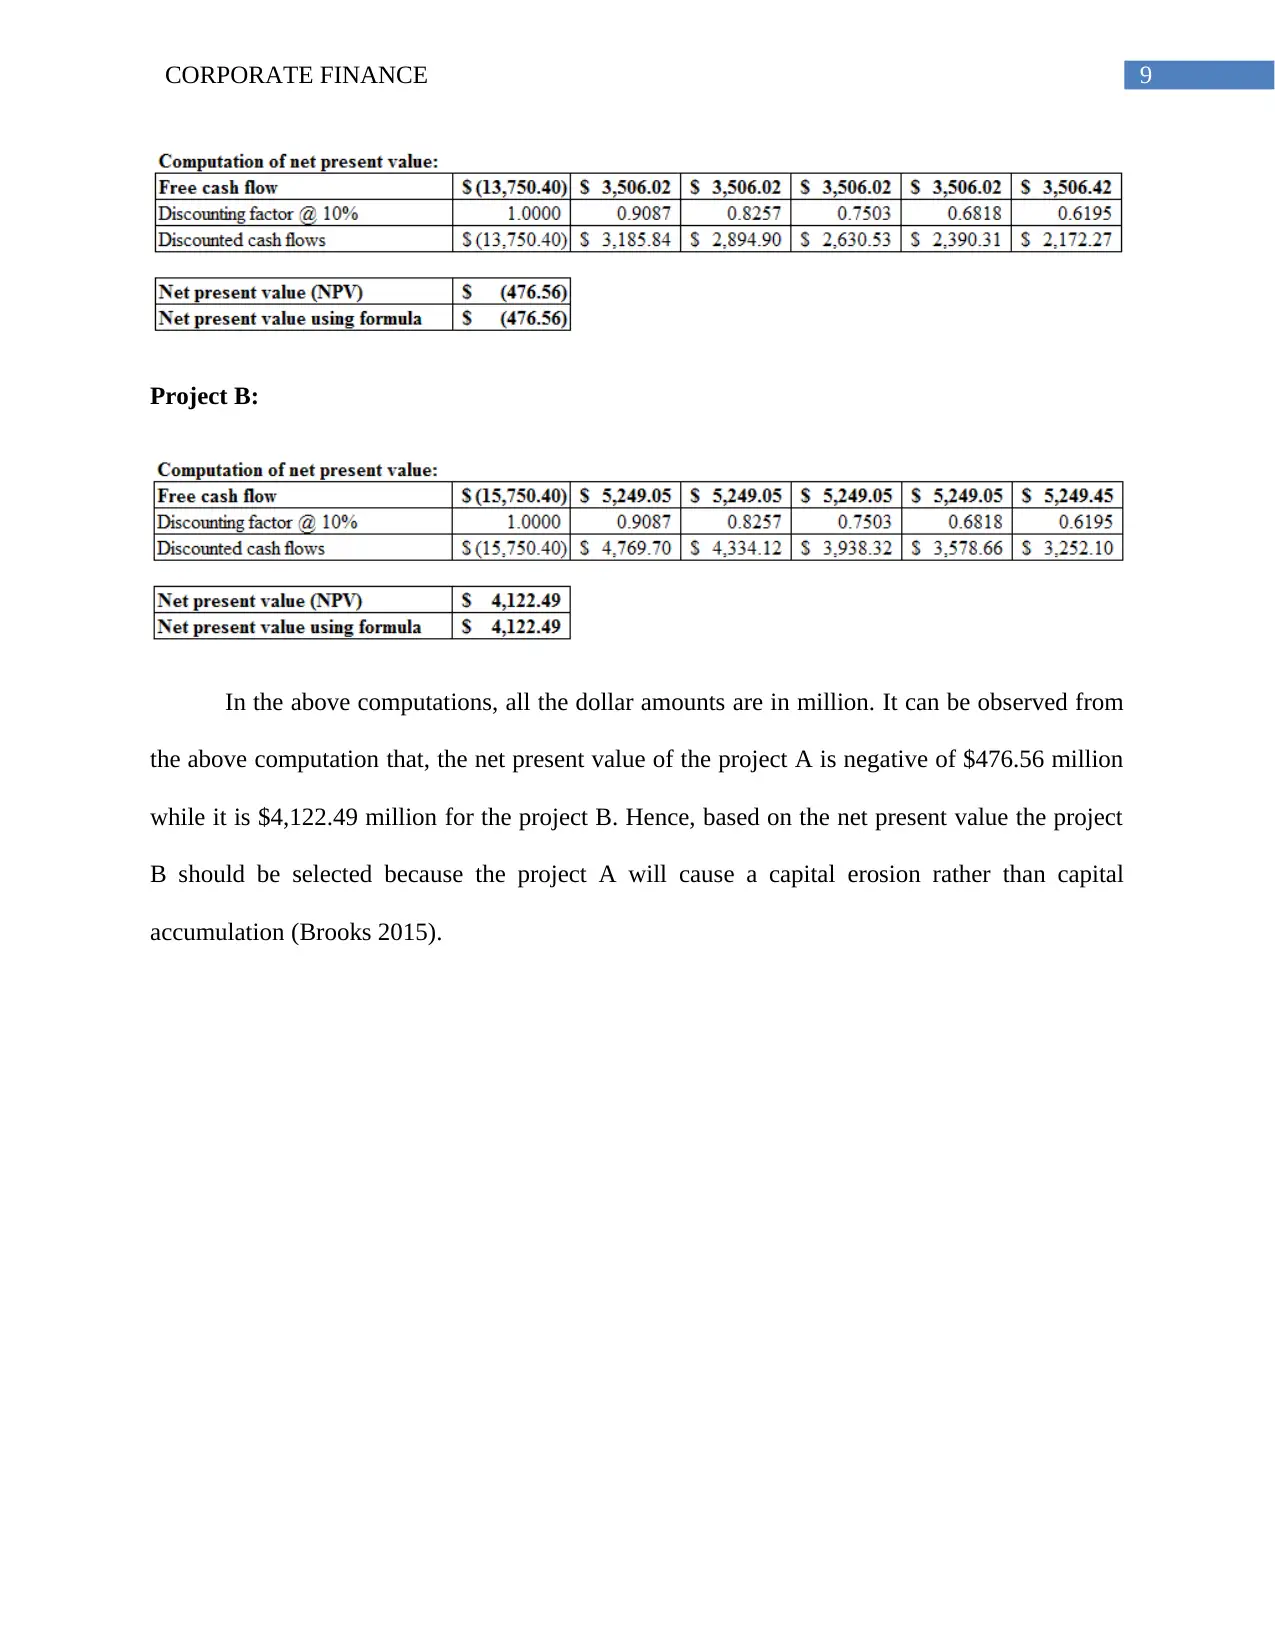
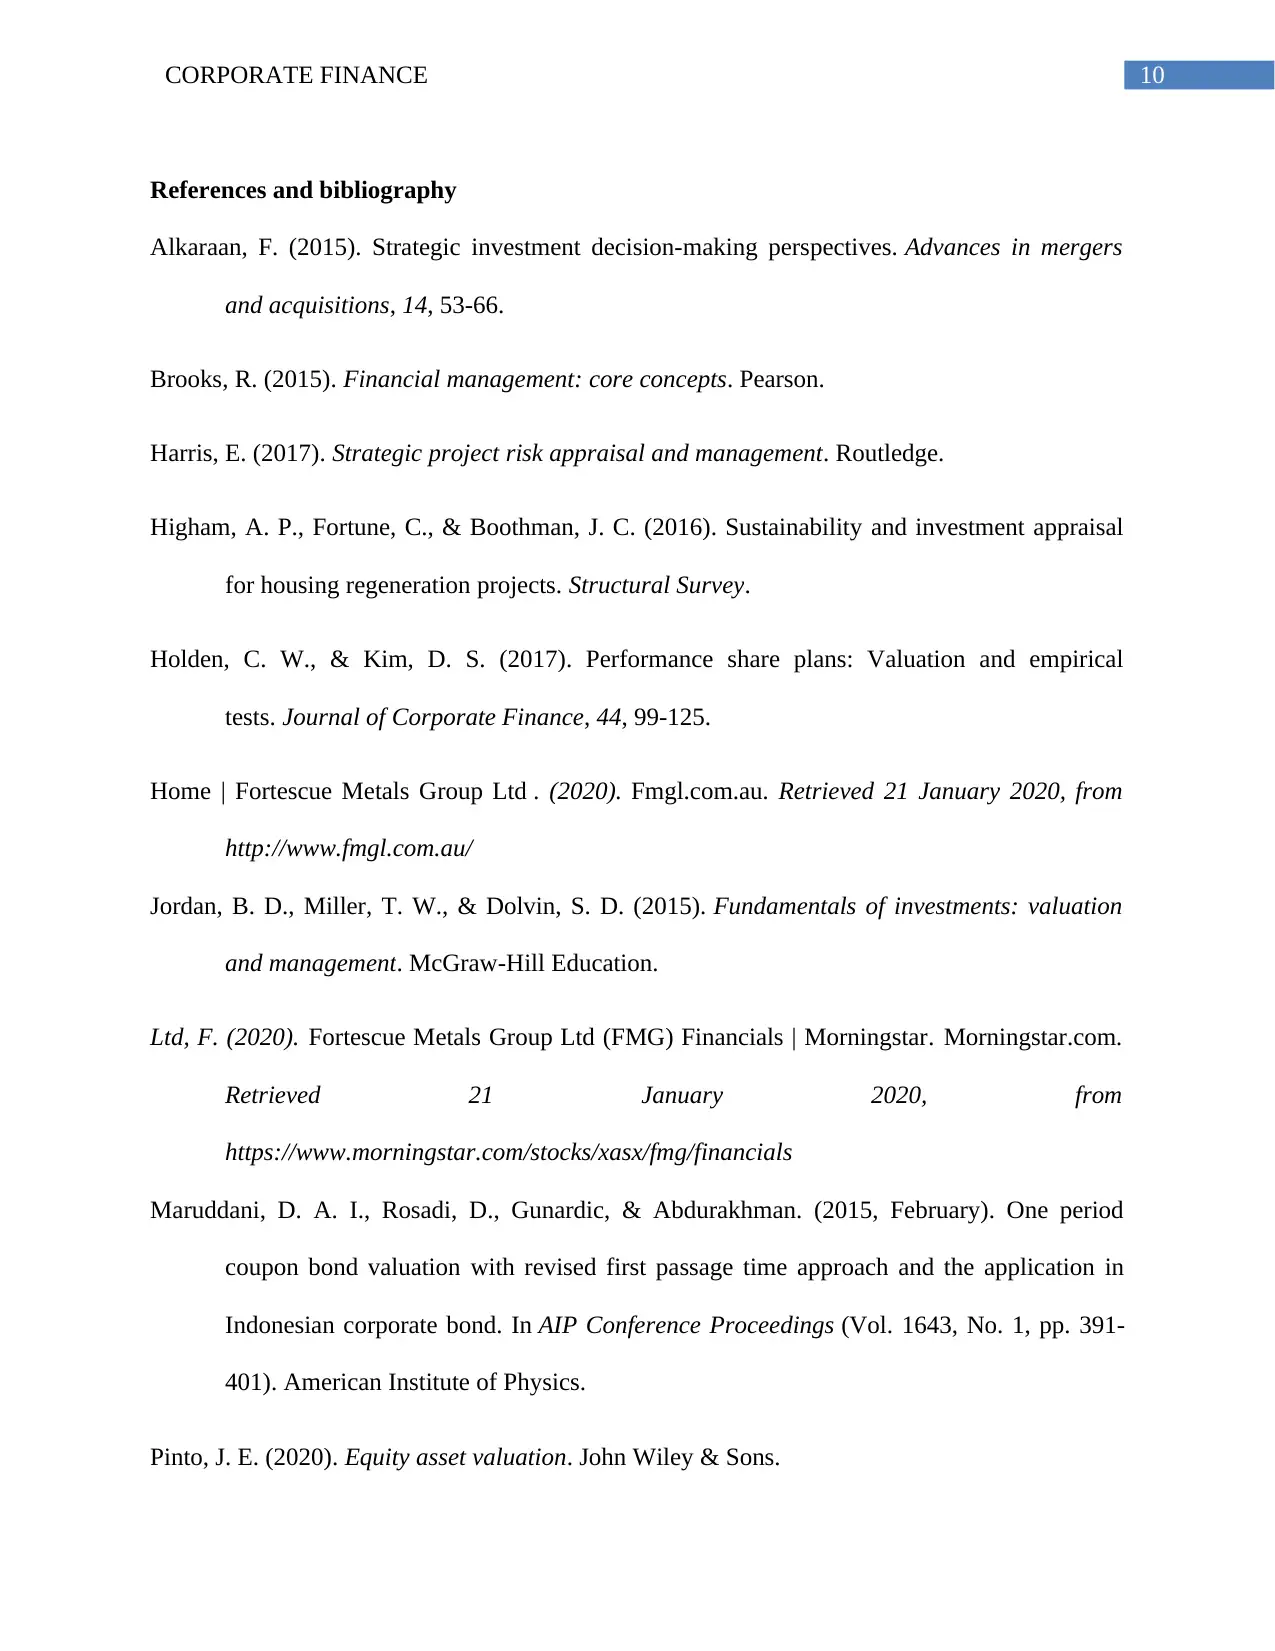
This report provides a detailed corporate finance analysis of Fortescue Metals Group (FMG). It begins with a background of the company, its operations, and its position in the iron ore industry. The report then delves into key financial metrics, including an analysis of FMG's cash conversion cycle, evaluating its efficiency in managing working capital. The report also includes a bond valuation, determining the fair price of FMG's bonds based on coupon rates, face value, and yield to maturity, as well as an analysis of bond ratings and their implications. Furthermore, the report assesses share valuation, calculating the intrinsic value of FMG's shares using the CAPM model and dividend discount model, and comparing this value to the market price to determine if the shares are undervalued or overvalued. Finally, the report addresses capital budgeting, evaluating two potential projects (A and B) using the Net Present Value (NPV) method to determine which project would be more financially beneficial, and providing the financial calculations and rationale for the optimal investment decision. The report concludes with a list of references used.

Running head: CORPORATE FINANCE
Corporate Finance
Name of the Student:
Name of the University:
Author’s Note:
Corporate Finance
Name of the Student:
Name of the University:
Author’s Note:
Paraphrase This Document
Need a fresh take? Get an instant paraphrase of this document with our AI Paraphraser

1CORPORATE FINANCE
Table of Contents
Question 1: Company Prospective...................................................................................................2
Part 1: Background of Fortescue Metals.....................................................................................2
Part 2: Cash conversion cycle......................................................................................................2
Part 3: Bond valuation.................................................................................................................4
Part 4:...........................................................................................................................................5
Part 5: Share valuation.................................................................................................................5
Question 2: Capital budgeting.........................................................................................................7
Part 1:...........................................................................................................................................7
Part 2:...........................................................................................................................................8
References and bibliography.........................................................................................................10

2CORPORATE FINANCE
Question 1: Company Prospective
Part 1: Background of Fortescue Metals
Forestcue Metals is an Australian company operating globally. The Fortescue Metals
group is a global leader in the in the metal and iron ore industry. The company was founded in
the year 2003 and since then the company discovered various iron ore and metal deposits and
developed some most important iron ore mines. With their massive investment and research and
development activities they have developed efficient mining equipment and plants which helped
them to extract iron ores from mines at a very low costs. The Forestcue Metals is known for the
efficient and safest mining activities and production of iron ores at a lowest cost. At present the
company is having a capacity of extracting 170million tonnes of iron per annum. The company
supplies its output in some most important projects and countries. The company is currently
supplying almost 17% of the demand for iron ore of china and gradually expanding it to Japan,
India and South Korea (Fortescue Metals Group Ltd 2020).
In the year 2017 the company produced and shipped almost 170 million tonnes of iron
ores at a C1 cost of $12.82/WMT and it earned a total revenue of $8.4 billion. Being cost
efficient, the company is having a significant profitability and a sustainable growth in their
profitability can also be observed for the past few years.
Part 2: Cash conversion cycle
Cash conversion cycle is the time period required to produce and sell inventory and to
realize it in cash. The cash conversion cycle is computed by comparing the days inventory
outstanding, days sales outstanding and days payable outstanding. In the following table the
computation of the cash conversion cycle of the Forestcue Metals Group has been illustrated.
⊘ This is a preview!⊘
Do you want full access?
Subscribe today to unlock all pages.

Trusted by 1+ million students worldwide

3CORPORATE FINANCE
From the above analysis, it can be observed that, the cash conversion cycle was 15.41
days in the year 2016, it implies, the process of production of inventory and realization in cash
takes a total 15.41 days. The cash conversion cycle is computed adding the days sales
outstanding with the days inventory outstanding and subtracting the days payable from it.
Therefore, if the days payable outstanding is more than the sum of days inventory outstanding
and days sales outstanding, then the cash conversion cycle becomes negative. It can be observed
that the cash conversion cycle for the year 2017 is a negative of 4.14 days, which implies it takes
less time to produce and collect cash than the time available for paying off the liabilities.
Negative cash conversion cycle is better than a positive cash conversion cycle. It can be observed
that the average inventory has been decreased in the year 2017 while the sales has been
increased, as a result the days inventory outstanding has been decreased. It can be considered as
a means of efficient inventory management and improved turnover. In the same way decrease in
accounts receivable depicted better receivables management in the year 2017. On the other hand,
decreased cost of goods sold resulted into an increase in the days payable outstanding. The total
effect of these changes resulted into a negative cash conversion cycle or a shorter period of time
in realizing production and inventory into cash.
Paraphrase This Document
Need a fresh take? Get an instant paraphrase of this document with our AI Paraphraser

4CORPORATE FINANCE
To compare the cash conversion cycle and to make a conclusion about the time required
for a company to convert output into cash, above ratios and the cash conversion cycle measure
are required, but some other information such as debtors turnover and inventory turnover can
also be used (Sims, Powell & Vidgen 2015).
Part 3: Bond valuation
Face value of bond = $1,000
Annual coupon rate = 3%
Annual coupon payment = $1,000*3% = $30
Term of the bond = 5 Years
Yield to maturity (Discounting rate) = 4%
Value of the bond = [ 1000 ×(1+ 0.04)−5 ] +¿
= $955.48
The bond is repayable at the face value. Hence, the price that could be paid for the bond
is the present value of the face value receivable at the maturity and the present value of periodic
coupon payments. The coupon is payable annually at a rate of 3% per annum, the formula for
computing the present value of annuity can be applied. To compute the present value of the face

5CORPORATE FINANCE
value, the face value is discounted by the five years discounting factor at 4%. Then, the present
value of the bond or the price of the bond can be computed by adding these two to $955.48.
Part 4:
Bond rating is the process of assigning a grade to the bond describing its credit quality.
Standard & poor’s BBB bond rating indicates that investment in such bond is mostly secure and
it is considered as an investment grade. Hence, if any bond is graded as BBB by Standard &
Poor’s, then investment can be made on those bonds. A rating of BB by the Standard & Poor’s
for a bond indicates, that the bold is mostly risky for investment and there is a suspect that the
company will not be able to repay the face value of the bond at the maturity. Hence, investment
should not be made on those bonds.
In the part 3, the price for the bond of Fortescue Metals Group has been computed to
$955.48 for a bond having its face value of $1,000 and a coupon rate of 3% with a 5 years
maturity. Now, if the bond is graded as BBB by the Standard & Poor’s rating system, then the
bond is more secure and investments can be made on those bonds. If the rating of the bond is
downgraded from BBB to BB, then it indicates that the bonds of the Forestcue Metals Group is
mostly risky and insecure to invest in. For such a down gradation in bond rating for the bonds of
Forestcue Metals Group, the price of the bond will remain unchanged. Hence, if the bonds of the
Fortescue Metal Group is downgraded from BBB to BB, then it implies higher degree of risk in
making investment in the bonds of the Forestcue metal Group and no investment should be made
on these bonds (Jordan, Miller & Dolvin 2015).
Part 5: Share valuation
Shares of the Forestcue Metals Group is listed in the Australian Stock Exchange. The
shares of the Forestcue Metals Group is currently quoted at $12.08 currently. To make an
⊘ This is a preview!⊘
Do you want full access?
Subscribe today to unlock all pages.

Trusted by 1+ million students worldwide

6CORPORATE FINANCE
investment decision, whether to invest or not to invest in the shares of the company, the
valuation of shares is important. Using the required rate of return, current dividend and the
expected growth rate in dividend, the intrinsic value of the shares of the Forestcue Metals Group
can be computed as follows.
Return to the market portfolio = 9%
Risk free rate = 0.25%
Risk coefficient of the shares of Forestcue Metals Group = 1.12
Using the capital assets pricing model (CAPM), the required rate of return of the
Forestcue Metals Group can be computed as follows.
= 0.25% + (9%-0.25%)*1.12
Required rate of return (Ke) = 10.05%
Dividend for the year 2017 = $0.45
Expected dividend in the year 2018 (D1) = $0.45
Expected growth rate in dividend (g) = 4.94%
By applying the dividend discounting model considering a single growth rate the intrinsic
value of the share of Forestcue Metals Group can be computed as follows.
Intrinsic value of share (P0) = D1
Ke−g = $ 0.45
10.05 %−4.94 %
= $8.83
Paraphrase This Document
Need a fresh take? Get an instant paraphrase of this document with our AI Paraphraser

7CORPORATE FINANCE
It can be observed that the share of the Forestcue Metals Group is quoted at $12.08 in the
Australian Stock Exchange, while the computed intrinsic value of the shares is $8.83. It implies
the intrinsic value of shares of the Forestcue Metals Group is lesser than the current market price.
The differences between the intrinsic value and the market price of share is due to the market
inefficiency, as and when the market reaches its efficiency the market value of the share will
become equal to its intrinsic value. Hence, the market price of the share will tend towards the
intrinsic value and the market price will be falling in near future. Therefore, the share of the
Forestcue is not a profitable investment opportunity as of now. Hence, the shares should not be
purchased at a price of $12.08 (Pinto 2020).
Question 2: Capital budgeting
Capital budgeting is the process of analyzing and evaluating the investment proposals and
to make a strategic and optimal investment decision. For the given investment opportunities of
project A and B, the net present value technique can be applied as follows to make an optimal
investment decision between these two.
Part 1:
Free cash flows from project A and B has been computed from the revenue estimates and
expected expenses as follows. Please refer to the excel spreadsheet for a detailed calculation.
Project A:

8CORPORATE FINANCE
Project B:
Part 2:
Considering the required rate of return of 10.05% of the Forestcue Metals Group as the
discounting rate, the net present value of the company can be computed as the sum of discounted
cash flows as follows. Please refer to the excel spread sheet for detailed calculations (Harris
2017).
Project A:
⊘ This is a preview!⊘
Do you want full access?
Subscribe today to unlock all pages.

Trusted by 1+ million students worldwide

9CORPORATE FINANCE
Project B:
In the above computations, all the dollar amounts are in million. It can be observed from
the above computation that, the net present value of the project A is negative of $476.56 million
while it is $4,122.49 million for the project B. Hence, based on the net present value the project
B should be selected because the project A will cause a capital erosion rather than capital
accumulation (Brooks 2015).
Paraphrase This Document
Need a fresh take? Get an instant paraphrase of this document with our AI Paraphraser

10CORPORATE FINANCE
References and bibliography
Alkaraan, F. (2015). Strategic investment decision-making perspectives. Advances in mergers
and acquisitions, 14, 53-66.
Brooks, R. (2015). Financial management: core concepts. Pearson.
Harris, E. (2017). Strategic project risk appraisal and management. Routledge.
Higham, A. P., Fortune, C., & Boothman, J. C. (2016). Sustainability and investment appraisal
for housing regeneration projects. Structural Survey.
Holden, C. W., & Kim, D. S. (2017). Performance share plans: Valuation and empirical
tests. Journal of Corporate Finance, 44, 99-125.
Home | Fortescue Metals Group Ltd . (2020). Fmgl.com.au. Retrieved 21 January 2020, from
http://www.fmgl.com.au/
Jordan, B. D., Miller, T. W., & Dolvin, S. D. (2015). Fundamentals of investments: valuation
and management. McGraw-Hill Education.
Ltd, F. (2020). Fortescue Metals Group Ltd (FMG) Financials | Morningstar. Morningstar.com.
Retrieved 21 January 2020, from
https://www.morningstar.com/stocks/xasx/fmg/financials
Maruddani, D. A. I., Rosadi, D., Gunardic, & Abdurakhman. (2015, February). One period
coupon bond valuation with revised first passage time approach and the application in
Indonesian corporate bond. In AIP Conference Proceedings (Vol. 1643, No. 1, pp. 391-
401). American Institute of Physics.
Pinto, J. E. (2020). Equity asset valuation. John Wiley & Sons.

11CORPORATE FINANCE
Sims, J., Powell, P., & Vidgen, R. (2015). Investment appraisal and evaluation: preserving tacit
knowledge and competitive advantage. International Journal of Business and Systems
Research, 9(1), 86-103.
Yahoo is now a part of Verizon Media. (2020). In.finance.yahoo.com. Retrieved 21 January
2020, from https://in.finance.yahoo.com/quote/FMG.AX?p=FMG.AX&.tsrc=fin-srch
⊘ This is a preview!⊘
Do you want full access?
Subscribe today to unlock all pages.

Trusted by 1+ million students worldwide
1 out of 12
Related Documents

Your All-in-One AI-Powered Toolkit for Academic Success.
+13062052269
info@desklib.com
Available 24*7 on WhatsApp / Email
Unlock your academic potential
Copyright © 2020–2025 A2Z Services. All Rights Reserved. Developed and managed by ZUCOL.