University Finance Report: Riverlea Confectionery Project Analysis
VerifiedAdded on 2020/05/11
|17
|2427
|43
Report
AI Summary
This corporate finance assignment analyzes the proposed confectionery production project by Riverlea. The report utilizes various financial techniques including Net Present Value (NPV), Internal Rate of Return (IRR), payback period, and discounted payback period to assess project viability under different scenarios. Sensitivity analysis is conducted to evaluate the impact of revenue fluctuations. The analysis also includes the calculation of the cost of capital and share price valuation. The report examines the market's reaction to information about the project's potential, evaluates market efficiency, and explores trading strategies like short selling. The findings suggest the project is viable and recommend its implementation, along with strategic investment approaches to maximize returns. The report concludes that the shares reflect semi strong efficiency market, which could be used by investors to adequately improve their return from investment. Moreover, the use of short selling strategy could eventually help in increasing relevant revenue for the investor from the price movement of Reverlea.

Running head: CORPORATE FINANCE ASSIGNMENT
Corporate Finance Assignment
Name of the Student:
Name of the University:
Authors Note:
Corporate Finance Assignment
Name of the Student:
Name of the University:
Authors Note:
Paraphrase This Document
Need a fresh take? Get an instant paraphrase of this document with our AI Paraphraser
1
CORPORATE FINANCE ASSIGNMENT
Executive Summary:
The overall report mainly focuses on identifying proposed production of
confectionery that needs to be conducted by Riverlea. Furthermore, there are different types
of situations that is used in the report, which could be helpful in identifying the viability of
the new project. Adequate sensitivity analysis is conducted to detect whether the project's
viability could be attained even after the revenue decline or increases in future. There are
different types of calculation that are conducted for the project starting from detection of cost
of capital, which was used for calculating relevant NPV of the project. After which adequate
valuation of investment appraisal techniques such as discounted payback period, payback
period and internal rate of return are conducted to detect viability of the project. Moreover,
the calculation is conducted on different scenarios to detect viability of the project, which is
identified to be a viable approach. Therefore, it is recommended for the organisation to
adequately start the production of confectioneries for generating higher revenue in future, as
evaluated by the investment appraisal techniques.
Adequate findings are been conducted to detect the overall impact of the future cash
flows that would be generated from the project. In addition, with the help of relevant graphs
projected increment and actual increment are mainly evaluated to detect the relevant increase
of share price. Furthermore, share price valuation on both adverse and positive circumstances
is relatively evaluated to determine actual change in share price of the organisation.
Therefore, the shares reflect semi strong efficiency market, which could be used by investors
to adequately improve their return from investment. Moreover, the use of short selling
strategy could eventually help in increasing relevant revenue for the investor from the price
movement of Reverlea.
2
CORPORATE FINANCE ASSIGNMENT
Table of Contents
Part 1:.........................................................................................................................................3
1. Introduction:...........................................................................................................................3
2. Findings:.................................................................................................................................3
2.1 The Discounted Rate:...........................................................................................................3
2.2 Evaluation of the expected cash flows:................................................................................5
2.3 Sensitivity Analysis:.............................................................................................................7
2.3.1 Evaluation of the expected cash flow with 40% probability of 40% lowers incremental
revenues:....................................................................................................................................7
2.3.2 Evaluation of the expected cash flow with 10% probability of 20% higher incremental
revenues:....................................................................................................................................9
3. Concussion and Recommendations:....................................................................................11
Part 2:.......................................................................................................................................11
1. Introduction:.........................................................................................................................11
2. Findings:...............................................................................................................................12
2.1 Detecting whether the stock is semi-strong efficiency:.....................................................12
2.2 Depicting the trading strategy:...........................................................................................14
3. Concussion and Recommendations:....................................................................................14
Reference and Bibliography:....................................................................................................16
⊘ This is a preview!⊘
Do you want full access?
Subscribe today to unlock all pages.
Trusted by 1+ million students worldwide
3
CORPORATE FINANCE ASSIGNMENT
Part 1:
1. Introduction:
The overall report mainly focuses on identifying proposed production of
confectionery that needs to be conducted by Riverlea. Furthermore, there are different types
of situations that is used in the report, which could be helpful in identifying the viability of
the new project. Adequate sensitivity analysis is conducted to detect whether the project's
viability could be attained even after the revenue decline or increases in future. This could
eventually help and depicting viability of the project.
2. Findings:
2.1 The Discounted Rate:
Particulars Value
Rf 5.05%
Beta 1.56
Rm 9.22%
CAPM 11.55%
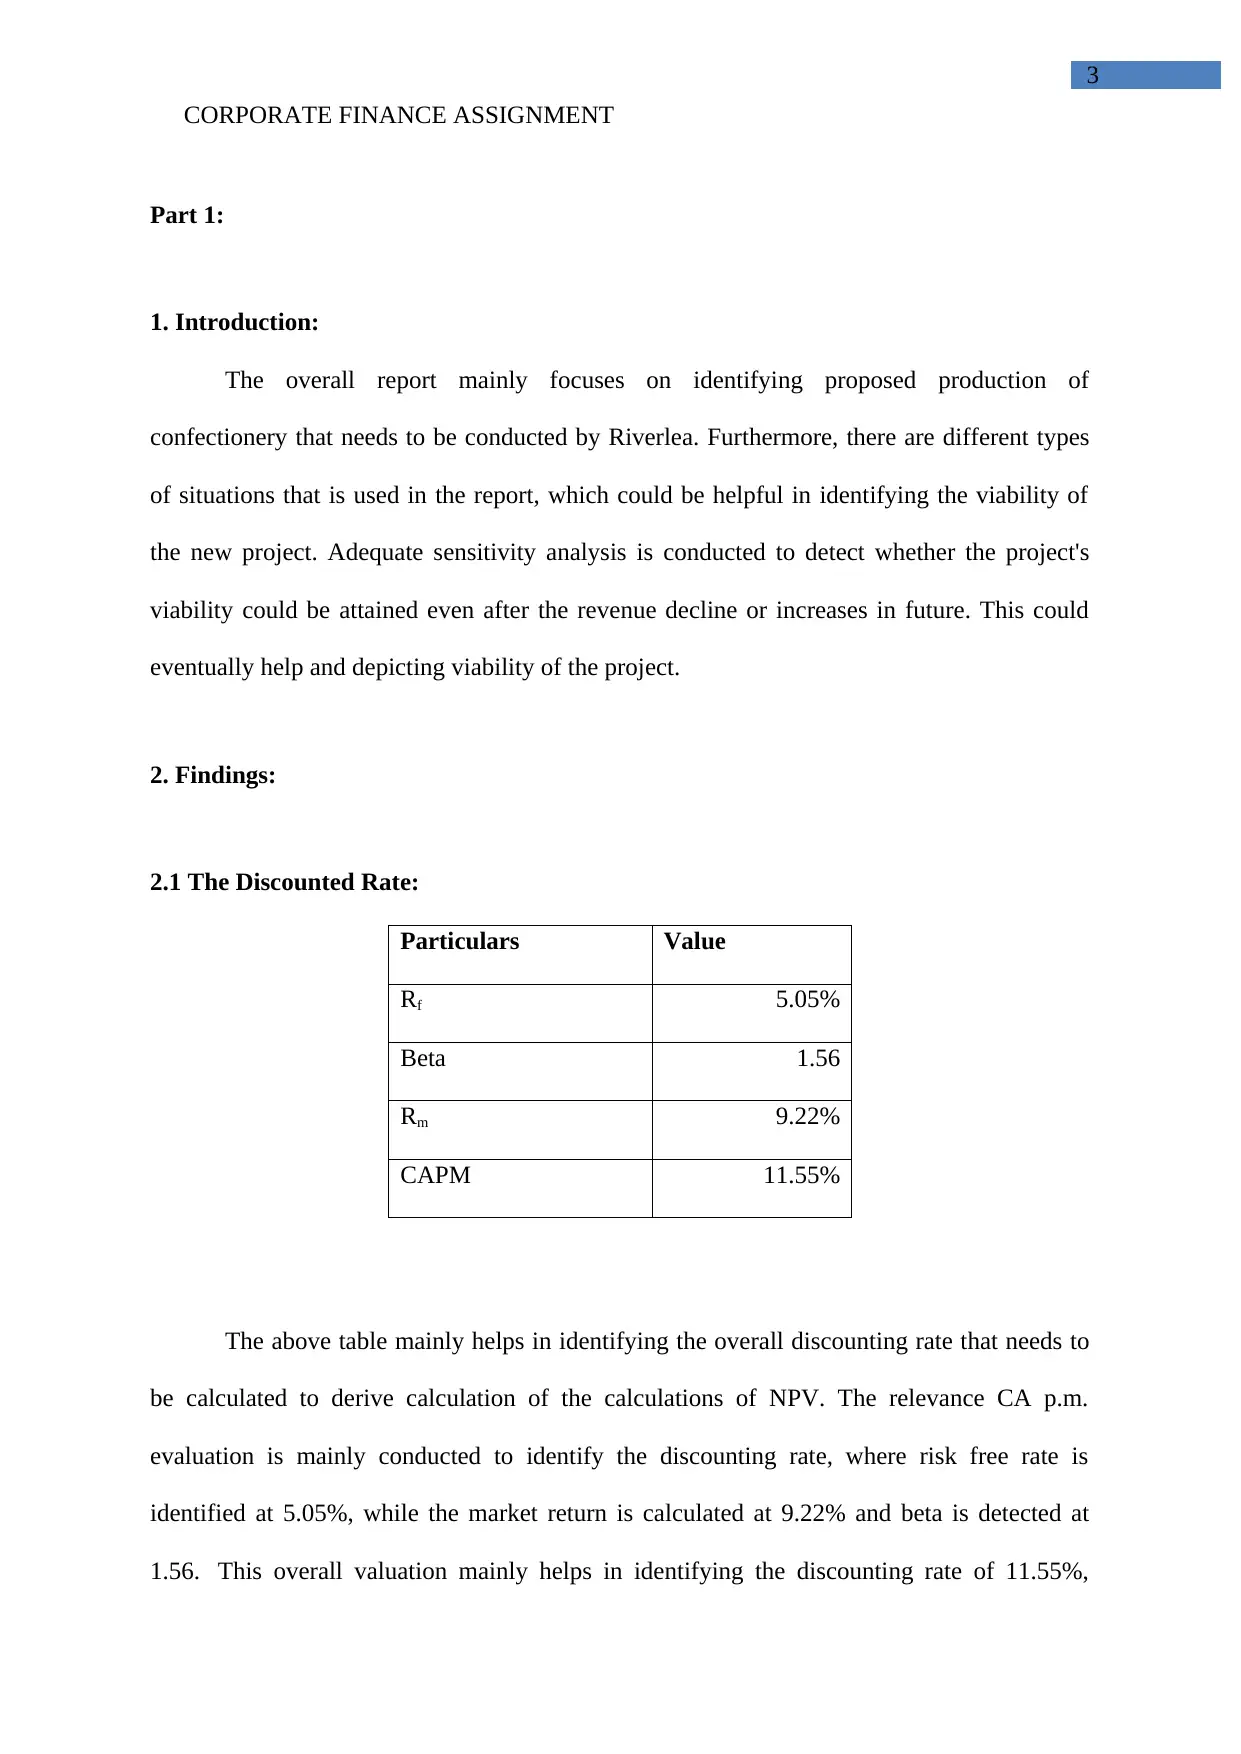
The above table mainly helps in identifying the overall discounting rate that needs to
be calculated to derive calculation of the calculations of NPV. The relevance CA p.m.
evaluation is mainly conducted to identify the discounting rate, where risk free rate is
identified at 5.05%, while the market return is calculated at 9.22% and beta is detected at
1.56. This overall valuation mainly helps in identifying the discounting rate of 11.55%,
CORPORATE FINANCE ASSIGNMENT
Part 1:
1. Introduction:
The overall report mainly focuses on identifying proposed production of
confectionery that needs to be conducted by Riverlea. Furthermore, there are different types
of situations that is used in the report, which could be helpful in identifying the viability of
the new project. Adequate sensitivity analysis is conducted to detect whether the project's
viability could be attained even after the revenue decline or increases in future. This could
eventually help and depicting viability of the project.
2. Findings:
2.1 The Discounted Rate:
Particulars Value
Rf 5.05%
Beta 1.56
Rm 9.22%
CAPM 11.55%
The above table mainly helps in identifying the overall discounting rate that needs to
be calculated to derive calculation of the calculations of NPV. The relevance CA p.m.
evaluation is mainly conducted to identify the discounting rate, where risk free rate is
identified at 5.05%, while the market return is calculated at 9.22% and beta is detected at
1.56. This overall valuation mainly helps in identifying the discounting rate of 11.55%,
Paraphrase This Document
Need a fresh take? Get an instant paraphrase of this document with our AI Paraphraser

4
CORPORATE FINANCE ASSIGNMENT
which could be used in evaluating the viability of the project. Baum and Crosby (2014)
mentioned that companies use the discounting rate to derive the discounted cash flow which
could be used in identifying the project viability.
CORPORATE FINANCE ASSIGNMENT
which could be used in evaluating the viability of the project. Baum and Crosby (2014)
mentioned that companies use the discounting rate to derive the discounted cash flow which
could be used in identifying the project viability.
5
CORPORATE FINANCE ASSIGNMENT
2.2 Evaluation of the expected cash flows:
Item/Year 0 1 2 3 4 5 6 7 8 9 10
Net increase in Revenue $800,000 $880,000 $968,000 $1,064,800 $1,171,280 $1,288,408 $1,417,249 $1,558,974 $1,714,871 $1,886,358
Net decrease in revenue $(200,000) $(200,000) $(200,000) $(200,000) $(200,000) $(200,000) $(200,000) $(200,000) $(200,000) $(200,000)
Net increase in Cost $(240,000) $(272,000) $(307,200) $(345,920) $(388,512) $(435,363) $(486,900) $(543,589) $(605,948) $(674,543)
Increase in Depreciation $(300,000) $(240,000) $(192,000) $(153,600) $(122,880) $(98,304) $(78,643) $(62,915) $(50,332) $(40,265)
Profit on Sale $200,000
Taxable Income $60,000 $168,000 $268,800 $365,280 $459,888 $554,741 $651,706 $752,470 $858,591 $1,171,550
Item/Year 0 1 2 3 4 5 6 7 8 9 10
Net increase in Revenue $800,000 $880,000 $968,000 $1,064,800 $1,171,280 $1,288,408 $1,417,249 $1,558,974 $1,714,871 $1,886,358
Net decrease in revenue $(200,000) $(200,000) $(200,000) $(200,000) $(200,000) $(200,000) $(200,000) $(200,000) $(200,000) $(200,000)
Net increase in Cost $(240,000) $(272,000) $(307,200) $(345,920) $(388,512) $(435,363) $(486,900) $(543,589) $(605,948) $(674,543)
Cost of Machinery $(1,500,000)
Installation and shipping cost $(200,000)
Salvage Value $200,000
Increase in Working Capital $(50,000) $(10,000) $(10,000) $(10,000) $(10,000) $(10,000) $(10,000) $(10,000) $(10,000) $(10,000) $140,000
Tax $(18,000) $(50,400) $(80,640) $(109,584) $(137,966) $(166,422) $(195,512) $(225,741) $(257,577) $(351,465)
Cash Flows $(1,750,000) $332,000 $347,600 $370,160 $399,296 $434,802 $476,623 $524,837 $579,643 $641,345 $1,000,350
Cumulative cash flow $(1,418,000) $(1,086,000) $(738,400) $(368,240) $31,056 $465,858 $942,480 $1,467,318 $2,046,961 $2,688,306 $3,688,656
Item/Year 0 1 2 3 4 5 6 7 8 9 10
Cash Flows $(1,750,000) $332,000 $347,600 $370,160 $399,296 $434,802 $476,623 $524,837 $579,643 $641,345 $1,000,350
Discounting Factor (@11.55%) 1.0000 0.8965 0.8036 0.7204 0.6458 0.5790 0.5190 0.4653 0.4171 0.3739 0.3352
Present value of Cashflows $(1,750,000) $297,624 $279,345 $266,674 $257,879 $251,735 $247,376 $244,196 $241,771 $239,809 $335,318
Cumulative cash flow $(1,452,376) $(1,154,751) $(875,406) $(608,732) $(350,853) $(99,118) $148,258 $392,453 $634,224 $874,033 $1,209,351
NPV 911,726$
IRR 21.07%
Payback (years) 3.92
Discounted Payback (years) 5.40
Taxable Income
Cash Flows
Present value of Cashflows
⊘ This is a preview!⊘
Do you want full access?
Subscribe today to unlock all pages.
Trusted by 1+ million students worldwide
6
CORPORATE FINANCE ASSIGNMENT
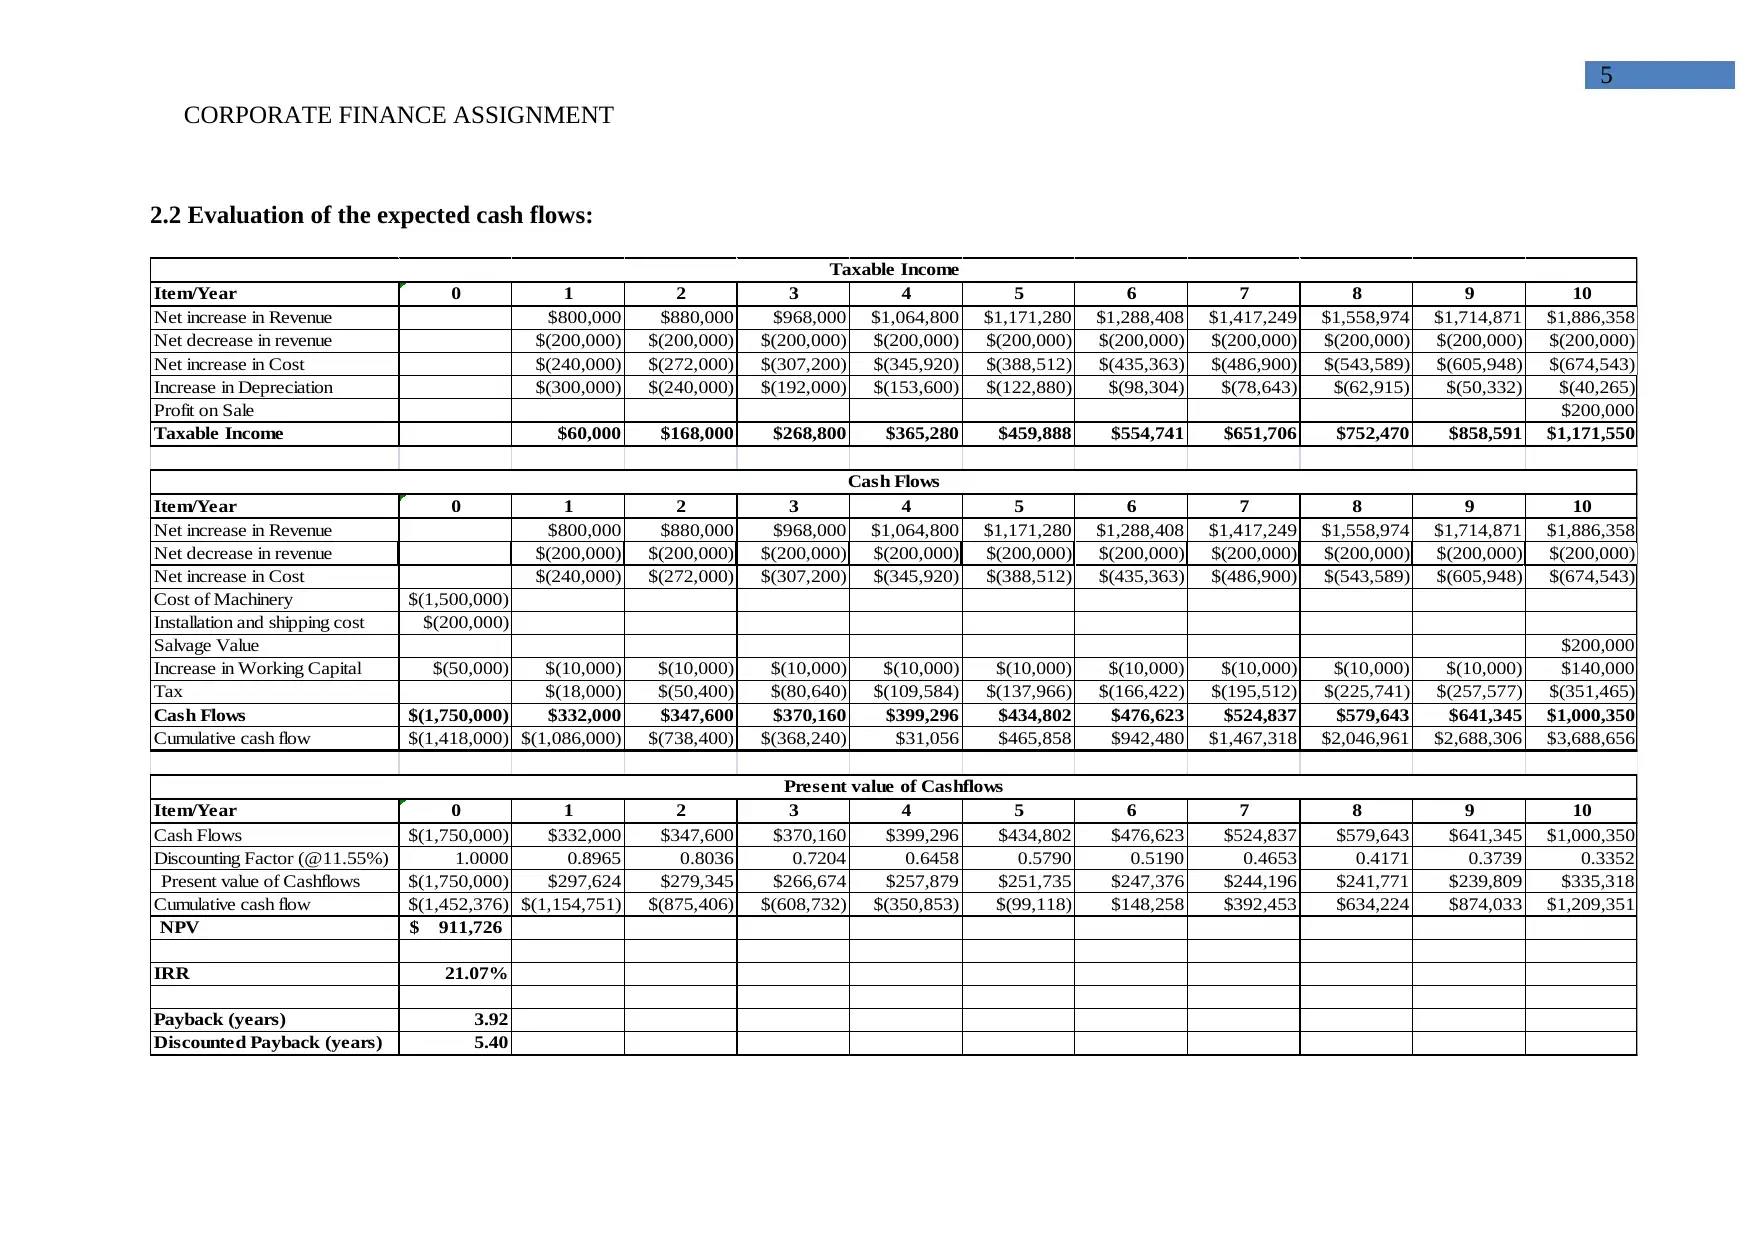
The above figure mainly helps in identifying the overall viability of the project, where relevant investment appraisal techniques are used
such as NPV, IRR, payback period, and discounted payback period to detect viability of the project. Under normal circumstances the overall
project mainly provides a NPV of $911,726, which is relatively positive and detect viability of the investment. Furthermore, the internal rate of
return is identified to be 21.07 %, which is relatively higher than the cost of capital 11.55%. This mainly indicates that the overall returned from
the investment is relatively higher, which could allow the organisation to reinvest the cash on another project and increase their return. The
normal payback period is mainly calculated at 3.9 years, while the discounted payback period States 5.4 years. The overall evaluation of
Payback period mainly detect that the whole capital is collected before completion of the project, which is a viable approach for the organisation.
Hence, investment in the project could eventually allow Riverlea to generate higher return from investment. In this context, Gotze, Northcott and
Schuster (2016) stated that use of adequate investment appraisal technique allows organisation to detect the most viable project, which could
increase firm value in future.
CORPORATE FINANCE ASSIGNMENT
The above figure mainly helps in identifying the overall viability of the project, where relevant investment appraisal techniques are used
such as NPV, IRR, payback period, and discounted payback period to detect viability of the project. Under normal circumstances the overall
project mainly provides a NPV of $911,726, which is relatively positive and detect viability of the investment. Furthermore, the internal rate of
return is identified to be 21.07 %, which is relatively higher than the cost of capital 11.55%. This mainly indicates that the overall returned from
the investment is relatively higher, which could allow the organisation to reinvest the cash on another project and increase their return. The
normal payback period is mainly calculated at 3.9 years, while the discounted payback period States 5.4 years. The overall evaluation of
Payback period mainly detect that the whole capital is collected before completion of the project, which is a viable approach for the organisation.
Hence, investment in the project could eventually allow Riverlea to generate higher return from investment. In this context, Gotze, Northcott and
Schuster (2016) stated that use of adequate investment appraisal technique allows organisation to detect the most viable project, which could
increase firm value in future.
Paraphrase This Document
Need a fresh take? Get an instant paraphrase of this document with our AI Paraphraser
7
CORPORATE FINANCE ASSIGNMENT
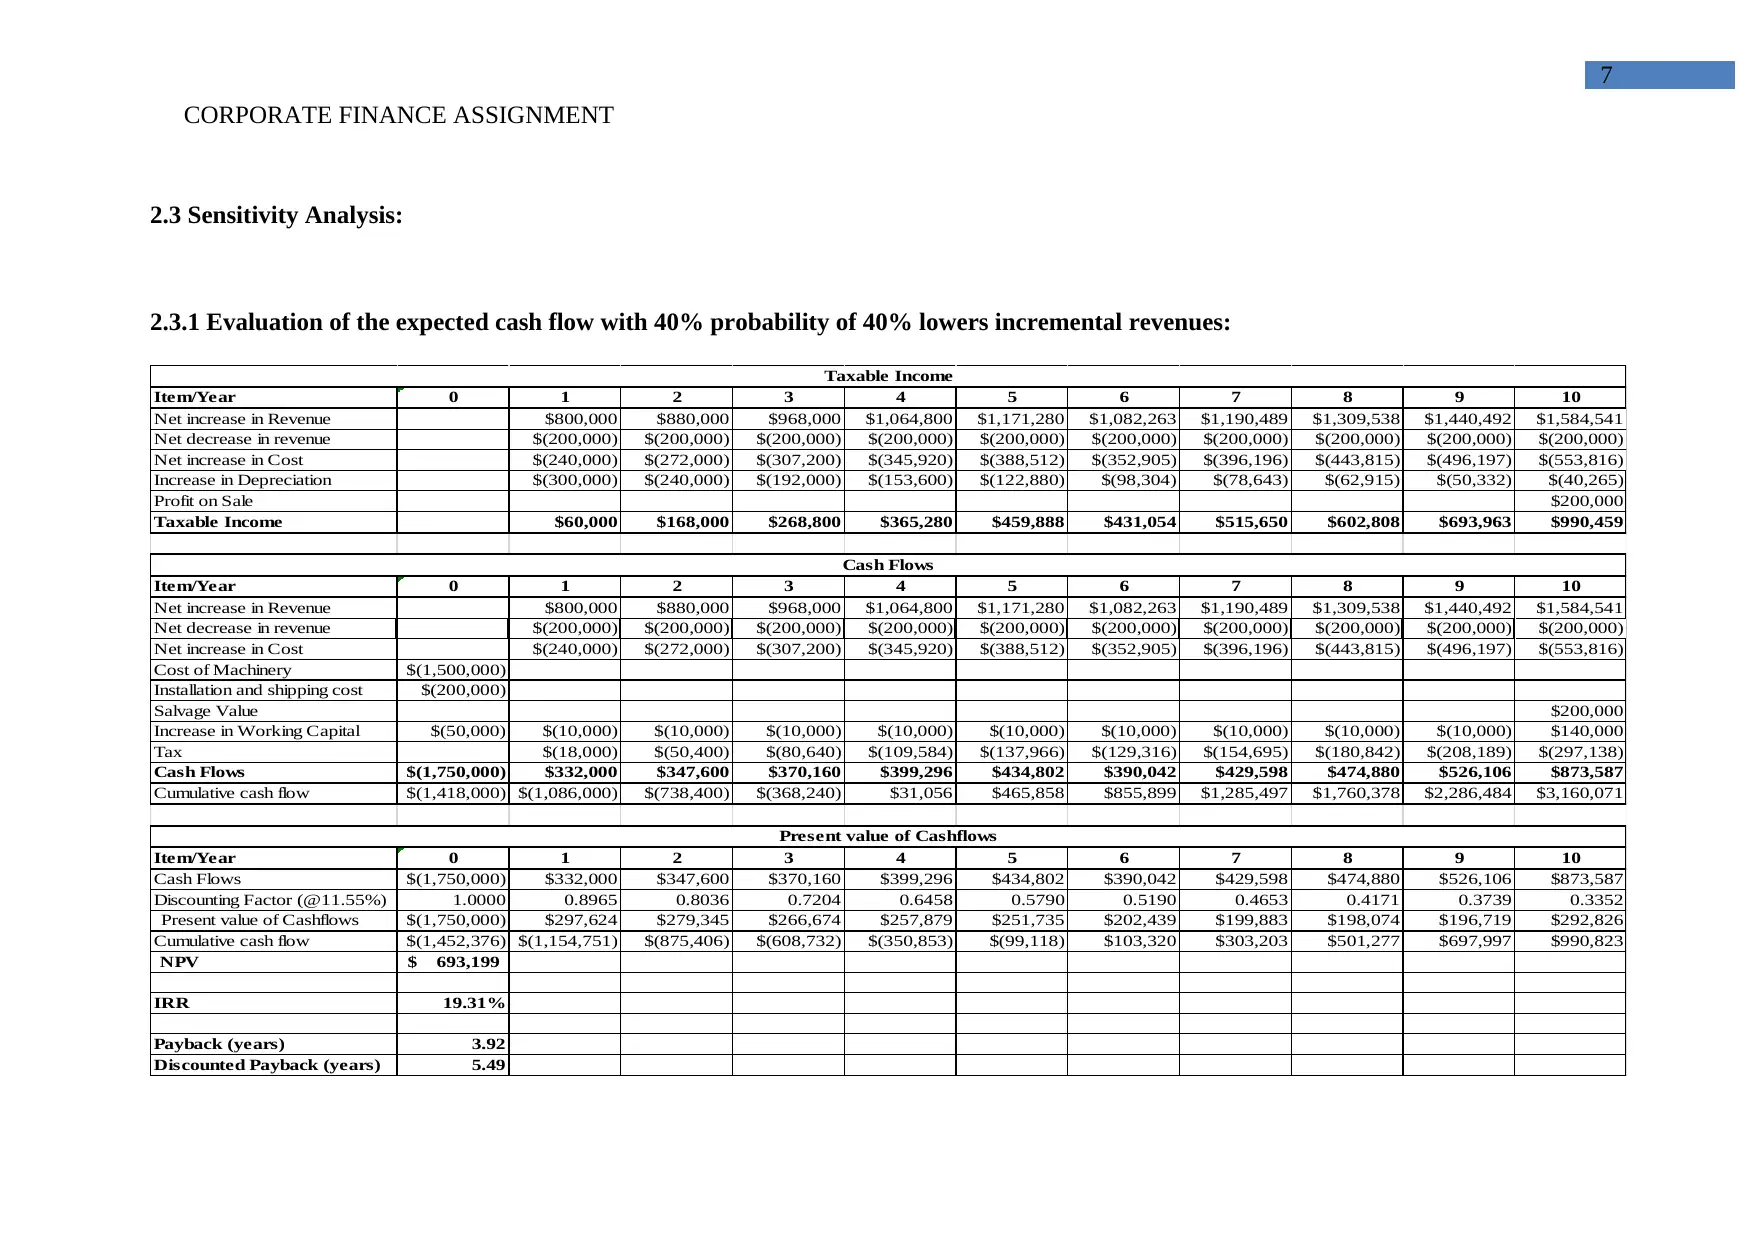
2.3 Sensitivity Analysis:
2.3.1 Evaluation of the expected cash flow with 40% probability of 40% lowers incremental revenues:
Item/Year 0 1 2 3 4 5 6 7 8 9 10
Net increase in Revenue $800,000 $880,000 $968,000 $1,064,800 $1,171,280 $1,082,263 $1,190,489 $1,309,538 $1,440,492 $1,584,541
Net decrease in revenue $(200,000) $(200,000) $(200,000) $(200,000) $(200,000) $(200,000) $(200,000) $(200,000) $(200,000) $(200,000)
Net increase in Cost $(240,000) $(272,000) $(307,200) $(345,920) $(388,512) $(352,905) $(396,196) $(443,815) $(496,197) $(553,816)
Increase in Depreciation $(300,000) $(240,000) $(192,000) $(153,600) $(122,880) $(98,304) $(78,643) $(62,915) $(50,332) $(40,265)
Profit on Sale $200,000
Taxable Income $60,000 $168,000 $268,800 $365,280 $459,888 $431,054 $515,650 $602,808 $693,963 $990,459
Item/Year 0 1 2 3 4 5 6 7 8 9 10
Net increase in Revenue $800,000 $880,000 $968,000 $1,064,800 $1,171,280 $1,082,263 $1,190,489 $1,309,538 $1,440,492 $1,584,541
Net decrease in revenue $(200,000) $(200,000) $(200,000) $(200,000) $(200,000) $(200,000) $(200,000) $(200,000) $(200,000) $(200,000)
Net increase in Cost $(240,000) $(272,000) $(307,200) $(345,920) $(388,512) $(352,905) $(396,196) $(443,815) $(496,197) $(553,816)
Cost of Machinery $(1,500,000)
Installation and shipping cost $(200,000)
Salvage Value $200,000
Increase in Working Capital $(50,000) $(10,000) $(10,000) $(10,000) $(10,000) $(10,000) $(10,000) $(10,000) $(10,000) $(10,000) $140,000
Tax $(18,000) $(50,400) $(80,640) $(109,584) $(137,966) $(129,316) $(154,695) $(180,842) $(208,189) $(297,138)
Cash Flows $(1,750,000) $332,000 $347,600 $370,160 $399,296 $434,802 $390,042 $429,598 $474,880 $526,106 $873,587
Cumulative cash flow $(1,418,000) $(1,086,000) $(738,400) $(368,240) $31,056 $465,858 $855,899 $1,285,497 $1,760,378 $2,286,484 $3,160,071
Item/Year 0 1 2 3 4 5 6 7 8 9 10
Cash Flows $(1,750,000) $332,000 $347,600 $370,160 $399,296 $434,802 $390,042 $429,598 $474,880 $526,106 $873,587
Discounting Factor (@11.55%) 1.0000 0.8965 0.8036 0.7204 0.6458 0.5790 0.5190 0.4653 0.4171 0.3739 0.3352
Present value of Cashflows $(1,750,000) $297,624 $279,345 $266,674 $257,879 $251,735 $202,439 $199,883 $198,074 $196,719 $292,826
Cumulative cash flow $(1,452,376) $(1,154,751) $(875,406) $(608,732) $(350,853) $(99,118) $103,320 $303,203 $501,277 $697,997 $990,823
NPV 693,199$
IRR 19.31%
Payback (years) 3.92
Discounted Payback (years) 5.49
Taxable Income
Cash Flows
Present value of Cashflows
CORPORATE FINANCE ASSIGNMENT
2.3 Sensitivity Analysis:
2.3.1 Evaluation of the expected cash flow with 40% probability of 40% lowers incremental revenues:
Item/Year 0 1 2 3 4 5 6 7 8 9 10
Net increase in Revenue $800,000 $880,000 $968,000 $1,064,800 $1,171,280 $1,082,263 $1,190,489 $1,309,538 $1,440,492 $1,584,541
Net decrease in revenue $(200,000) $(200,000) $(200,000) $(200,000) $(200,000) $(200,000) $(200,000) $(200,000) $(200,000) $(200,000)
Net increase in Cost $(240,000) $(272,000) $(307,200) $(345,920) $(388,512) $(352,905) $(396,196) $(443,815) $(496,197) $(553,816)
Increase in Depreciation $(300,000) $(240,000) $(192,000) $(153,600) $(122,880) $(98,304) $(78,643) $(62,915) $(50,332) $(40,265)
Profit on Sale $200,000
Taxable Income $60,000 $168,000 $268,800 $365,280 $459,888 $431,054 $515,650 $602,808 $693,963 $990,459
Item/Year 0 1 2 3 4 5 6 7 8 9 10
Net increase in Revenue $800,000 $880,000 $968,000 $1,064,800 $1,171,280 $1,082,263 $1,190,489 $1,309,538 $1,440,492 $1,584,541
Net decrease in revenue $(200,000) $(200,000) $(200,000) $(200,000) $(200,000) $(200,000) $(200,000) $(200,000) $(200,000) $(200,000)
Net increase in Cost $(240,000) $(272,000) $(307,200) $(345,920) $(388,512) $(352,905) $(396,196) $(443,815) $(496,197) $(553,816)
Cost of Machinery $(1,500,000)
Installation and shipping cost $(200,000)
Salvage Value $200,000
Increase in Working Capital $(50,000) $(10,000) $(10,000) $(10,000) $(10,000) $(10,000) $(10,000) $(10,000) $(10,000) $(10,000) $140,000
Tax $(18,000) $(50,400) $(80,640) $(109,584) $(137,966) $(129,316) $(154,695) $(180,842) $(208,189) $(297,138)
Cash Flows $(1,750,000) $332,000 $347,600 $370,160 $399,296 $434,802 $390,042 $429,598 $474,880 $526,106 $873,587
Cumulative cash flow $(1,418,000) $(1,086,000) $(738,400) $(368,240) $31,056 $465,858 $855,899 $1,285,497 $1,760,378 $2,286,484 $3,160,071
Item/Year 0 1 2 3 4 5 6 7 8 9 10
Cash Flows $(1,750,000) $332,000 $347,600 $370,160 $399,296 $434,802 $390,042 $429,598 $474,880 $526,106 $873,587
Discounting Factor (@11.55%) 1.0000 0.8965 0.8036 0.7204 0.6458 0.5790 0.5190 0.4653 0.4171 0.3739 0.3352
Present value of Cashflows $(1,750,000) $297,624 $279,345 $266,674 $257,879 $251,735 $202,439 $199,883 $198,074 $196,719 $292,826
Cumulative cash flow $(1,452,376) $(1,154,751) $(875,406) $(608,732) $(350,853) $(99,118) $103,320 $303,203 $501,277 $697,997 $990,823
NPV 693,199$
IRR 19.31%
Payback (years) 3.92
Discounted Payback (years) 5.49
Taxable Income
Cash Flows
Present value of Cashflows
8
CORPORATE FINANCE ASSIGNMENT
The evaluation of the project under lower revenues also indicates a positive viability, which could allow the organisation to generate
higher returns in future. The NPV valuation of the project under low revenue is $693,199, which is relatively positive and indicates a viable
approach for the organisation. Moreover, the internal rate of return is also 19.31% and higher than the cost of capital indicating quick generation
of cash that could be used by the organisation. Lastly the payback period is calculated at 3.9 years, while the discounted payback period is
detected to be at 5.5 years, which is relatively higher than normal circumstances. Hence, under lower revenue the project of producing
confectionery is a viable approach for Riverlea. On the contrary, Almarri and Blackwell (2014) argued that without adequate evaluation
companies should not use the cost of capital, as it might project a wrong valuation of the investment and might decrease the anticipated returns.
⊘ This is a preview!⊘
Do you want full access?
Subscribe today to unlock all pages.
Trusted by 1+ million students worldwide
9
CORPORATE FINANCE ASSIGNMENT
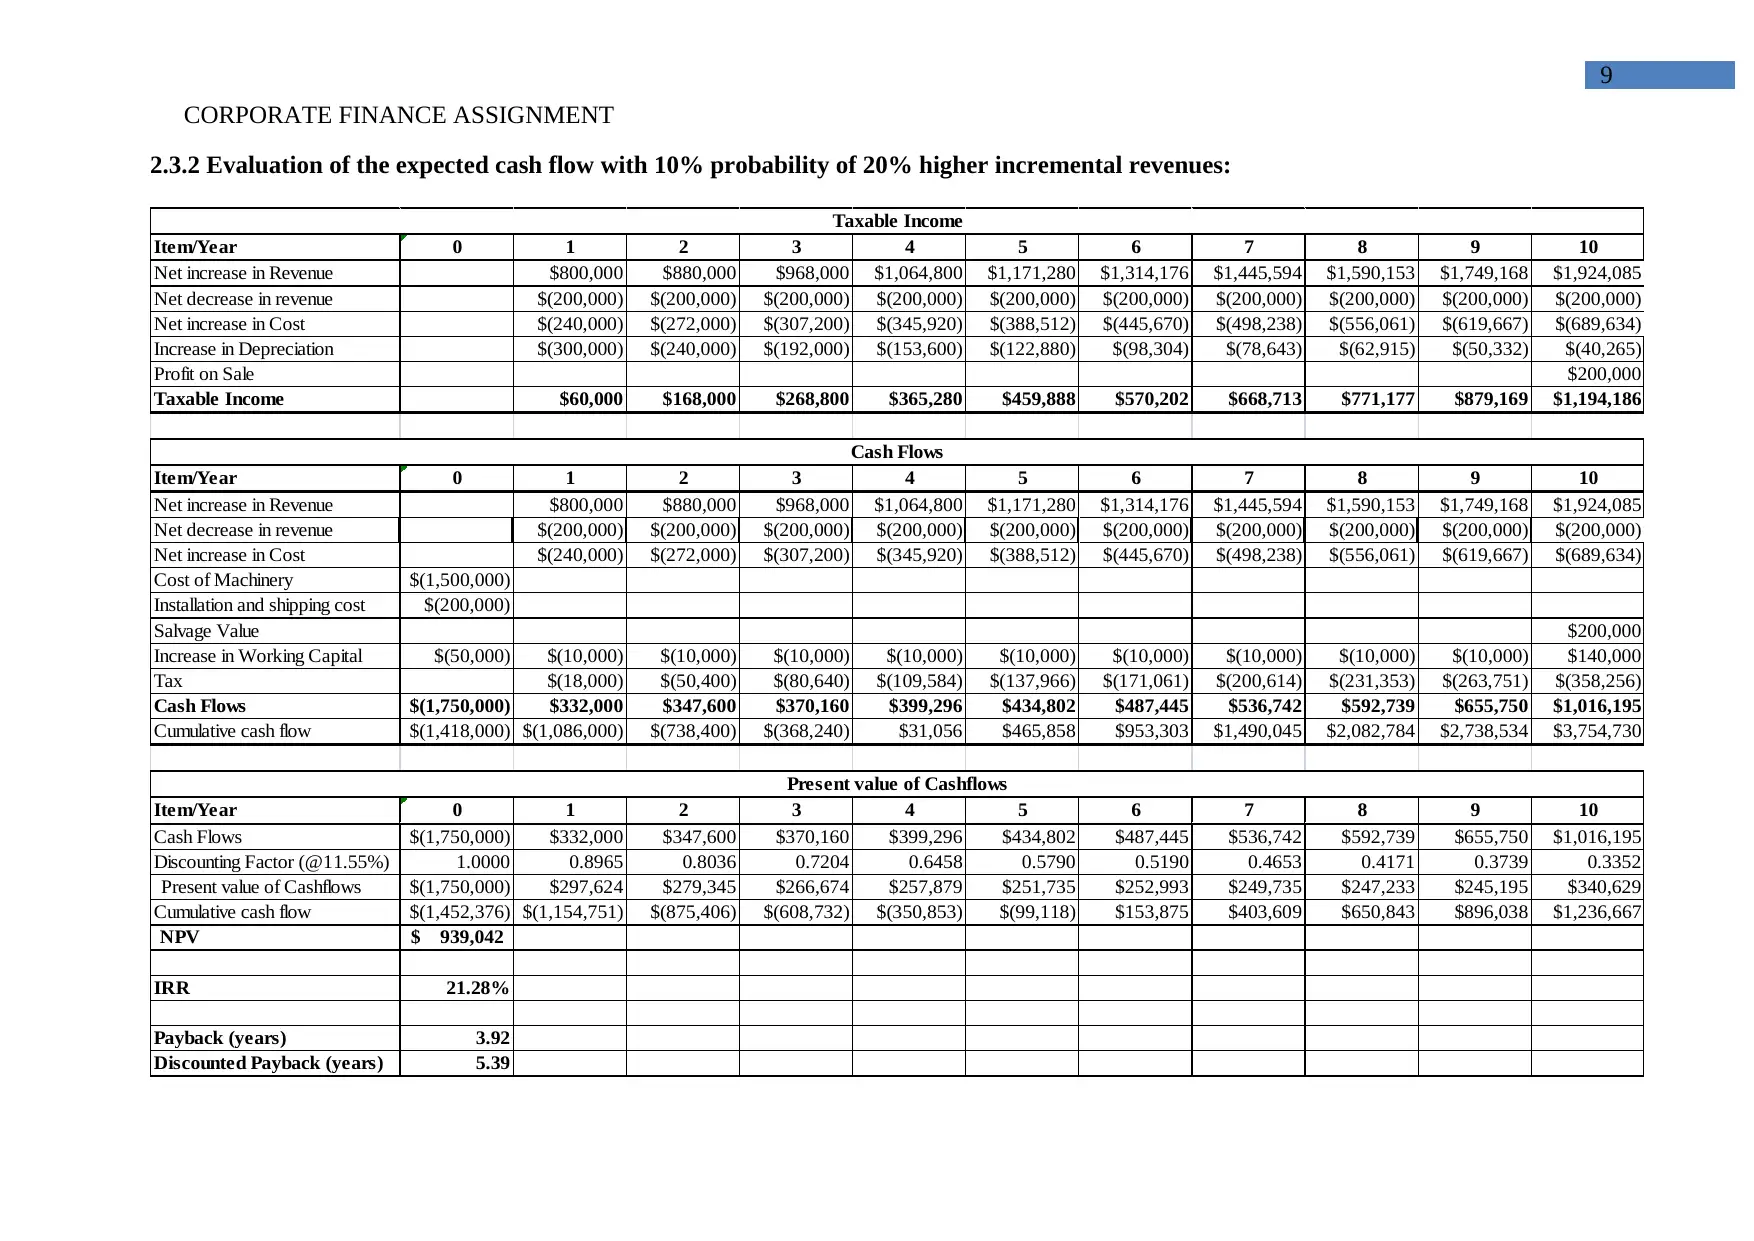
2.3.2 Evaluation of the expected cash flow with 10% probability of 20% higher incremental revenues:
Item/Year 0 1 2 3 4 5 6 7 8 9 10
Net increase in Revenue $800,000 $880,000 $968,000 $1,064,800 $1,171,280 $1,314,176 $1,445,594 $1,590,153 $1,749,168 $1,924,085
Net decrease in revenue $(200,000) $(200,000) $(200,000) $(200,000) $(200,000) $(200,000) $(200,000) $(200,000) $(200,000) $(200,000)
Net increase in Cost $(240,000) $(272,000) $(307,200) $(345,920) $(388,512) $(445,670) $(498,238) $(556,061) $(619,667) $(689,634)
Increase in Depreciation $(300,000) $(240,000) $(192,000) $(153,600) $(122,880) $(98,304) $(78,643) $(62,915) $(50,332) $(40,265)
Profit on Sale $200,000
Taxable Income $60,000 $168,000 $268,800 $365,280 $459,888 $570,202 $668,713 $771,177 $879,169 $1,194,186
Item/Year 0 1 2 3 4 5 6 7 8 9 10
Net increase in Revenue $800,000 $880,000 $968,000 $1,064,800 $1,171,280 $1,314,176 $1,445,594 $1,590,153 $1,749,168 $1,924,085
Net decrease in revenue $(200,000) $(200,000) $(200,000) $(200,000) $(200,000) $(200,000) $(200,000) $(200,000) $(200,000) $(200,000)
Net increase in Cost $(240,000) $(272,000) $(307,200) $(345,920) $(388,512) $(445,670) $(498,238) $(556,061) $(619,667) $(689,634)
Cost of Machinery $(1,500,000)
Installation and shipping cost $(200,000)
Salvage Value $200,000
Increase in Working Capital $(50,000) $(10,000) $(10,000) $(10,000) $(10,000) $(10,000) $(10,000) $(10,000) $(10,000) $(10,000) $140,000
Tax $(18,000) $(50,400) $(80,640) $(109,584) $(137,966) $(171,061) $(200,614) $(231,353) $(263,751) $(358,256)
Cash Flows $(1,750,000) $332,000 $347,600 $370,160 $399,296 $434,802 $487,445 $536,742 $592,739 $655,750 $1,016,195
Cumulative cash flow $(1,418,000) $(1,086,000) $(738,400) $(368,240) $31,056 $465,858 $953,303 $1,490,045 $2,082,784 $2,738,534 $3,754,730
Item/Year 0 1 2 3 4 5 6 7 8 9 10
Cash Flows $(1,750,000) $332,000 $347,600 $370,160 $399,296 $434,802 $487,445 $536,742 $592,739 $655,750 $1,016,195
Discounting Factor (@11.55%) 1.0000 0.8965 0.8036 0.7204 0.6458 0.5790 0.5190 0.4653 0.4171 0.3739 0.3352
Present value of Cashflows $(1,750,000) $297,624 $279,345 $266,674 $257,879 $251,735 $252,993 $249,735 $247,233 $245,195 $340,629
Cumulative cash flow $(1,452,376) $(1,154,751) $(875,406) $(608,732) $(350,853) $(99,118) $153,875 $403,609 $650,843 $896,038 $1,236,667
NPV 939,042$
IRR 21.28%
Payback (years) 3.92
Discounted Payback (years) 5.39
Taxable Income
Cash Flows
Present value of Cashflows
CORPORATE FINANCE ASSIGNMENT
2.3.2 Evaluation of the expected cash flow with 10% probability of 20% higher incremental revenues:
Item/Year 0 1 2 3 4 5 6 7 8 9 10
Net increase in Revenue $800,000 $880,000 $968,000 $1,064,800 $1,171,280 $1,314,176 $1,445,594 $1,590,153 $1,749,168 $1,924,085
Net decrease in revenue $(200,000) $(200,000) $(200,000) $(200,000) $(200,000) $(200,000) $(200,000) $(200,000) $(200,000) $(200,000)
Net increase in Cost $(240,000) $(272,000) $(307,200) $(345,920) $(388,512) $(445,670) $(498,238) $(556,061) $(619,667) $(689,634)
Increase in Depreciation $(300,000) $(240,000) $(192,000) $(153,600) $(122,880) $(98,304) $(78,643) $(62,915) $(50,332) $(40,265)
Profit on Sale $200,000
Taxable Income $60,000 $168,000 $268,800 $365,280 $459,888 $570,202 $668,713 $771,177 $879,169 $1,194,186
Item/Year 0 1 2 3 4 5 6 7 8 9 10
Net increase in Revenue $800,000 $880,000 $968,000 $1,064,800 $1,171,280 $1,314,176 $1,445,594 $1,590,153 $1,749,168 $1,924,085
Net decrease in revenue $(200,000) $(200,000) $(200,000) $(200,000) $(200,000) $(200,000) $(200,000) $(200,000) $(200,000) $(200,000)
Net increase in Cost $(240,000) $(272,000) $(307,200) $(345,920) $(388,512) $(445,670) $(498,238) $(556,061) $(619,667) $(689,634)
Cost of Machinery $(1,500,000)
Installation and shipping cost $(200,000)
Salvage Value $200,000
Increase in Working Capital $(50,000) $(10,000) $(10,000) $(10,000) $(10,000) $(10,000) $(10,000) $(10,000) $(10,000) $(10,000) $140,000
Tax $(18,000) $(50,400) $(80,640) $(109,584) $(137,966) $(171,061) $(200,614) $(231,353) $(263,751) $(358,256)
Cash Flows $(1,750,000) $332,000 $347,600 $370,160 $399,296 $434,802 $487,445 $536,742 $592,739 $655,750 $1,016,195
Cumulative cash flow $(1,418,000) $(1,086,000) $(738,400) $(368,240) $31,056 $465,858 $953,303 $1,490,045 $2,082,784 $2,738,534 $3,754,730
Item/Year 0 1 2 3 4 5 6 7 8 9 10
Cash Flows $(1,750,000) $332,000 $347,600 $370,160 $399,296 $434,802 $487,445 $536,742 $592,739 $655,750 $1,016,195
Discounting Factor (@11.55%) 1.0000 0.8965 0.8036 0.7204 0.6458 0.5790 0.5190 0.4653 0.4171 0.3739 0.3352
Present value of Cashflows $(1,750,000) $297,624 $279,345 $266,674 $257,879 $251,735 $252,993 $249,735 $247,233 $245,195 $340,629
Cumulative cash flow $(1,452,376) $(1,154,751) $(875,406) $(608,732) $(350,853) $(99,118) $153,875 $403,609 $650,843 $896,038 $1,236,667
NPV 939,042$
IRR 21.28%
Payback (years) 3.92
Discounted Payback (years) 5.39
Taxable Income
Cash Flows
Present value of Cashflows
Paraphrase This Document
Need a fresh take? Get an instant paraphrase of this document with our AI Paraphraser
10
CORPORATE FINANCE ASSIGNMENT
Moreover, evaluation of the project under higher revenue directly portrays a positive NPV of $939,042 with an IRR of 21.28%. This
directly indicates the overall viability of the project, which could be obtained by Riverlea. Moreover the payback period is detected to be 3.9
years, while the discounted payback period is directed to be 5.4 years, which is relatively quicker than the normal circumstances. This directly
indicates that incremental revenue could also provide higher returns to the company, we improve its revenue retention capacity. Hence, it could
be identified that the project has viable approach, which might improve return from investment and allow the organisation to attain sustainable
growth. On the other hand, Eliasson and Börjesson (2014) criticises that increment in inflation rate could directly have a negative impact on the
returns provided by the project, which needs to be evaluated by the company before initiating the investment.
11
CORPORATE FINANCE ASSIGNMENT
3. Concussion and Recommendations:
From the evaluation of the above calculation viability of the project for producing
confectioneries can be detected. There are different types of calculation that are conducted for
the project starting from detection of cost of capital, which was used for calculating relevant
NPV of the project. After which adequate valuation of investment appraisal techniques such
as discounted payback period, payback period and internal rate of return are conducted to
detect viability of the project. Moreover, the calculation is conducted on different scenarios to
detect viability of the project, which is identified to be a viable approach. This directly
indicates that all the valuation conducted for the project has provided a positive view and
could allow the organisation to commence with the project. Hence, Riverlea could commence
with the production of confectioneries, which might help in improving future revenues of the
organisation.
Therefore, it is recommended for the organisation to adequately start the production
of confectioneries for generating higher revenue in future, as evaluated by the investment
appraisal techniques.
Part 2:
1. Introduction:
Adequate evaluation of share price movement is mainly conducted of Riverlea, where
the impact of the expected income generated by the company could be seen in its share price.
Adequate findings are been conducted to detect the overall impact of the future cash flows
that would be generated from the project. In addition, with the help of relevant graphs
projected increment and actual increment are mainly evaluated to detect the relevant increase
⊘ This is a preview!⊘
Do you want full access?
Subscribe today to unlock all pages.
Trusted by 1+ million students worldwide
1 out of 17
Related Documents


Your All-in-One AI-Powered Toolkit for Academic Success.
+13062052269
info@desklib.com
Available 24*7 on WhatsApp / Email
![[object Object]](/_next/static/media/star-bottom.7253800d.svg)
Unlock your academic potential
Copyright © 2020–2026 A2Z Services. All Rights Reserved. Developed and managed by ZUCOL.