BAP53 Corporate Finance Project Report: Bega Cheese Analysis
VerifiedAdded on  2023/06/09
|8
|1702
|495
Project
AI Summary
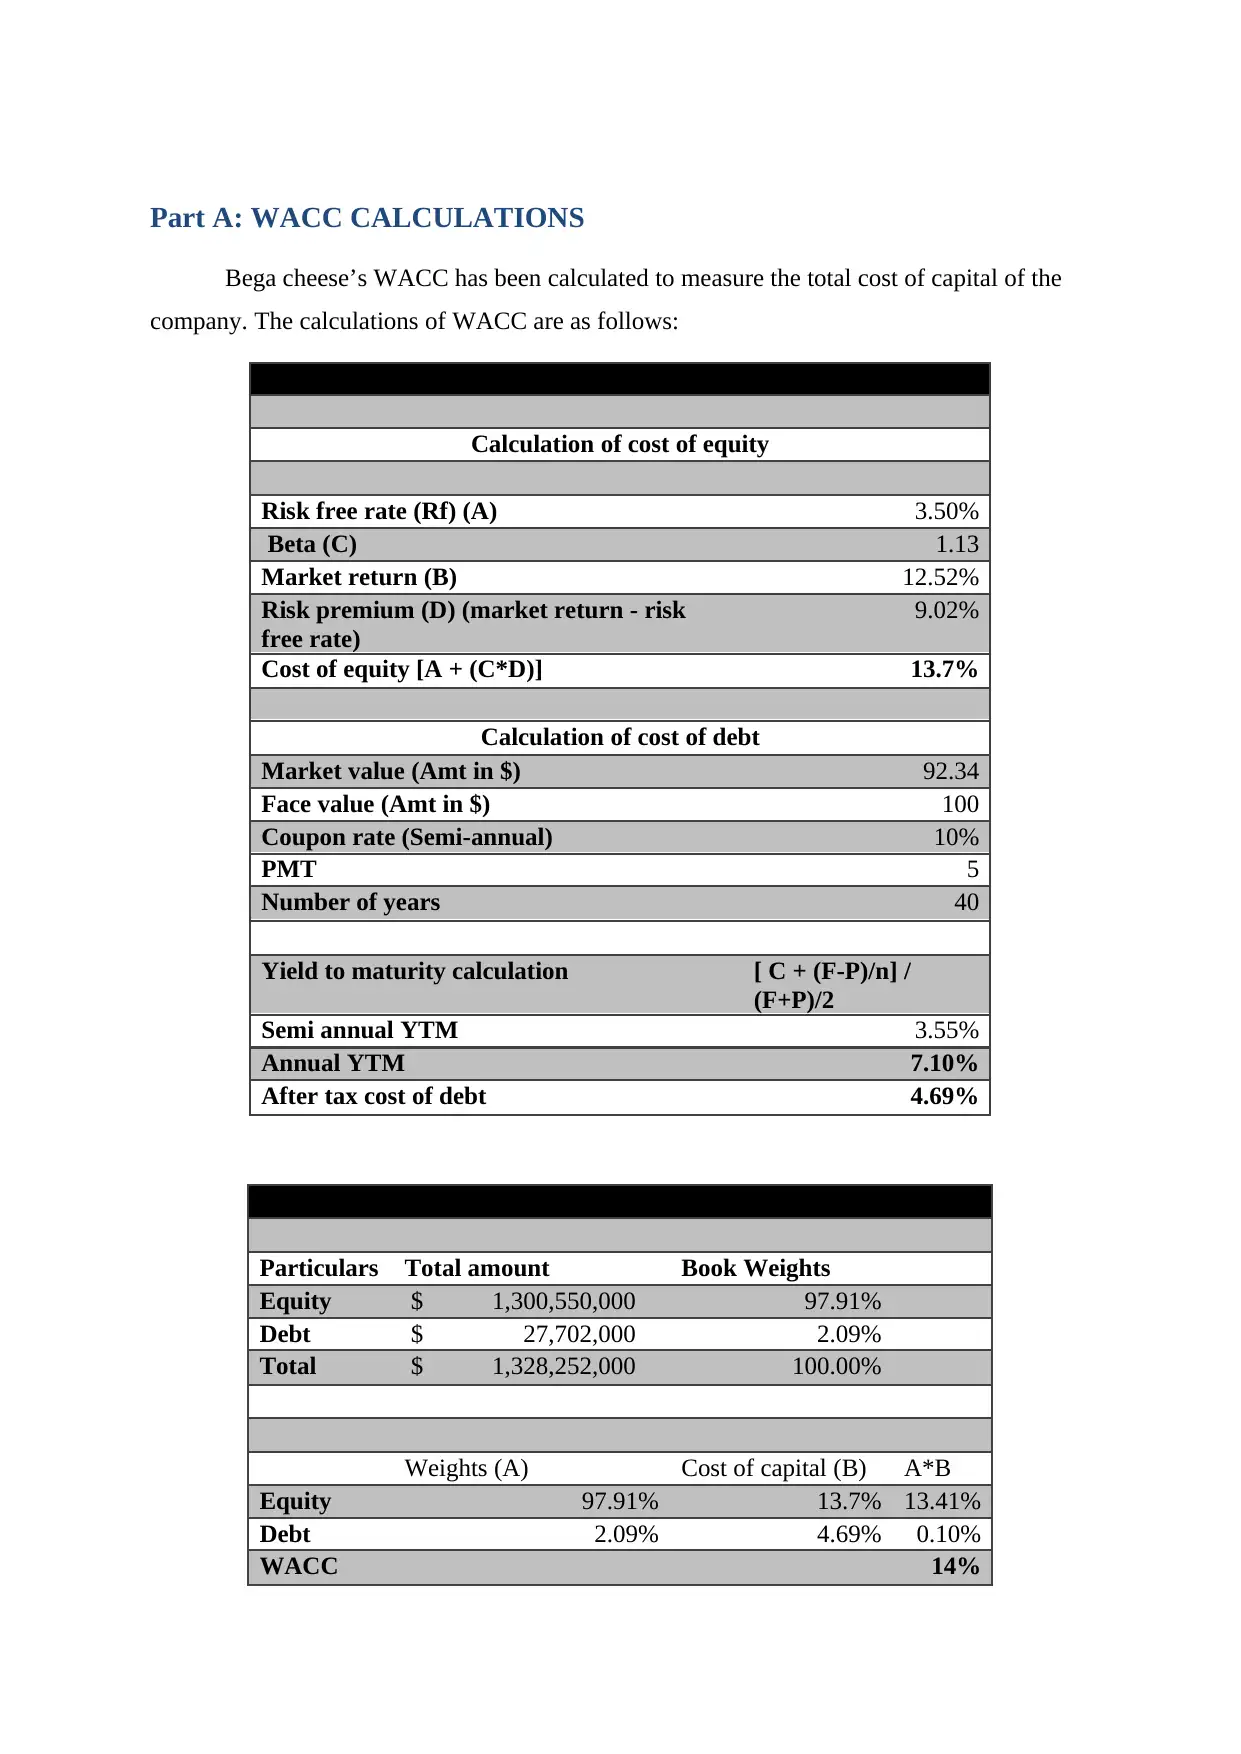
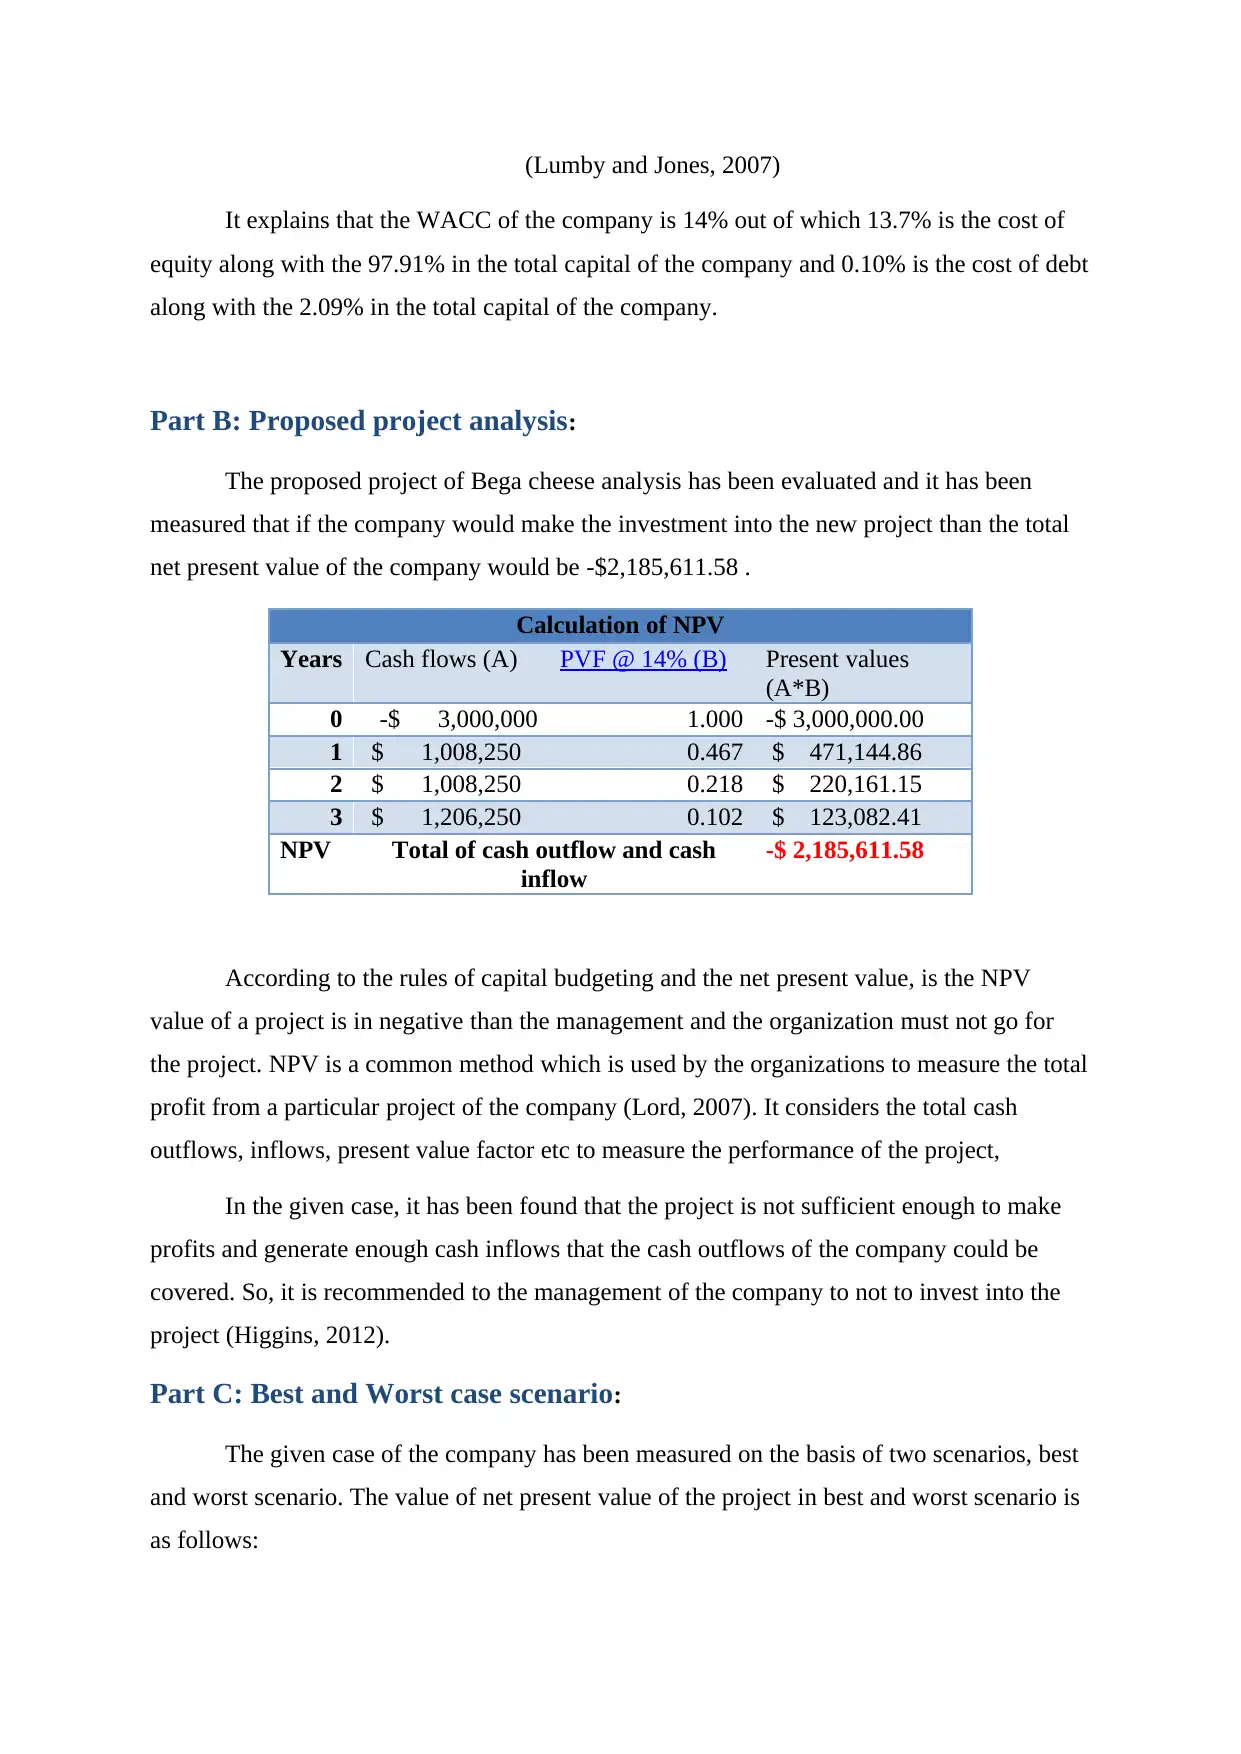
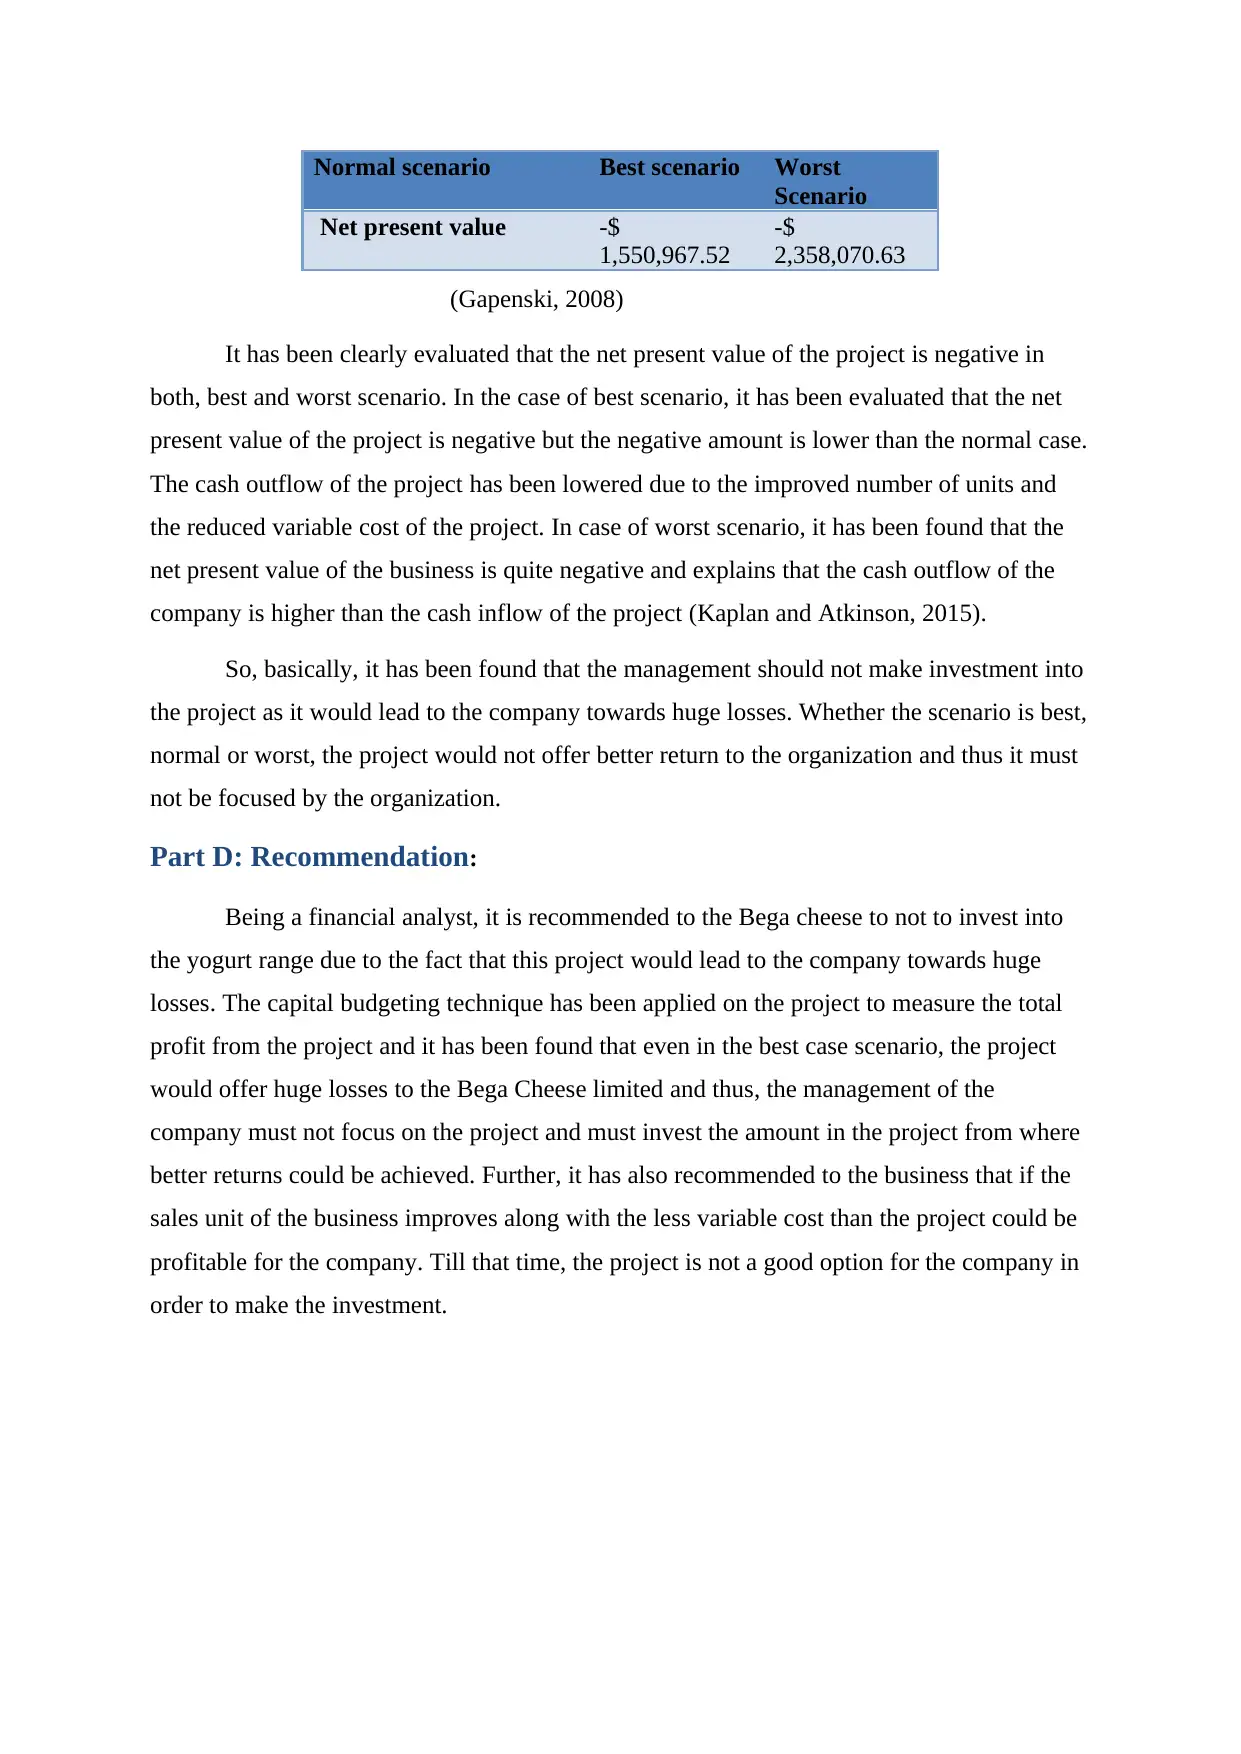
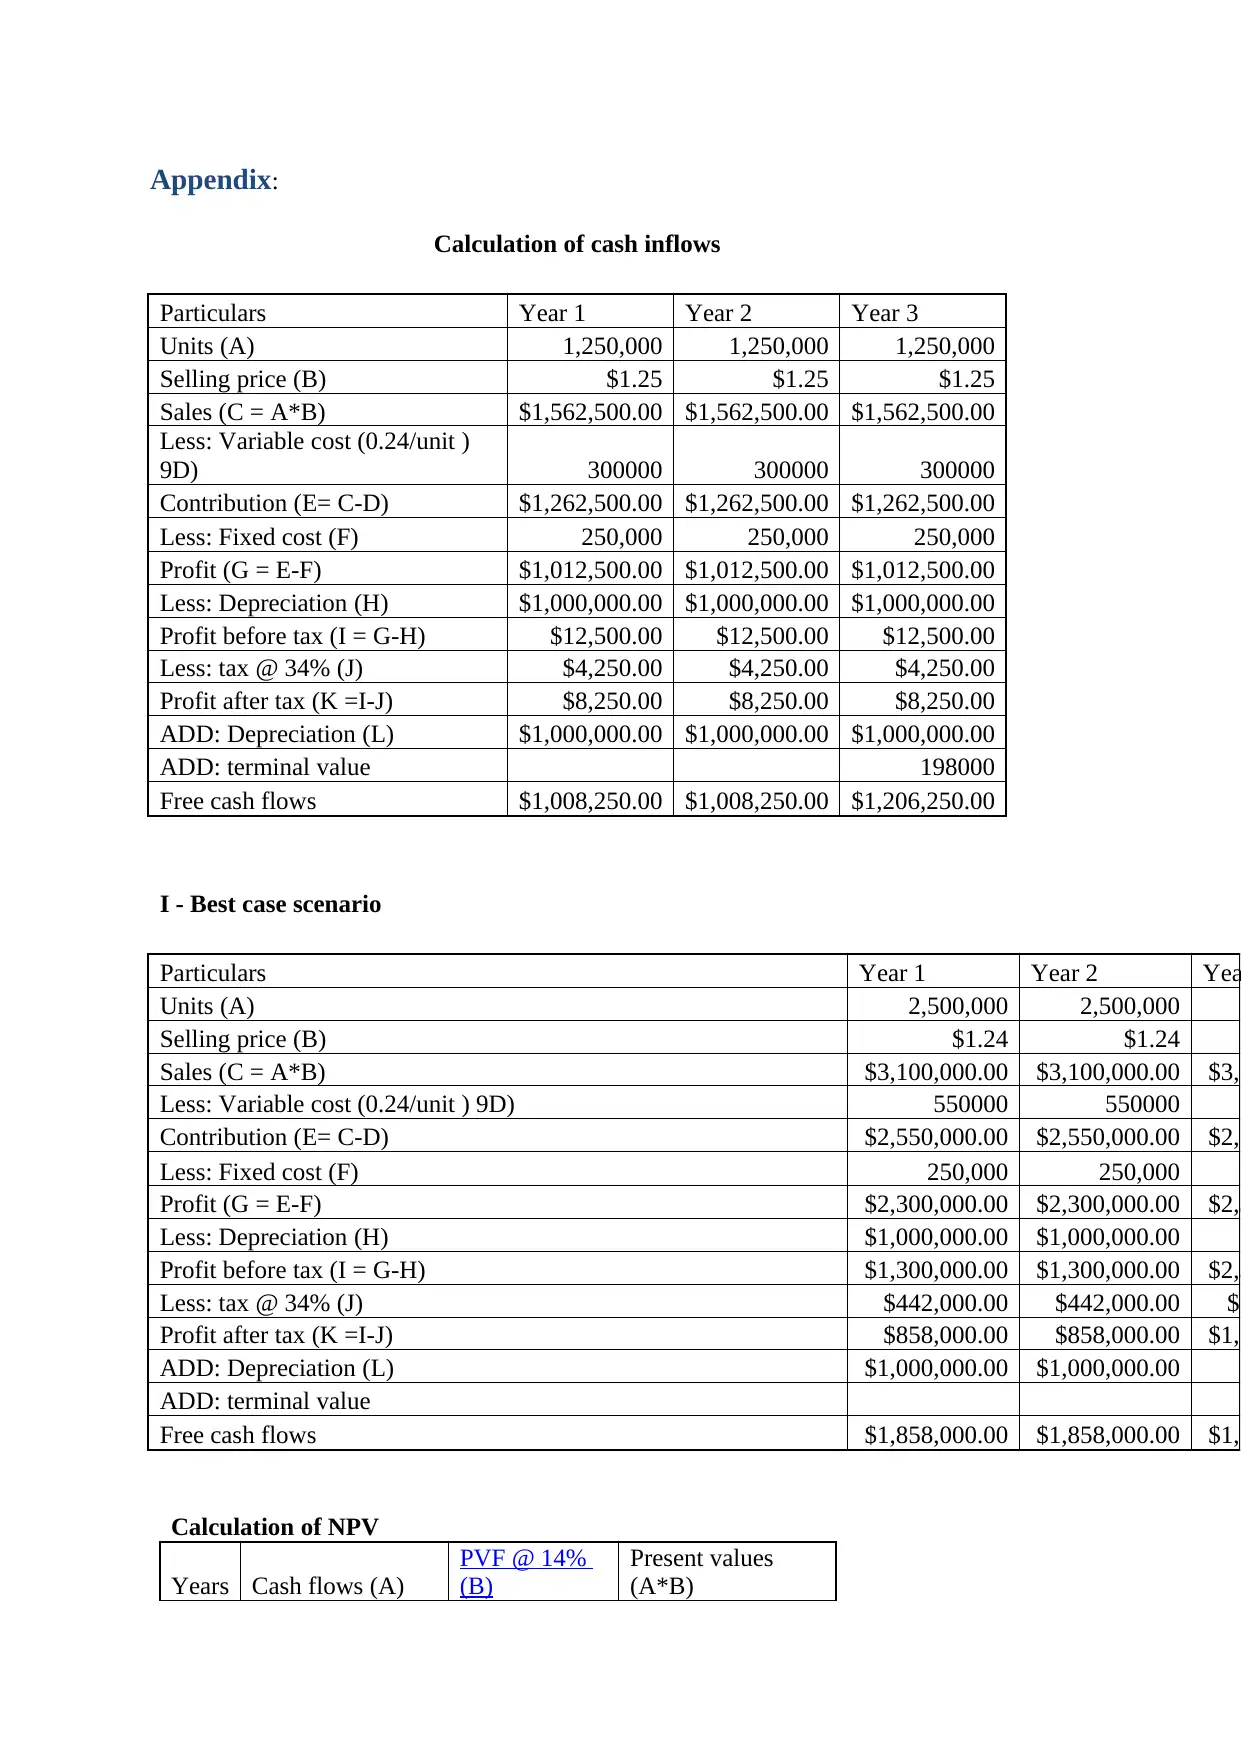
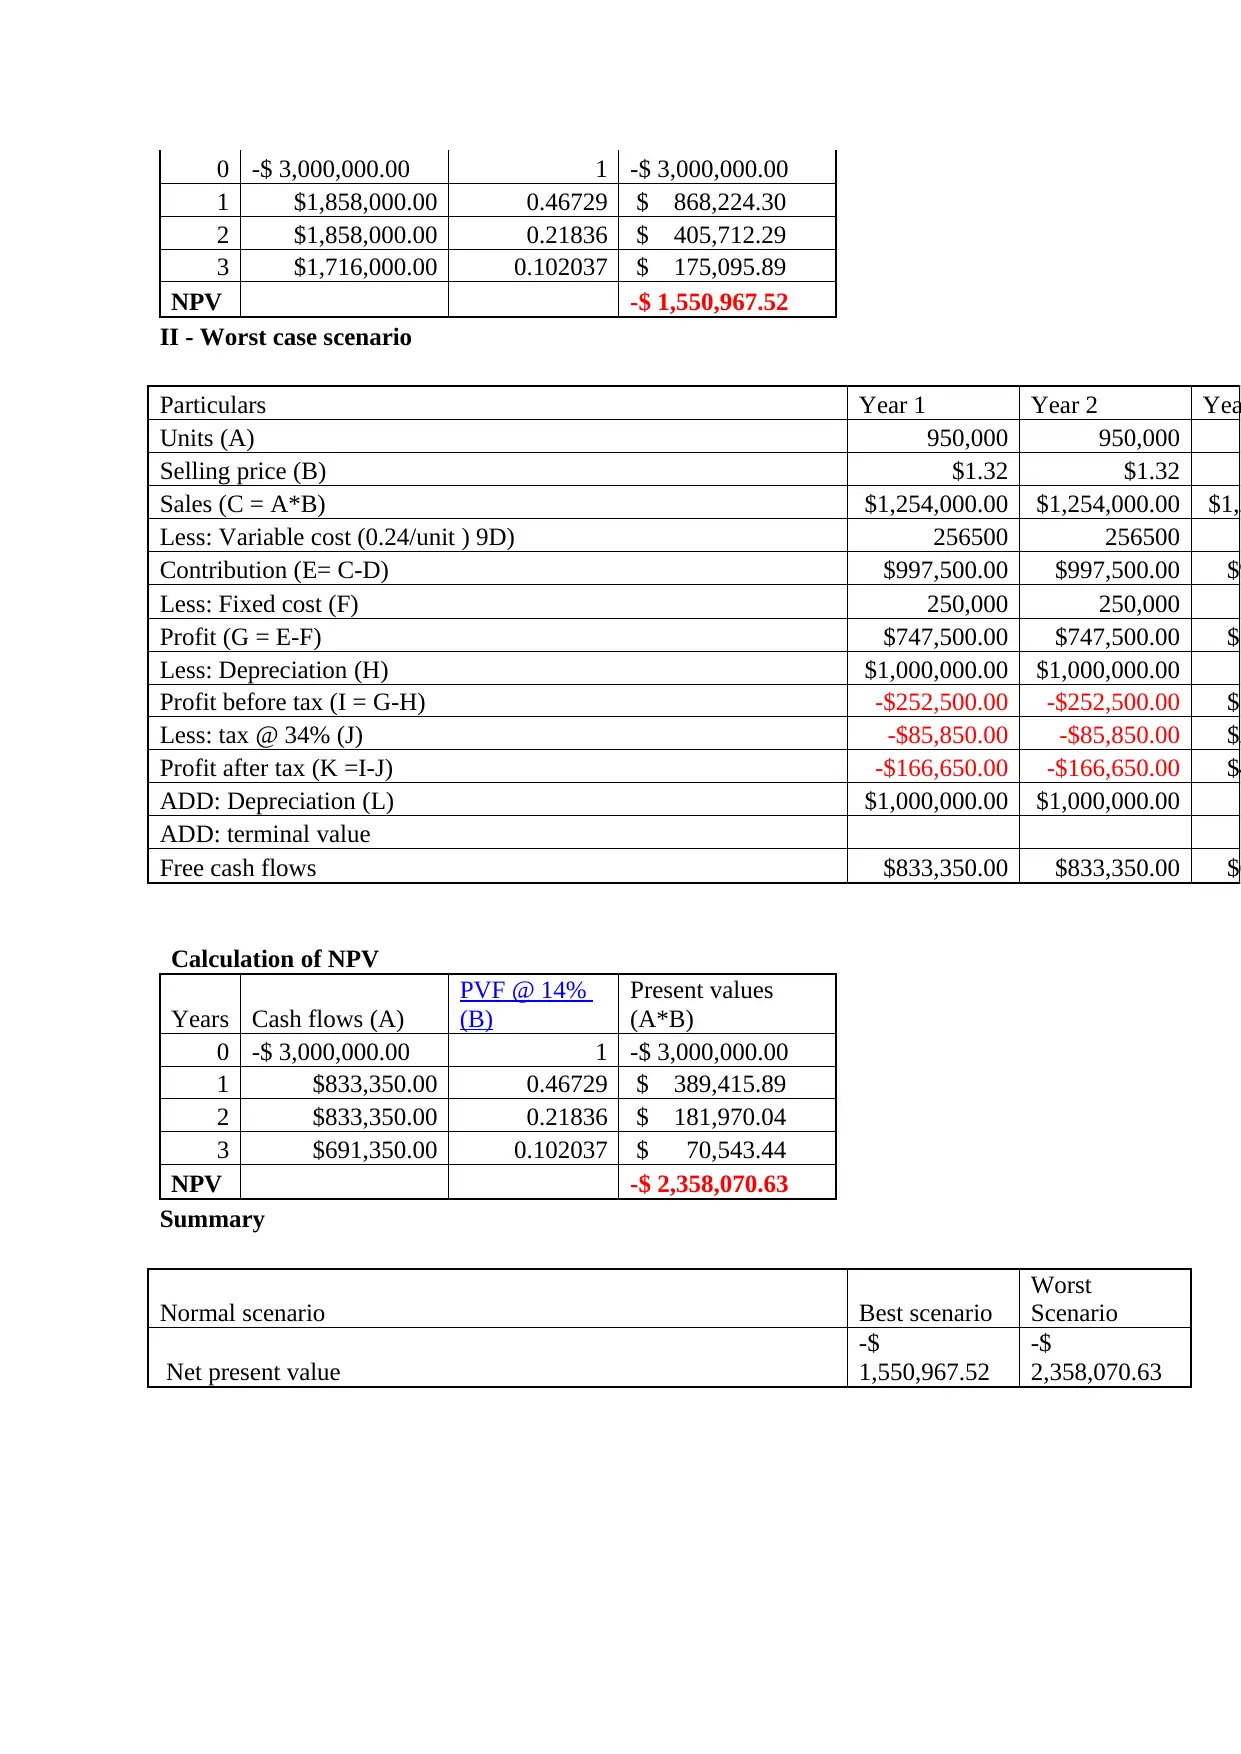
This project report provides a comprehensive financial analysis of Bega Cheese's proposed project, focusing on the yogurt range. The report begins with the calculation of the company's Weighted Average Cost of Capital (WACC), which is determined to be 14%, with 13.7% being the cost of equity and 0.10% being the cost of debt. The analysis then proceeds to evaluate the project's Net Present Value (NPV), revealing a negative NPV of -$2,185,611.58, indicating that the project is not financially viable. The report further examines the best and worst-case scenarios, both of which also yield negative NPVs, solidifying the recommendation against the investment. The financial analyst recommends that Bega Cheese should not invest in the yogurt range because the project would lead to significant losses. The report includes detailed calculations of cash inflows, along with the NPV calculations for all scenarios. The report recommends against investing in the project, as the financial analysis indicates that it is not likely to generate sufficient returns. The project's failure to generate positive returns is consistent across different scenarios and is not recommended for investment.

Project Report: Corporate Finance
Paraphrase This Document
Need a fresh take? Get an instant paraphrase of this document with our AI Paraphraser

Contents
Part A: WACC CALCULATIONS..................................................................................3
Part B: Proposed project analysis.....................................................................................4
Part C: Best and Worst case scenario...............................................................................4
Part D: Recommendation..................................................................................................5
References.........................................................................................................................6
Appendix...........................................................................................................................7

Part A: WACC CALCULATIONS
Bega cheese’s WACC has been calculated to measure the total cost of capital of the
company. The calculations of WACC are as follows:
Calculation of WACC
Calculation of cost of equity
Risk free rate (Rf) (A) 3.50%
Beta (C) 1.13
Market return (B) 12.52%
Risk premium (D) (market return - risk
free rate)
9.02%
Cost of equity [A + (C*D)] 13.7%
Calculation of cost of debt
Market value (Amt in $) 92.34
Face value (Amt in $) 100
Coupon rate (Semi-annual) 10%
PMT 5
Number of years 40
Yield to maturity calculation [ C + (F-P)/n] /
(F+P)/2
Semi annual YTM 3.55%
Annual YTM 7.10%
After tax cost of debt 4.69%
Calculation of WACC
Particulars Total amount Book Weights
Equity $ 1,300,550,000 97.91%
Debt $ 27,702,000 2.09%
Total $ 1,328,252,000 100.00%
Weights (A) Cost of capital (B) A*B
Equity 97.91% 13.7% 13.41%
Debt 2.09% 4.69% 0.10%
WACC 14%
⊘ This is a preview!⊘
Do you want full access?
Subscribe today to unlock all pages.

Trusted by 1+ million students worldwide

(Lumby and Jones, 2007)
It explains that the WACC of the company is 14% out of which 13.7% is the cost of
equity along with the 97.91% in the total capital of the company and 0.10% is the cost of debt
along with the 2.09% in the total capital of the company.
Part B: Proposed project analysis:
The proposed project of Bega cheese analysis has been evaluated and it has been
measured that if the company would make the investment into the new project than the total
net present value of the company would be -$2,185,611.58 .
Calculation of NPV
Years Cash flows (A) PVF @ 14% (B) Present values
(A*B)
0 -$ 3,000,000 1.000 -$ 3,000,000.00
1 $ 1,008,250 0.467 $ 471,144.86
2 $ 1,008,250 0.218 $ 220,161.15
3 $ 1,206,250 0.102 $ 123,082.41
NPV Total of cash outflow and cash
inflow
-$ 2,185,611.58
According to the rules of capital budgeting and the net present value, is the NPV
value of a project is in negative than the management and the organization must not go for
the project. NPV is a common method which is used by the organizations to measure the total
profit from a particular project of the company (Lord, 2007). It considers the total cash
outflows, inflows, present value factor etc to measure the performance of the project,
In the given case, it has been found that the project is not sufficient enough to make
profits and generate enough cash inflows that the cash outflows of the company could be
covered. So, it is recommended to the management of the company to not to invest into the
project (Higgins, 2012).
Part C: Best and Worst case scenario:
The given case of the company has been measured on the basis of two scenarios, best
and worst scenario. The value of net present value of the project in best and worst scenario is
as follows:
Paraphrase This Document
Need a fresh take? Get an instant paraphrase of this document with our AI Paraphraser

Normal scenario Best scenario Worst
Scenario
Net present value -$
1,550,967.52
-$
2,358,070.63
(Gapenski, 2008)
It has been clearly evaluated that the net present value of the project is negative in
both, best and worst scenario. In the case of best scenario, it has been evaluated that the net
present value of the project is negative but the negative amount is lower than the normal case.
The cash outflow of the project has been lowered due to the improved number of units and
the reduced variable cost of the project. In case of worst scenario, it has been found that the
net present value of the business is quite negative and explains that the cash outflow of the
company is higher than the cash inflow of the project (Kaplan and Atkinson, 2015).
So, basically, it has been found that the management should not make investment into
the project as it would lead to the company towards huge losses. Whether the scenario is best,
normal or worst, the project would not offer better return to the organization and thus it must
not be focused by the organization.
Part D: Recommendation:
Being a financial analyst, it is recommended to the Bega cheese to not to invest into
the yogurt range due to the fact that this project would lead to the company towards huge
losses. The capital budgeting technique has been applied on the project to measure the total
profit from the project and it has been found that even in the best case scenario, the project
would offer huge losses to the Bega Cheese limited and thus, the management of the
company must not focus on the project and must invest the amount in the project from where
better returns could be achieved. Further, it has also recommended to the business that if the
sales unit of the business improves along with the less variable cost than the project could be
profitable for the company. Till that time, the project is not a good option for the company in
order to make the investment.

References:
Gapenski, L.C., 2008. Healthcare finance: an introduction to accounting and financial
management. Health Administration Press.
Higgins, R. C., 2012. Analysis for financial management. McGraw-Hill/Irwin.
Kaplan, R.S. and Atkinson, A.A., 2015. Advanced management accounting. PHI Learning.
Lord, B.R., 2007. Strategic management accounting. Issues in Management Accounting, 3.
Lumby,S and Jones,C,.2007. Corporate finance theory & practice, 7th edition, Thomson,
London.
⊘ This is a preview!⊘
Do you want full access?
Subscribe today to unlock all pages.

Trusted by 1+ million students worldwide

Appendix:
Calculation of cash inflows
Particulars Year 1 Year 2 Year 3
Units (A) 1,250,000 1,250,000 1,250,000
Selling price (B) $1.25 $1.25 $1.25
Sales (C = A*B) $1,562,500.00 $1,562,500.00 $1,562,500.00
Less: Variable cost (0.24/unit )
9D) 300000 300000 300000
Contribution (E= C-D) $1,262,500.00 $1,262,500.00 $1,262,500.00
Less: Fixed cost (F) 250,000 250,000 250,000
Profit (G = E-F) $1,012,500.00 $1,012,500.00 $1,012,500.00
Less: Depreciation (H) $1,000,000.00 $1,000,000.00 $1,000,000.00
Profit before tax (I = G-H) $12,500.00 $12,500.00 $12,500.00
Less: tax @ 34% (J) $4,250.00 $4,250.00 $4,250.00
Profit after tax (K =I-J) $8,250.00 $8,250.00 $8,250.00
ADD: Depreciation (L) $1,000,000.00 $1,000,000.00 $1,000,000.00
ADD: terminal value 198000
Free cash flows $1,008,250.00 $1,008,250.00 $1,206,250.00
I - Best case scenario
Particulars Year 1 Year 2 Yea
Units (A) 2,500,000 2,500,000
Selling price (B) $1.24 $1.24
Sales (C = A*B) $3,100,000.00 $3,100,000.00 $3,1
Less: Variable cost (0.24/unit ) 9D) 550000 550000
Contribution (E= C-D) $2,550,000.00 $2,550,000.00 $2,5
Less: Fixed cost (F) 250,000 250,000
Profit (G = E-F) $2,300,000.00 $2,300,000.00 $2,3
Less: Depreciation (H) $1,000,000.00 $1,000,000.00
Profit before tax (I = G-H) $1,300,000.00 $1,300,000.00 $2,3
Less: tax @ 34% (J) $442,000.00 $442,000.00 $7
Profit after tax (K =I-J) $858,000.00 $858,000.00 $1,5
ADD: Depreciation (L) $1,000,000.00 $1,000,000.00
ADD: terminal value
Free cash flows $1,858,000.00 $1,858,000.00 $1,7
Calculation of NPV
Years Cash flows (A)
PVF @ 14%
(B)
Present values
(A*B)
Paraphrase This Document
Need a fresh take? Get an instant paraphrase of this document with our AI Paraphraser

0 -$ 3,000,000.00 1 -$ 3,000,000.00
1 $1,858,000.00 0.46729 $ 868,224.30
2 $1,858,000.00 0.21836 $ 405,712.29
3 $1,716,000.00 0.102037 $ 175,095.89
NPV -$ 1,550,967.52
II - Worst case scenario
Particulars Year 1 Year 2 Yea
Units (A) 950,000 950,000
Selling price (B) $1.32 $1.32
Sales (C = A*B) $1,254,000.00 $1,254,000.00 $1,2
Less: Variable cost (0.24/unit ) 9D) 256500 256500
Contribution (E= C-D) $997,500.00 $997,500.00 $9
Less: Fixed cost (F) 250,000 250,000
Profit (G = E-F) $747,500.00 $747,500.00 $7
Less: Depreciation (H) $1,000,000.00 $1,000,000.00
Profit before tax (I = G-H) -$252,500.00 -$252,500.00 $7
Less: tax @ 34% (J) -$85,850.00 -$85,850.00 $2
Profit after tax (K =I-J) -$166,650.00 -$166,650.00 $4
ADD: Depreciation (L) $1,000,000.00 $1,000,000.00
ADD: terminal value
Free cash flows $833,350.00 $833,350.00 $6
Calculation of NPV
Years Cash flows (A)
PVF @ 14%
(B)
Present values
(A*B)
0 -$ 3,000,000.00 1 -$ 3,000,000.00
1 $833,350.00 0.46729 $ 389,415.89
2 $833,350.00 0.21836 $ 181,970.04
3 $691,350.00 0.102037 $ 70,543.44
NPV -$ 2,358,070.63
Summary
Normal scenario Best scenario
Worst
Scenario
Net present value
-$
1,550,967.52
-$
2,358,070.63
1 out of 8
Related Documents

Your All-in-One AI-Powered Toolkit for Academic Success.
 +13062052269
info@desklib.com
Available 24*7 on WhatsApp / Email
Unlock your academic potential
Copyright © 2020–2025 A2Z Services. All Rights Reserved. Developed and managed by ZUCOL.