Corporate Finance Assignment: Risk, Return, and Capital Structure
VerifiedAdded on 2021/04/21
|14
|3138
|53
Homework Assignment
AI Summary
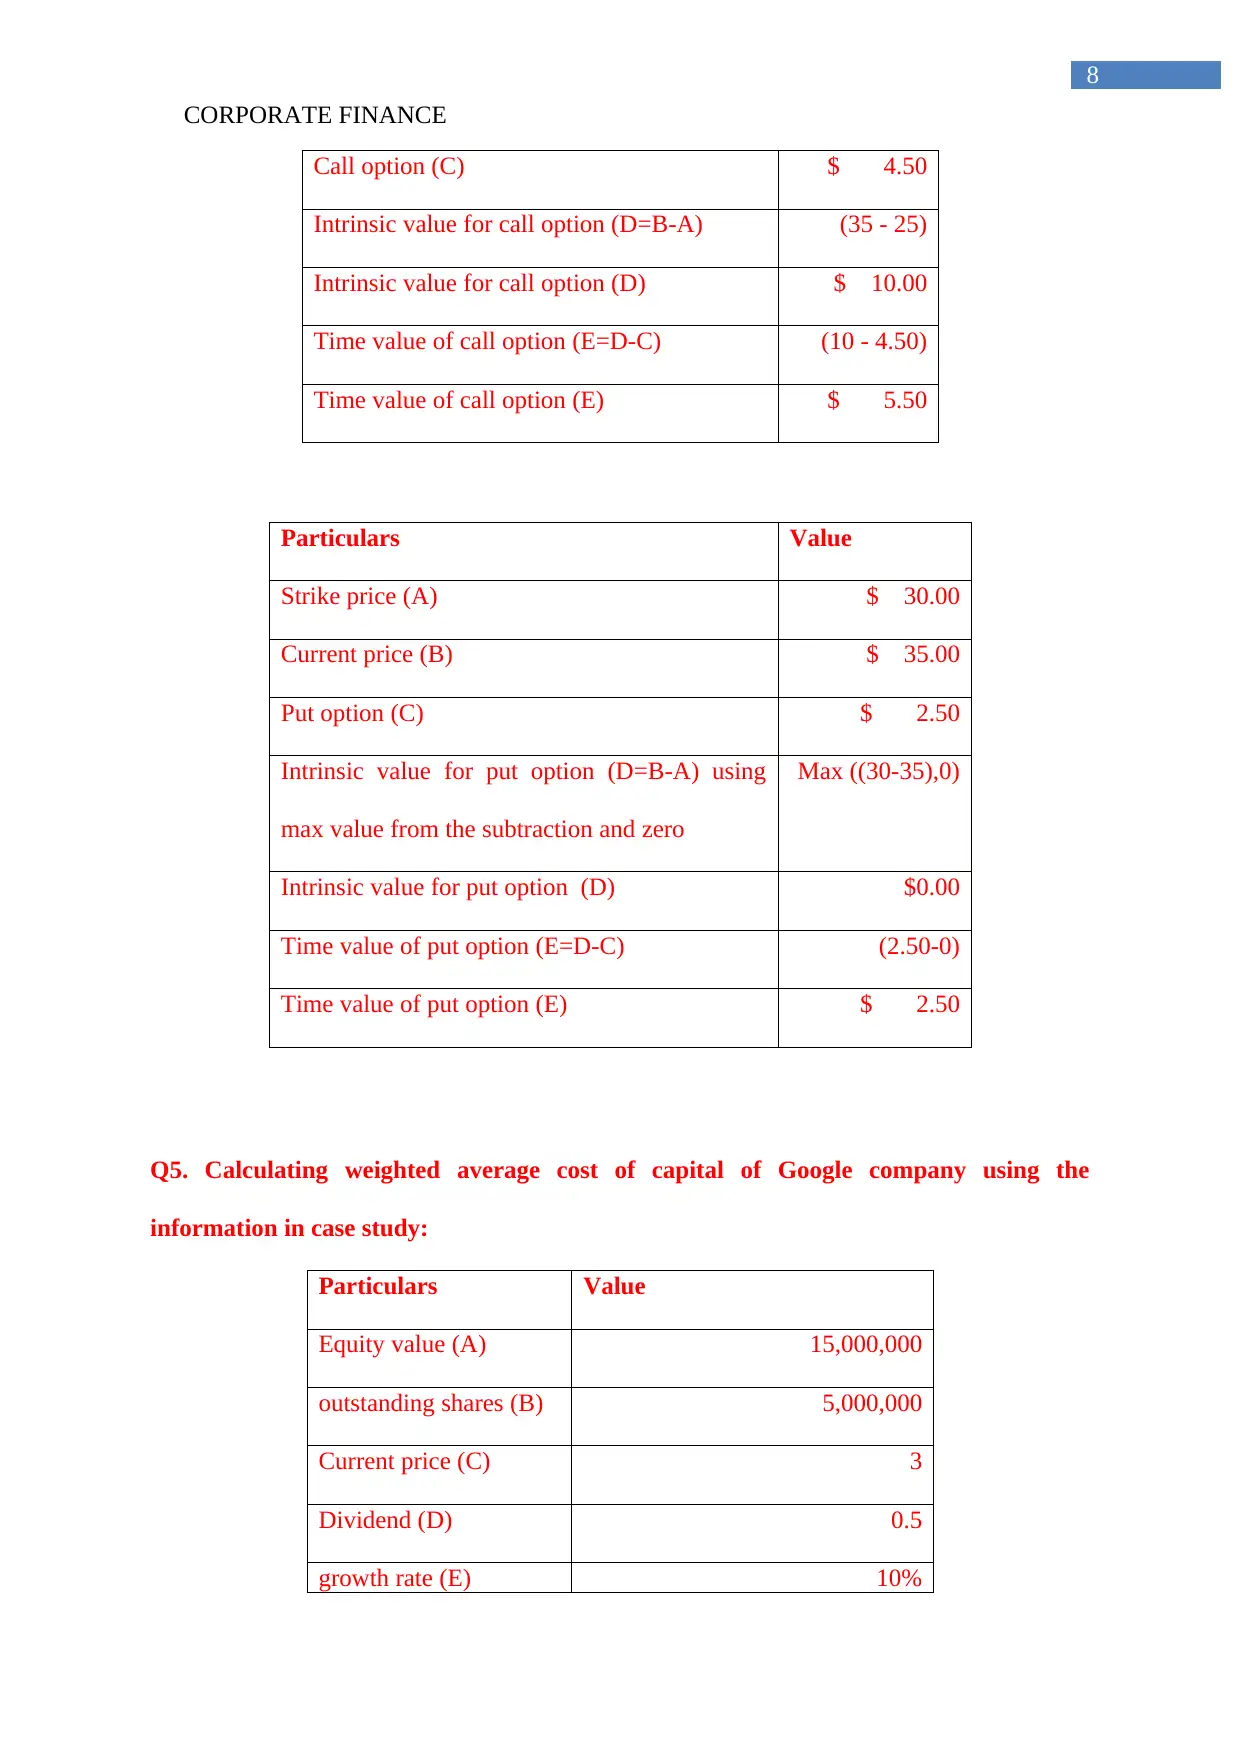
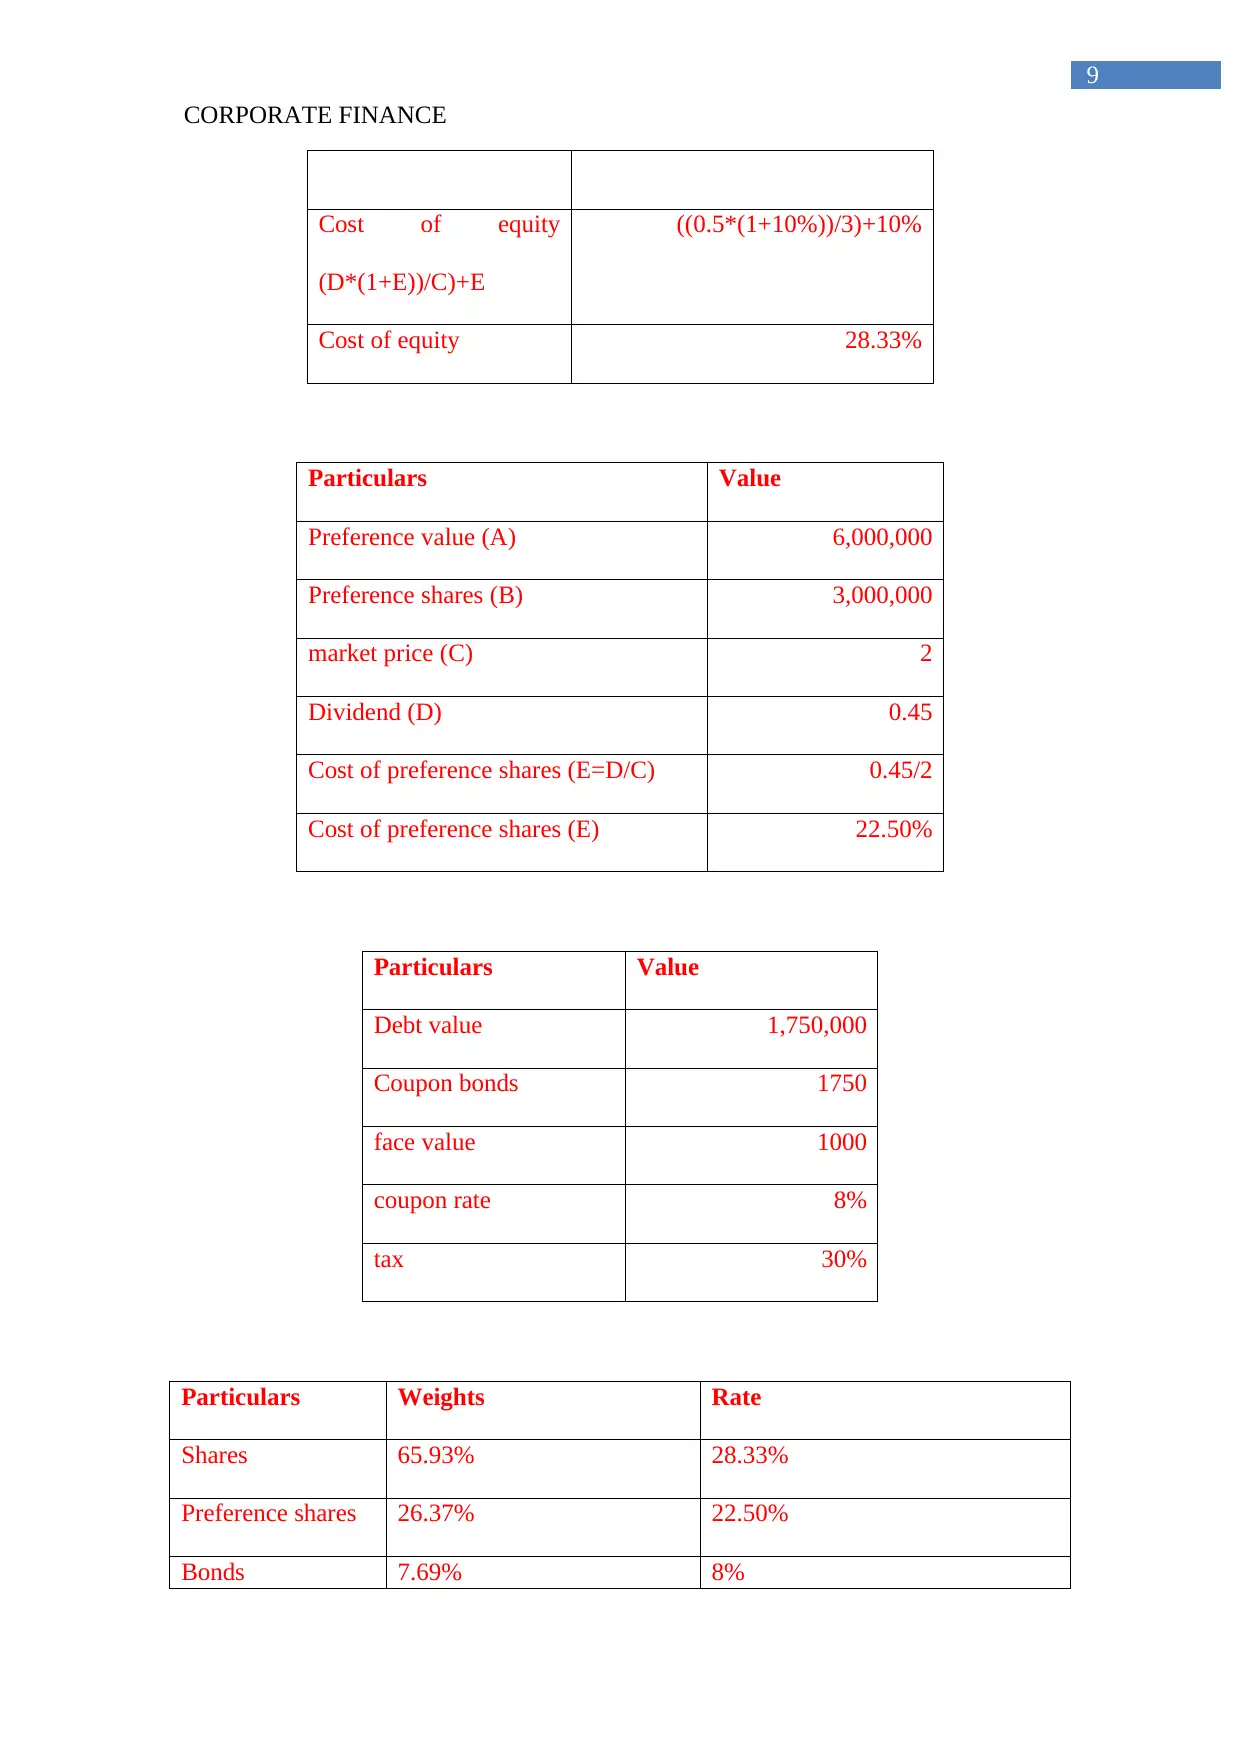
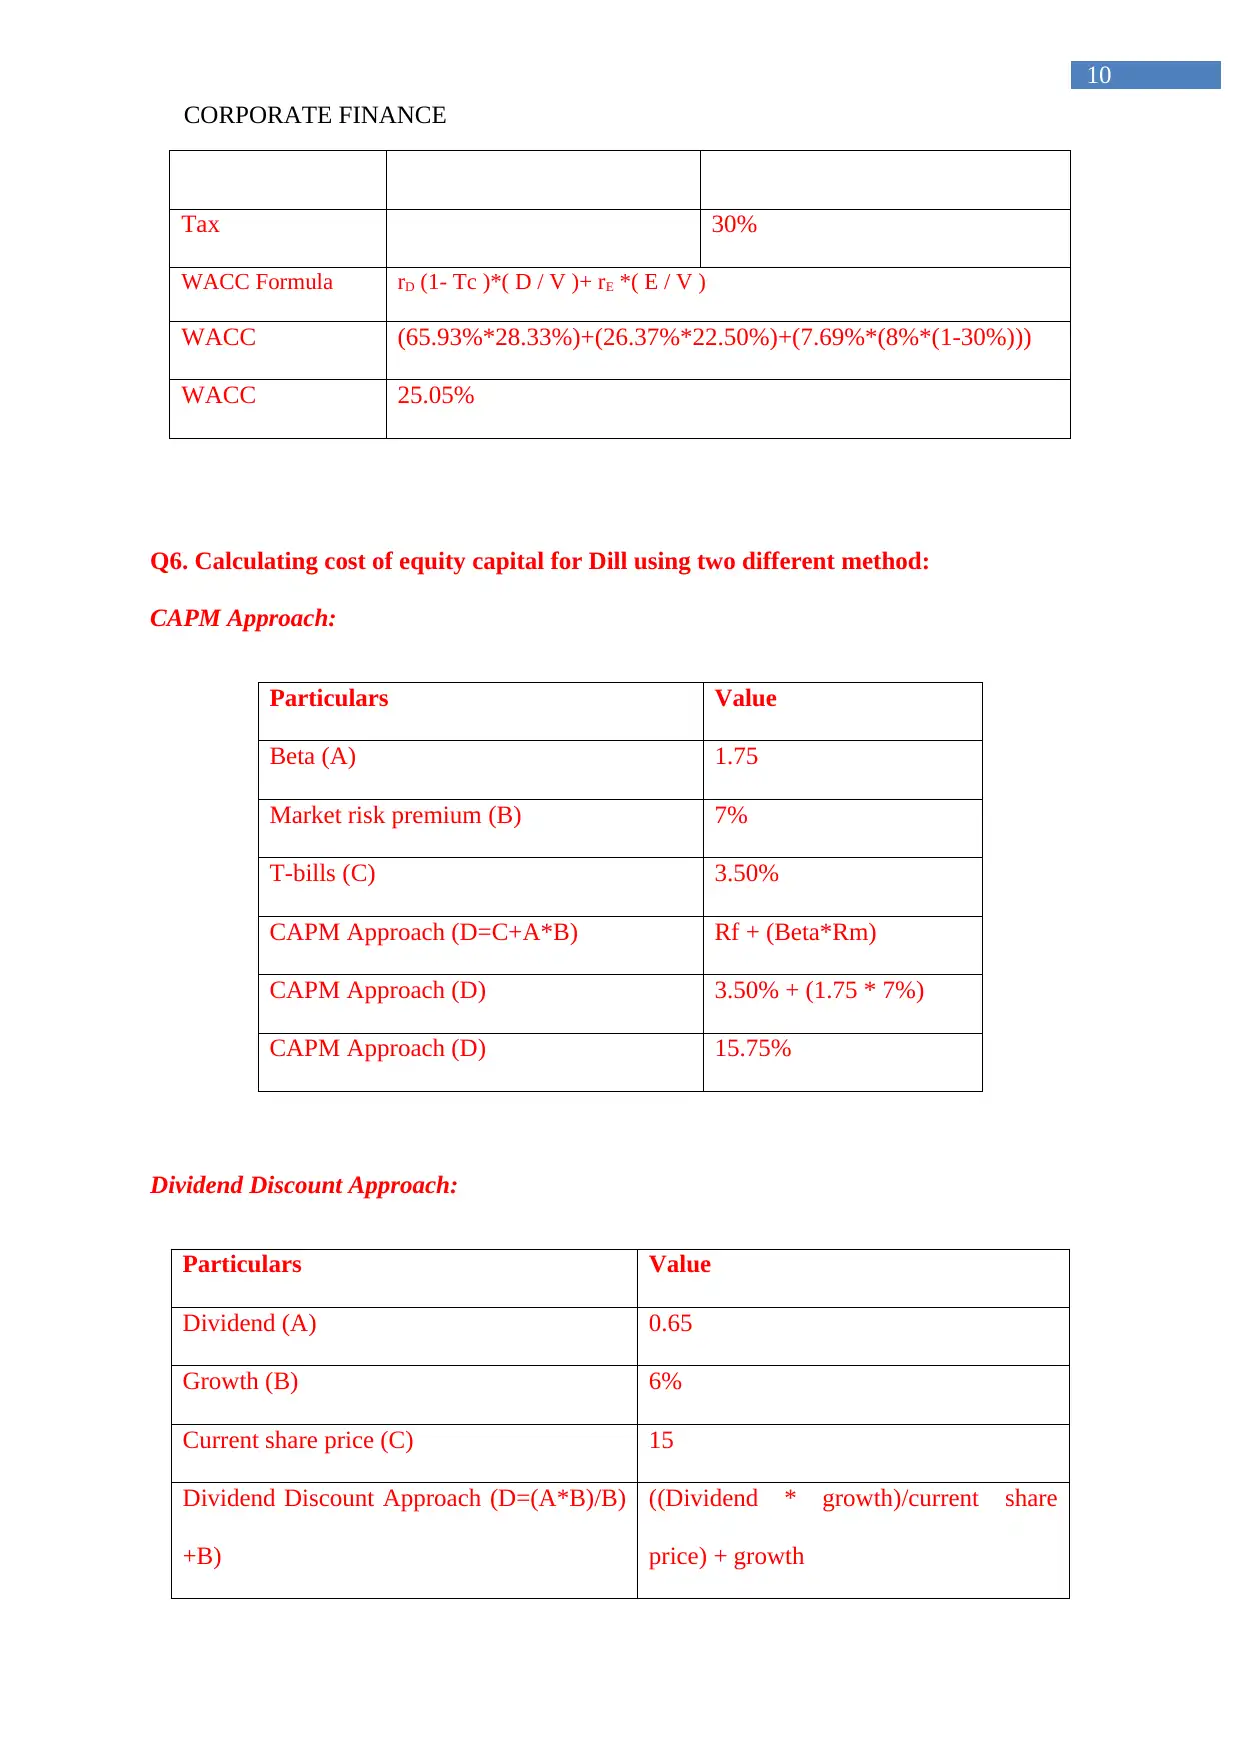
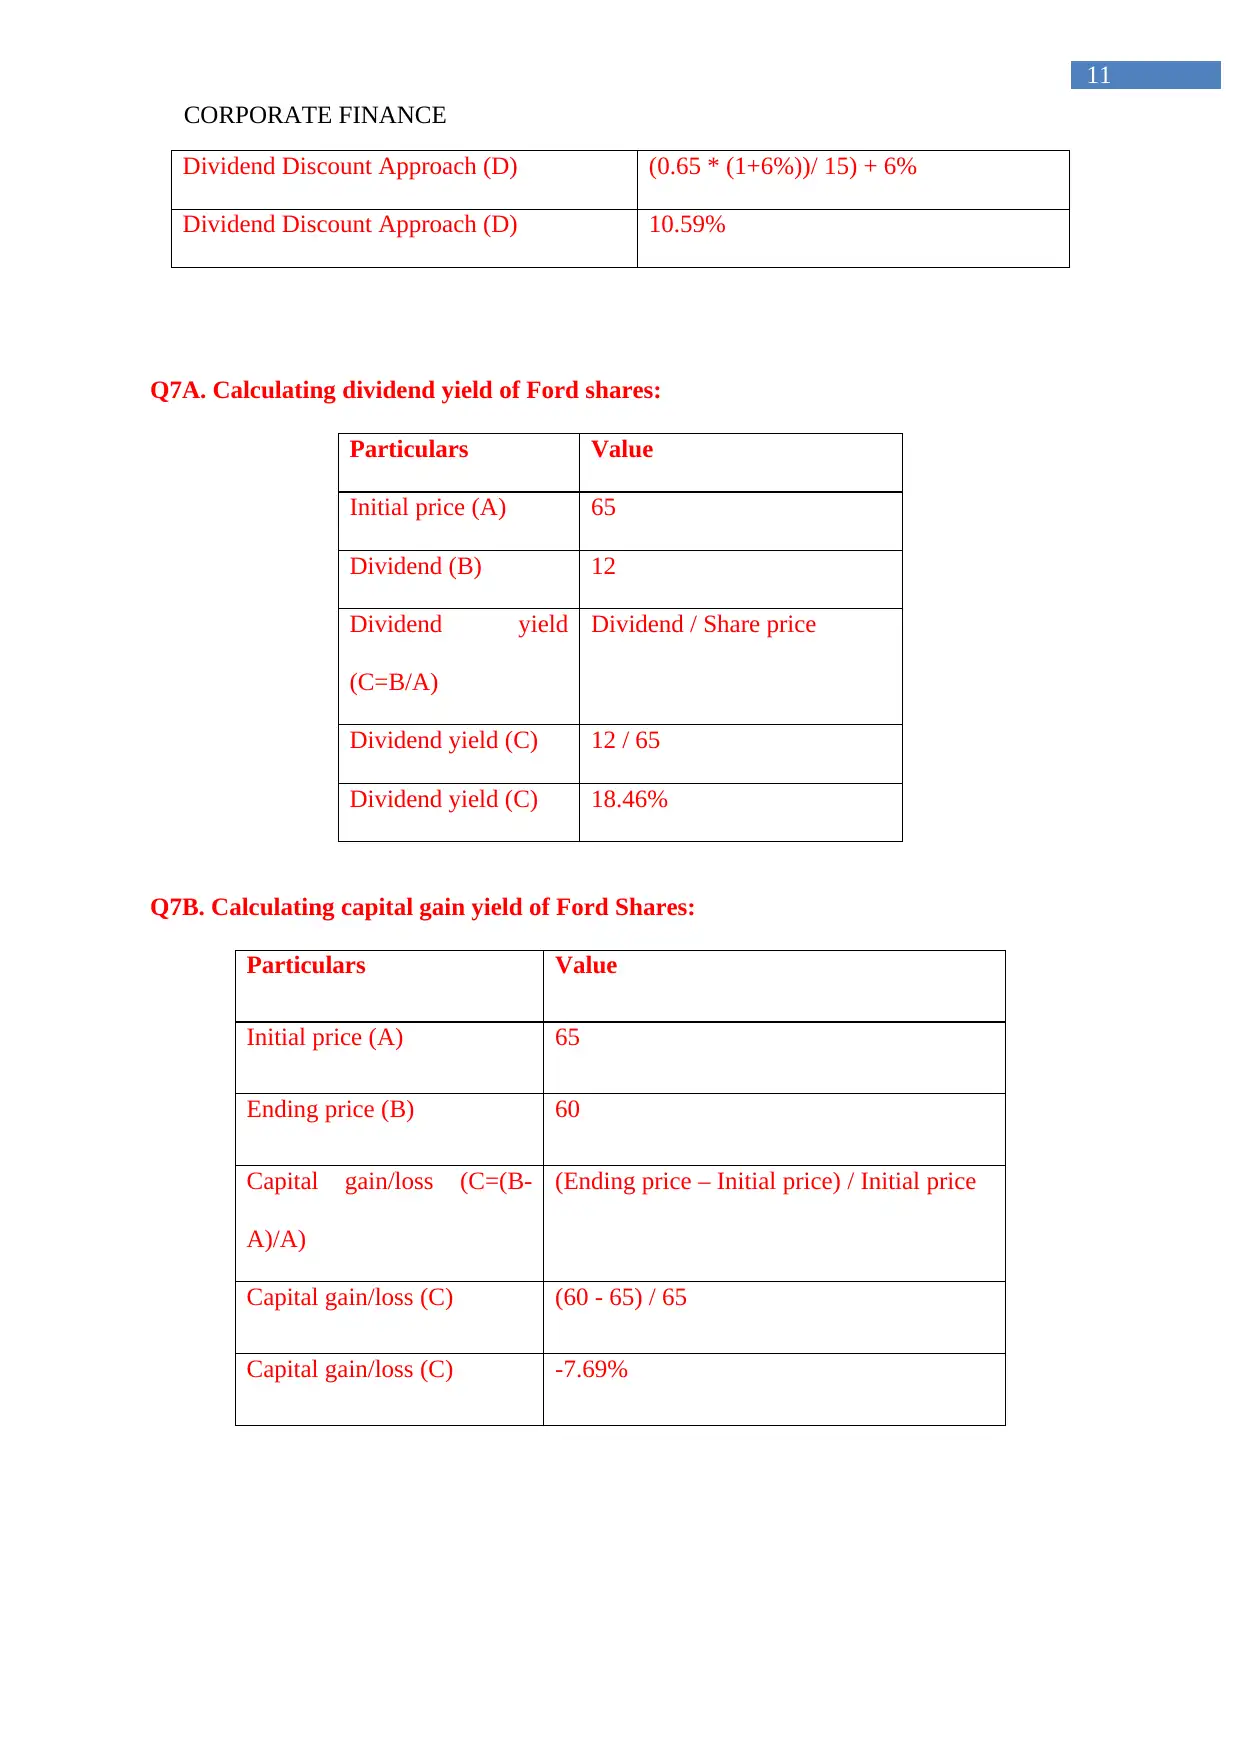
This corporate finance assignment comprehensively addresses key concepts in financial management. It begins by examining factors influencing option premiums, differentiating between various derivative types (futures, forwards, options, and swaps), and contrasting American and European options. The assignment then delves into optimal capital structure, illustrating it with a graph, and explains the Capital Asset Pricing Model (CAPM) through a graphical representation. Furthermore, the assignment explores the residual-dividend theory and the expectations theory of dividend policy. It proceeds to analyze call and put options, determining whether they are in-the-money, at-the-money, or out-of-the-money, and calculating their exercise and time values. The assignment also involves calculating the weighted average cost of capital (WACC) for Google and the cost of equity for Dill using two distinct methods (CAPM and dividend discount model). Finally, it calculates dividend and capital gain yields for Ford shares and discusses the benefits of diversification for investors, including the key factors that determine the extent of these benefits. The assignment utilizes graphs, tables, and calculations to provide detailed explanations and analyses.

Running head: CORPORATE FINANCE
Corporate Finance
Name of the Student:
Name of the University:
Authors Note:
Corporate Finance
Name of the Student:
Name of the University:
Authors Note:
Paraphrase This Document
Need a fresh take? Get an instant paraphrase of this document with our AI Paraphraser

CORPORATE FINANCE
1
Table of Contents
Q1A. Five factors that affect option premium:..........................................................................2
Q1B. Explaining three types of derivatives:..............................................................................2
Q1C. Explaining the difference between American and European options:.............................3
Q2A. Depicting an optimal capital structure with graph:..........................................................4
Q2B. Explaining CAPM with graph:.........................................................................................5
Q3A. Explaining residual-dividend theory:...............................................................................5
Q3B. Explaining expectations theory:.......................................................................................6
Q4A. Depicting whether call and out option is in the money, at the money or out of the
money:........................................................................................................................................6
Q4B. Calculating the exercise price of each of the call and put option:....................................7
Q4C. Depicting what is time value of each put and call option:................................................7
Q5. Calculating weighted average cost of capital of Google company using the information in
case study:..................................................................................................................................8
Q6. Calculating cost of equity capital for Dill using two different method:............................10
Q7A. Calculating dividend yield of Ford shares:.....................................................................11
Q7B. Calculating capital gain yield of Ford Shares:................................................................11
Q8. Benefits of diversification to an investor and stating the key factor determining the extent
of these benefits:......................................................................................................................12
Reference and Bibliography:....................................................................................................13

CORPORATE FINANCE
2
Q1A. Five factors that affect option premium:
There are relatively five factors, which affects the pricing and premium of option,
which are strike price, type of option, time to expiration, interest rate and volatility. The
above depicted factors mainly help in identifying the premiums of an option, which needs to
be paid by the investors for conducting the trade. The use of strike price is essential, as it
marks the overall change in prices, which can affect the actual profitability of the company.
In addition, the type of option such as call and put mainly needs relevant calculation, which
derives the actual premium of the option. The expiration date and interest rates is also
calculated to derive the current premiums of the options, as needed by the formulation
mentioned in Black Scholes. Lastly, the volatility or beta is calculated to derive the overall
risk involved in the trade. The higher beta will increase the premiums will be for the tid and
vice versa (Wilmott and Orrell 2017).
Q1B. Explaining three types of derivatives:
There are three types of derivatives, which is used by investor to hedge and conduct
trades. The three types of derivatives are future & forward contract, Option contract and
swaps, which privies adequate leverage to the investors for conducing relevant trades. The
future & forward contract is mainly used in fixings loses, which might incur in future due to
the change in prices. The oil and fuel sector mainly use forward and future contracts for
reducing the negative impact of volatile crude prices. In addition, the option contract are
more complex and prudent, which allow the companies to increase their leverage without
actually opting for the purchase of the contract (Hull and Basu 2016). The last derivative
option is swap, which allows the investor to use complex methods in betting for and against
the trend. The derivative contract such as swaps was the main reason behind the collapse of
financial market in 2008.
⊘ This is a preview!⊘
Do you want full access?
Subscribe today to unlock all pages.

Trusted by 1+ million students worldwide

CORPORATE FINANCE
3
Q1C. Explaining the difference between American and European options:
The difference between both the American and Europeans options mainly provide
adequate levels, which help investor in making adequate trades that could hedge their
exposure in the market (Liu, Chen and Ralescu 2015). The Americana and European options
differ in may stances, which are depicted in the table below.
Types of difference Americana Options European Options
Underlying Asset Optionable stocks and
exchange traded funds mainly
American style option for
trading
Major broad-based indices
mainly trade in European style
options such as S&P 500
The right to exercise American style option allows
the investor to exercise at any
time
European style option only
allows investor to exercise after
the expiration
Trading of index option American option stops trading
at the close of business on the
third Friday of the expiration
month
European option stops trading
one day before the expiration
date
Settlement price Settle price of the underlying
asset for American option is
the closing price of the trade
The detection of settle price for
the underlying asset cannot be
detected if the settlement price
is not published
Paraphrase This Document
Need a fresh take? Get an instant paraphrase of this document with our AI Paraphraser

CORPORATE FINANCE
4
Q2A. Depicting an optimal capital structure with graph:
Figure 1: Depicting the optimal capital structure curve
(Source: DeAngelo and Stulz 2015)
The above figure mainly depicts the overall optimal capital structure curve, which
could be used by companies to conduct their operations. In addition, the optimal capital
structure mainly indicates the best debt-to-equity ratio that needs to be maintained by the
firm. In addition, the optimal capital structure indicates the balance between the idyllic debt-
to-equity ranges, which minimises the overall cost of capital. Moreover, the firm with debt
debt-to-equity ratio maximises its value by the overall cost of firms

CORPORATE FINANCE
5
Q2B. Explaining CAPM with graph:
Figure 2: Depicting the CAPM figure
(Source: Suntraruk 2018)
The above graph malonyl depicts the overall CAPM models, which could be used by
the investor in detecting the overall expected return of stock. In addition, the graph indicates
the use of return and risk from market portfolio, which is conducted to detect the actual
expected return of the stock. In addition, the use of beta, market risk premium and risk-free
rate is conducted to derive the overall returns, which could be expected from a stock.
Barberis et al. (2015) argued that CAPM returns calculation does not provide the investor
with adequate expected return, which increases the risk from investment.
Q3A. Explaining residual-dividend theory:
With the use of residual dividend theory companies can utilise the entire income,
which is been generated to support their capital expenditure. In addition, the remaining
capital after the expense conducted on capital expenditure is mainly used for providing
⊘ This is a preview!⊘
Do you want full access?
Subscribe today to unlock all pages.

Trusted by 1+ million students worldwide

CORPORATE FINANCE
6
relevant dividends to the investor. In addition, with the use of capital expenditure companies
are mainly able to expand their current position and increase their profitability. Hoover, in the
current dividend policy method the company’s main aim is to use the relevant earnings for
the capital expenditure and conduct relevant cash outflows, while the dividends are paid with
the remaining income that is generated by the organisation. on the other hand, Baker and
Jabbouri (2016) argued that the nonfulfillment of the expected return from investment the
investor could discard the stock and hamper company’s stock value.
Q3B. Explaining expectations theory:
The unbiased expectation theory mainly indicates the need of dividend, which will be
needed by the company to maintain the level of returns from investment. In addition, the
theory suggest that market actions do not reflect response to the firm’s actions, while
investors also make the expectation regarding the ultimate decision made by the
management. Therefore, the amount of dividend paid by the company and the expected
dividend by investors need to be same. In addition, any non-collaboration between the
dividend paid and expected dividend would increase volatility in market price of the
company. Moreover, the market will aggressively react to the inconsistency of dividend
payment with the shareholders expectations. Dewri, Islam and Arifuzzaman (2015) argued
that with the adequate income companies are not able to follow the expectations theory of
divided policy for providing dividends to their shareholders.
Q4A. Depicting whether call and out option is in the money, at the money or out of the
money:
Particulars Value
Strike price (The price at which investment is conducted) $25
Paraphrase This Document
Need a fresh take? Get an instant paraphrase of this document with our AI Paraphraser

CORPORATE FINANCE
7
Current price (which is used in deriving the profits) $35
Call Option (The value at which each call option is bought) $4.50
Call Option is in the money as the strike price is higher than the current price of the
trade. The call option mainly requires the share price of the stock to increase the actual strike
price for detecting it to be in the money (Yang, Tang and Chen 2017).
Particulars Value
Strike price (The price at which investment is conducted) $30
Current price (which is used in deriving the profits) $35
Put option (The value at which each put option is bought) $2.50
Put option is consider dot be out of money, the current price of the stock is relatively
higher than the strike price. On the other hand, the put options requires the option to drop
down from the actual stock price, which is not in this case (Fishman and O'Rourke 2016).
Q4B. Calculating the exercise price of each of the call and put option:
Exercise price is mainly the price in which the option is being executed, whereas in
this case strike price of the options is exercise price. Hence, exercise price of the call option
is $25, while the exercise price of put option is $30.
Q4C. Depicting what is time value of each put and call option:
Particulars Value
Strike price (A) $ 25.00
Current price (B) $ 35.00

CORPORATE FINANCE
8
Call option (C) $ 4.50
Intrinsic value for call option (D=B-A) (35 - 25)
Intrinsic value for call option (D) $ 10.00
Time value of call option (E=D-C) (10 - 4.50)
Time value of call option (E) $ 5.50
Particulars Value
Strike price (A) $ 30.00
Current price (B) $ 35.00
Put option (C) $ 2.50
Intrinsic value for put option (D=B-A) using
max value from the subtraction and zero
Max ((30-35),0)
Intrinsic value for put option (D) $0.00
Time value of put option (E=D-C) (2.50-0)
Time value of put option (E) $ 2.50
Q5. Calculating weighted average cost of capital of Google company using the
information in case study:
Particulars Value
Equity value (A) 15,000,000
outstanding shares (B) 5,000,000
Current price (C) 3
Dividend (D) 0.5
growth rate (E) 10%
⊘ This is a preview!⊘
Do you want full access?
Subscribe today to unlock all pages.

Trusted by 1+ million students worldwide

CORPORATE FINANCE
9
Cost of equity
(D*(1+E))/C)+E
((0.5*(1+10%))/3)+10%
Cost of equity 28.33%
Particulars Value
Preference value (A) 6,000,000
Preference shares (B) 3,000,000
market price (C) 2
Dividend (D) 0.45
Cost of preference shares (E=D/C) 0.45/2
Cost of preference shares (E) 22.50%
Particulars Value
Debt value 1,750,000
Coupon bonds 1750
face value 1000
coupon rate 8%
tax 30%
Particulars Weights Rate
Shares 65.93% 28.33%
Preference shares 26.37% 22.50%
Bonds 7.69% 8%
Paraphrase This Document
Need a fresh take? Get an instant paraphrase of this document with our AI Paraphraser

CORPORATE FINANCE
10
Tax 30%
WACC Formula rD (1- Tc )*( D / V )+ rE *( E / V )
WACC (65.93%*28.33%)+(26.37%*22.50%)+(7.69%*(8%*(1-30%)))
WACC 25.05%
Q6. Calculating cost of equity capital for Dill using two different method:
CAPM Approach:
Particulars Value
Beta (A) 1.75
Market risk premium (B) 7%
T-bills (C) 3.50%
CAPM Approach (D=C+A*B) Rf + (Beta*Rm)
CAPM Approach (D) 3.50% + (1.75 * 7%)
CAPM Approach (D) 15.75%
Dividend Discount Approach:
Particulars Value
Dividend (A) 0.65
Growth (B) 6%
Current share price (C) 15
Dividend Discount Approach (D=(A*B)/B)
+B)
((Dividend * growth)/current share
price) + growth

CORPORATE FINANCE
11
Dividend Discount Approach (D) (0.65 * (1+6%))/ 15) + 6%
Dividend Discount Approach (D) 10.59%
Q7A. Calculating dividend yield of Ford shares:
Particulars Value
Initial price (A) 65
Dividend (B) 12
Dividend yield
(C=B/A)
Dividend / Share price
Dividend yield (C) 12 / 65
Dividend yield (C) 18.46%
Q7B. Calculating capital gain yield of Ford Shares:
Particulars Value
Initial price (A) 65
Ending price (B) 60
Capital gain/loss (C=(B-
A)/A)
(Ending price – Initial price) / Initial price
Capital gain/loss (C) (60 - 65) / 65
Capital gain/loss (C) -7.69%
⊘ This is a preview!⊘
Do you want full access?
Subscribe today to unlock all pages.

Trusted by 1+ million students worldwide
1 out of 14
Related Documents
Your All-in-One AI-Powered Toolkit for Academic Success.
+13062052269
info@desklib.com
Available 24*7 on WhatsApp / Email
Unlock your academic potential
Copyright © 2020–2026 A2Z Services. All Rights Reserved. Developed and managed by ZUCOL.


