Corporate Finance Case Study: Investment Project Ranking and Selection
VerifiedAdded on 2021/07/20
|6
|1232
|112
Case Study
AI Summary
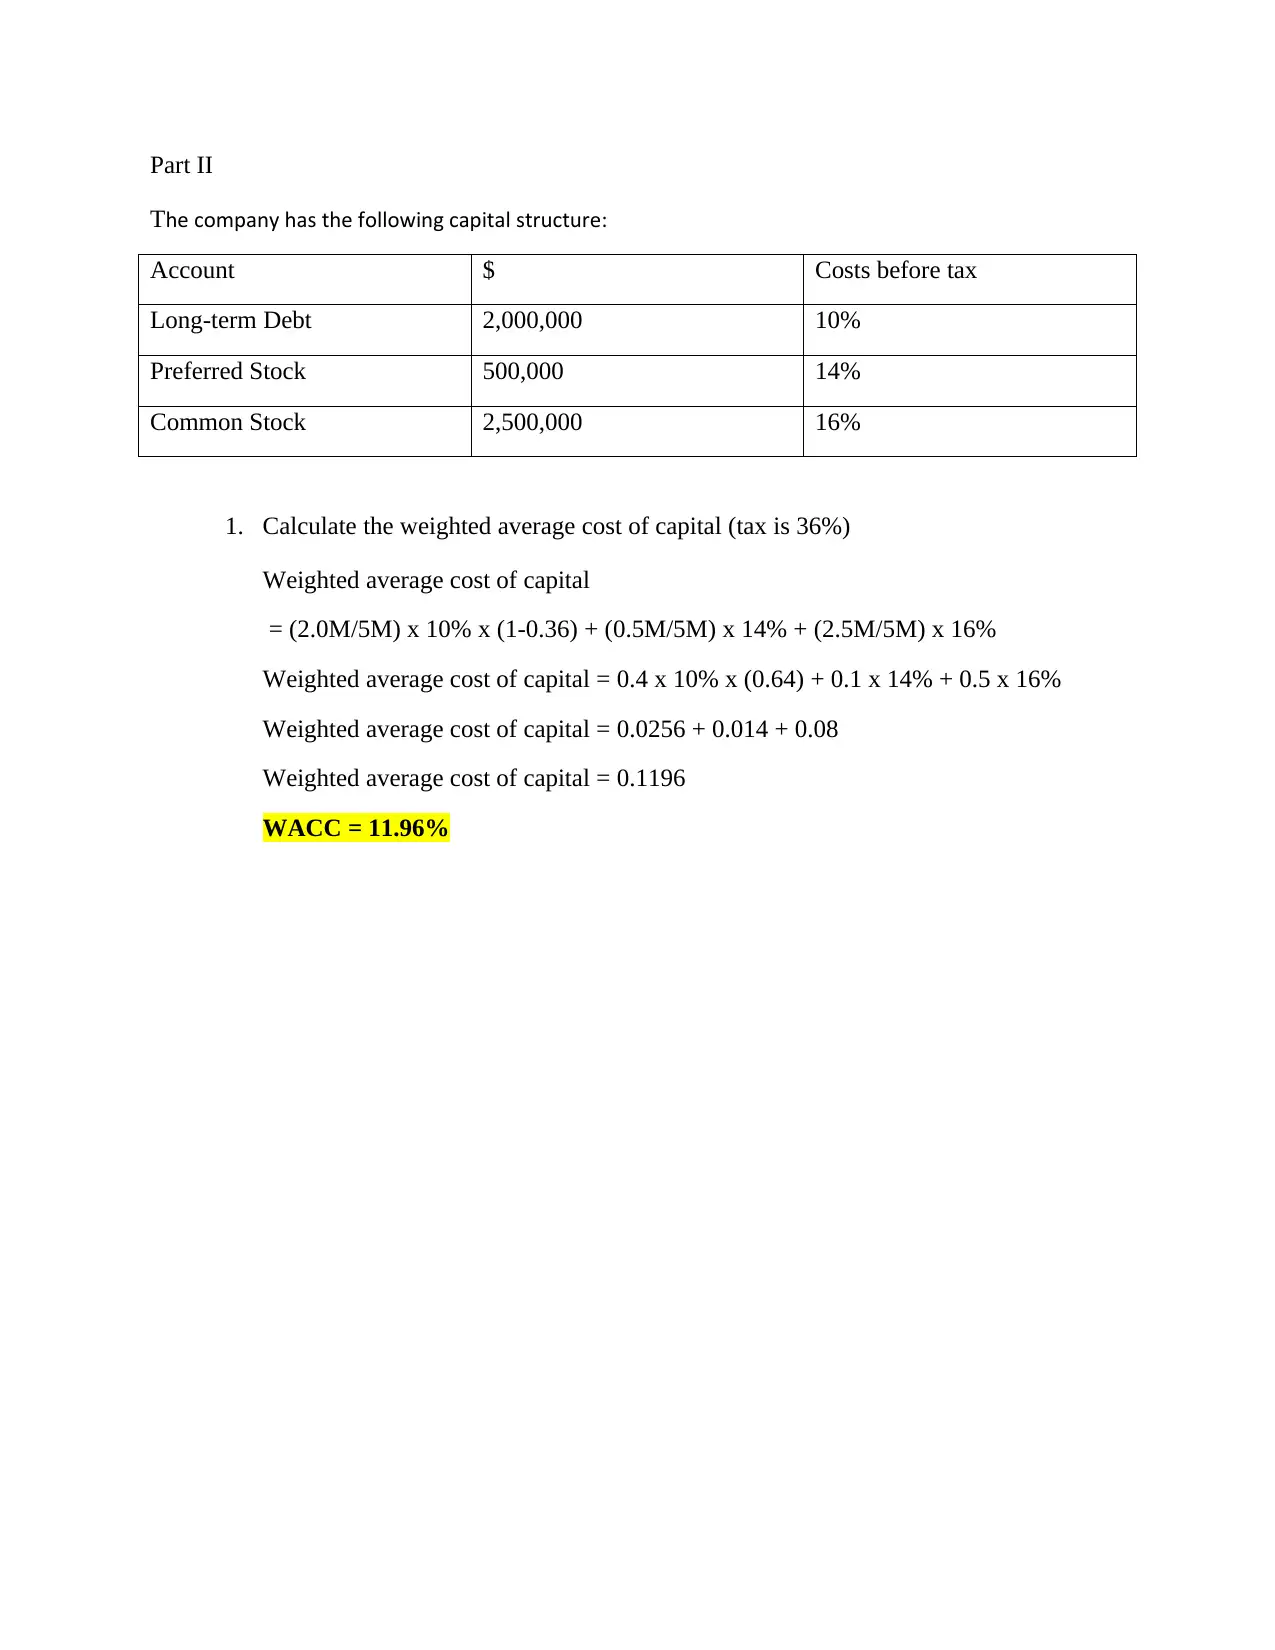
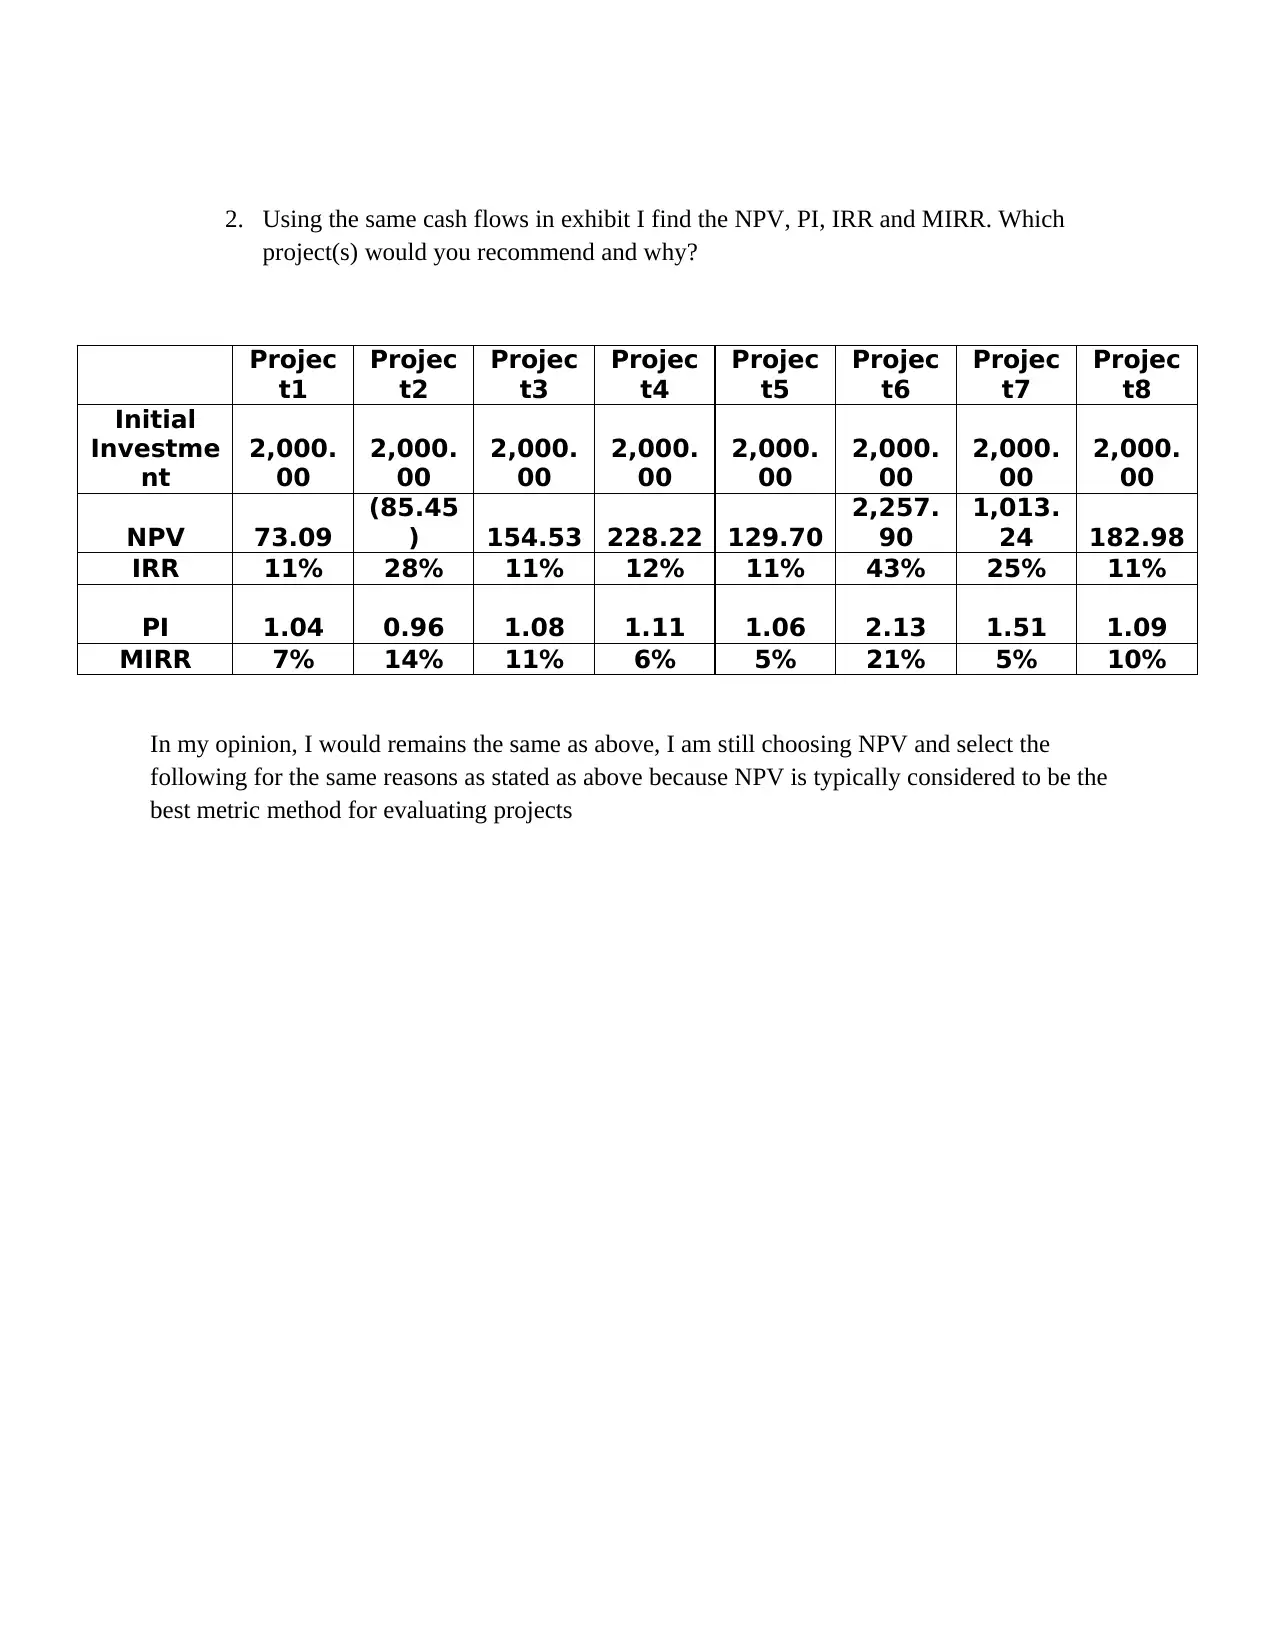
This case study delves into corporate finance, focusing on capital budgeting and resource allocation through investment project analysis. The assignment requires ranking eight investment projects based on quantitative considerations, including NPV, IRR, and payback period, while also addressing ...

SUBJECT CODE :
SUBJECT TITLE : CORPORATE FINANCE
c LEVEL : MASTER’S LEVEL
STUDENT’S NAME :
ID NO. :
PROGRAMME :
LECTURER :
LEARNING CENTRE :
SUBJECT TITLE : CORPORATE FINANCE
c LEVEL : MASTER’S LEVEL
STUDENT’S NAME :
ID NO. :
PROGRAMME :
LECTURER :
LEARNING CENTRE :
Paraphrase This Document
Need a fresh take? Get an instant paraphrase of this document with our AI Paraphraser

CASE STUDY
Choosing the best investment.
The essence of capital budgeting and resource allocation is a search for good investments in
which to place the firm’s capital. The process can be simple when viewed in purely mechanical
terms, but a number of subtle issues can obscure the best investment choices. The capital
budgeting analyst is necessarily, therefore, a detective who must winnow good evidence from
bad. Much of the challenges is knowing what quantitative analysis to generate in the first place.
Supposed you are a new capital budgeting analyst for a company considering investments in the
eight projects listed in Exhibit 1. The chief financial officer of your company has asked you to
rank the projects and recommend the “four best” that the company should accept.
Part I
For the first part of this assignment only quantitative considerations are relevant. No other
project characteristics are deciding factors in the selection, except that management has
determined that projects 7 and 8 are mutually exclusive.
All projects require the same initial investment, $2,000,000. Moreover, all are believed to be of
the same risk class. The weighted average cost of capital for the first part is 10%. To simulate
your analysis, consider the following questions:
1. Can you rank the projects simply by inspecting the cash flows?
In my opinion, the projects can’t be ranked just simply by inspecting the cash flows. In order to
rank the projects we must bring all cash flows to the same point in time (present) before we can
even compare. This must be done first because of time value of money. If a dollar is received
now it is more valuable than a dollar that would be received sometime in the near future. In
saying that the cash flows must be brought to present before we can even start to rank the
projects

2. What criteria might you use to rank the projects? Which quantitative ranking
methods are better? Why?
Looking at the projects there are several criteria that can be used to rank the projects, such as
using the projects IRR, Payback period and NPV. NPV results in the best ranking because IRR
only works if there is a series of cash flows that shows results in an initial outlay followed by
future inlay. Any sequence of cash flows that does not support this, will not yield accurate results
with the IRR method. Also, IRR just gives a percentage, which will ignore the magnitude of cash
flows. Payback period plainly ignores the time value of money, which is considered to be a
major flaw of this methodology. All of the drawbacks of IRR and Payback period, NPV is
usually the best method for capital budgeting
As a result, when we need to accept or reject a project, always we need to considering all the risk
of the projects. Most companies use type one and type tow error to accept or reject the projects.
However, the NPV is the primarily method and most experienced manager use it in real life
because it addresses directly to the central goal of financial management which is maximizing
shareholder wealth.
3. What is the ranking you found by using quantitative methods? Does this ranking
differ from the ranking obtained by simple inspection of the cash flows?
The rankings that I found by using the quantitative methods are as followed:
Projects ranked by using NPV methods
1) Project 6 2) Project 7 3) Project 4 4) Project 8
Yes this ranking does differ from the ranking that is obtained by simple inspection of the cash
flows Projects are ranked as followed
1) Project 3 2) Project 2 3) Project 6 4) Project 7
You're viewing a preview
Unlock full access by subscribing today!

4. What kinds of real investment projects have cash flows similar to those in the
exhibit?
Project 1 is mostly similar to the investment in a coupon bond, where you are able to get
coupon payments periodically at the end of the period when you get the principal.
Project 2 and 6 are most likely like the actual venture capital project where bulks of cash
inflows occurs at the end while some of the cash inflows takes place at the beginning.
Project 3 is related to the zero coupon bond where you can purchase the bond at a
specific price and you receive an big cash outflow at the end of the maturity period.
The following Projects 4,7 and 8 are closely similar to an investment in a machinery,
which generates positive cash for you for a certain period of time. After awhile, you can
sell that off and receive some more cash. There might be some additional cash outflows
initially to get the machinery going. Project 5 is similar to annuity.
Paraphrase This Document
Need a fresh take? Get an instant paraphrase of this document with our AI Paraphraser

Part II
The company has the following capital structure:
Account $ Costs before tax
Long-term Debt 2,000,000 10%
Preferred Stock 500,000 14%
Common Stock 2,500,000 16%
1. Calculate the weighted average cost of capital (tax is 36%)
Weighted average cost of capital
= (2.0M/5M) x 10% x (1-0.36) + (0.5M/5M) x 14% + (2.5M/5M) x 16%
Weighted average cost of capital = 0.4 x 10% x (0.64) + 0.1 x 14% + 0.5 x 16%
Weighted average cost of capital = 0.0256 + 0.014 + 0.08
Weighted average cost of capital = 0.1196
WACC = 11.96%

2. Using the same cash flows in exhibit I find the NPV, PI, IRR and MIRR. Which
project(s) would you recommend and why?
Projec
t1
Projec
t2
Projec
t3
Projec
t4
Projec
t5
Projec
t6
Projec
t7
Projec
t8
Initial
Investme
nt
2,000.
00
2,000.
00
2,000.
00
2,000.
00
2,000.
00
2,000.
00
2,000.
00
2,000.
00
NPV 73.09
(85.45
) 154.53 228.22 129.70
2,257.
90
1,013.
24 182.98
IRR 11% 28% 11% 12% 11% 43% 25% 11%
PI 1.04 0.96 1.08 1.11 1.06 2.13 1.51 1.09
MIRR 7% 14% 11% 6% 5% 21% 5% 10%
In my opinion, I would remains the same as above, I am still choosing NPV and select the
following for the same reasons as stated as above because NPV is typically considered to be the
best metric method for evaluating projects
You're viewing a preview
Unlock full access by subscribing today!
1 out of 6
Related Documents

Your All-in-One AI-Powered Toolkit for Academic Success.
+13062052269
info@desklib.com
Available 24*7 on WhatsApp / Email
Unlock your academic potential
© 2024 | Zucol Services PVT LTD | All rights reserved.