Corporate Finance Decision Making
VerifiedAdded on 2019/12/03
|14
|2774
|29
Report
AI Summary
This report provides a comprehensive analysis of corporate finance and decision-making for General Sportswear, a private limited company facing liquidity issues. It examines various sources of finance (long-term and short-term), analyzes the cost implications of different financing options, and assesses the financial information needs of key stakeholders (shareholders, suppliers, and customers). The report includes a detailed cash budget, unit cost calculations for products, and project appraisal using payback period, net present value, and accounting rate of return methods. Furthermore, it compares the formats of financial statements for different business structures (manufacturer, sole trader, limited company) and interprets financial performance using ratio analysis, including return on capital employed, total asset turnover, gross profit ratio, net profit ratio, current ratio, quick ratio, inventory holding period, debtor's collection period, creditor's payment period, and debt-to-equity ratio. The analysis reveals that while the company generates a relatively high return on capital employed, its high debt-to-equity ratio poses a potential risk. The report concludes by emphasizing the importance of effective financial planning and cost control for improved business performance.

Corporate finance and
decision making
decision making
Paraphrase This Document
Need a fresh take? Get an instant paraphrase of this document with our AI Paraphraser
TABLE OF CONTENTS
INTRODUCTION...........................................................................................................................3
TASK 1............................................................................................................................................3
1.1 Sources of finance .................................................................................................................3
1.2 Implication of sources of finance...........................................................................................3
1.3Appropriate sources of finance...............................................................................................3
TASK 2............................................................................................................................................4
2.1 Analyze cost of different sources of finance..........................................................................4
2.2 Importance of finance planning.............................................................................................4
2.3 Assessing financial information needs of three main decision makers................................4
2.4 Impact of finance on financial statement...............................................................................5
TASK 3............................................................................................................................................5
3.1 Preparing cash budget............................................................................................................5
3.2 Unit cost of products..............................................................................................................5
3.3 Calculating cost of each project.............................................................................................6
TASK 4............................................................................................................................................7
4.1 Main financial statements......................................................................................................7
4.2 Compare appropriate formats of financial statements...........................................................7
4.3 Interpreting financial statements using ratio analysis..........................................................10
CONCLUSION..............................................................................................................................11
REFERENCES..............................................................................................................................12
2
ILLUSTRATION INDEX
Illustration 1: Income statement of manufacturer............................................................................8
Illustration 2: Income statement for sole trader...............................................................................9
Illustration 3: Balance sheet of limited company..........................................................................10
INDEX OF TABLES
Table 1: Cash budget.......................................................................................................................6
Table 2: Unit cost of products..........................................................................................................6
Table 3: Payback period...................................................................................................................7
Table 4: Net present value of project 1 & 2.....................................................................................7
Table 5: ARR of project 1 & 2.........................................................................................................7
Table 6: Ratio analysis...................................................................................................................11
3
⊘ This is a preview!⊘
Do you want full access?
Subscribe today to unlock all pages.
Trusted by 1+ million students worldwide
INTRODUCTION
Management of financial resources is crucial task by which company integrate all
business activities in the direction of growth and success of the firm. Present report is based on
General Sportswear private limited company which deals in sportswear of leading brands.
Corporation is having issues related to liquidity crunch and heavy overdraft. In this regard
various cost effective sources of finance are mentioned in the report. Further, budgeting and
costing as effective techniques to control cash and increase profitability have been explained.
TASK 1
1.1 Sources of finance
There are following sources of finance available for General Sportswear-
Long term
The long term sources of finance consists of bank loan, leasing companies and hire
purchase. It aids to expand business and raise long term capital in the direction of growth and
success of the corporation.
Short term
Short term sources of finance consists of retained profit, personal savings and sale of old
assets. It enables management to meet short term requirement of business and ensure consistent
flow of production (Barton, 2001).
1.2 Implication of sources of finance
As per the given scenario, it has been found that directors of General Sportswear were not
in favor of debt finance. They assumed that it merely increases cost whereby profitability go
down. This is because company has to pay cost of finance to out side party. At this juncture, it is
not important that whether corporation is getting profitability or not. This affect performance to a
great extent (Bhowmik and Saha, 2013). For example, if loan is taken by firm then management
need to pay its interest on right time. Also, principle amount need to be paid within stipulated
time.
1.3Appropriate sources of finance
According to the case study General Sportswear is planning to expand in the marketplace.
In this regard appropriate sources of finance are retained profit, leasing companies. It helps to
4
Paraphrase This Document
Need a fresh take? Get an instant paraphrase of this document with our AI Paraphraser
expand business corporation can acquire highly updated technologies from leasing companies. It
helps to reduce financial burden because assets will be provided on rental basis. Furthermore,
retained profit proves to be effective in acquiring material for the production activities (Graff,
2003). Apart from this, bank loan is also appropriate source for raising long term source for the
firm. However, it generate additional cost for the firm but it is the effective alternative for
expand business. Company can pay the bank loan back after recovery of initial investment. Apart
from this, an alternative option may be financial institutions which supper such kind of
organization. It enables General Sportswear to get finance at low interest rate and expand
business in an effectual manner.
TASK 2
2.1 Analyze cost of different sources of finance
Cost of finance can be tangible such as interest and dividends and there can be
opportunity cost as well. Here, interest is fixed at the time of giving loan and time for payment of
the same is also decided at the same time. Further, dividend is paid to shareholders wen
corporation earn profit. In addition to this, opportunity cost incur because of use of retained
earning in the expansion activities. Apart from this, tax decreases profitability of firm. This is
because corporation need to pay cost of finance at first and then tax is paid. In such as cases
profitability go down to great extent (James, Leavel and Mainam, 2002).
2.2 Importance of finance planning
Financial planning is very important for General Sportswear which gives upward
direction to business. With the help of financial planning firm can control cash and profitability
can be enhanced. Furthermore, financial planning helps management to select appropriate
sources of finance so as to achieve organizational objectives. Similarly, effective tools and
techniques like budgeting and costing are used in order to ensure optimum utilization of limited
financial resources (Wildavsky, 2006).
2.3 Assessing financial information needs of three main decision makers
The main decision makers are shareholders, suppliers and customers. These are directly
or indirectly associated with firm and want to access wide range of information of company. For
example shareholders attend board meeting so as to get detail information related to financial
5
performance of firm. Further, suppliers access financial statements in order to analyze liquidity.
At last customer get updates of General Sportswear with regards to new products and services.
2.4 Impact of finance on financial statement
The finance affect financial statement by increasing cost and decreasing profitability. For
example profit and loss contain information related to interest and other charges paid for raising
fiance from external sources (Richars, 2012). Further, balance sheet is the major statement which
is affected by finance as it increase both side assets and liability in the same proportion.
TASK 3
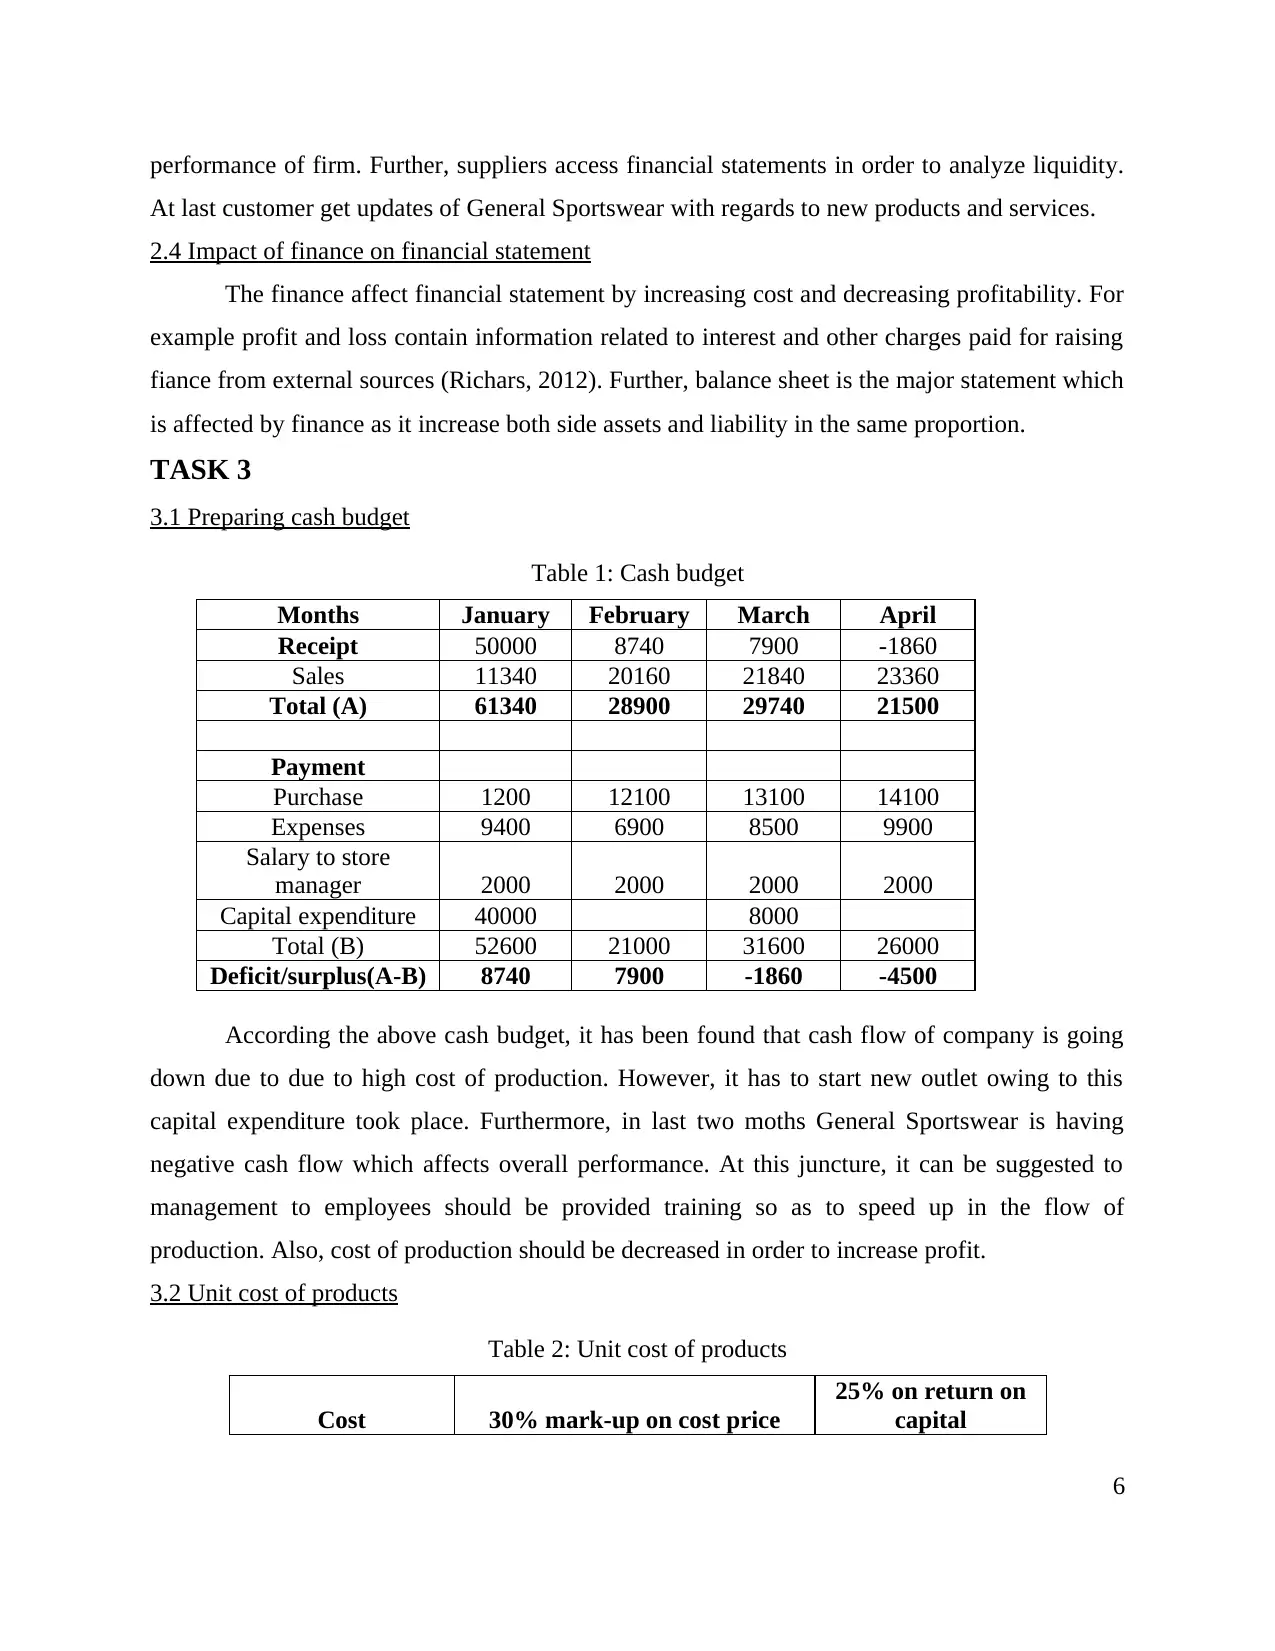
3.1 Preparing cash budget
Table 1: Cash budget
Months January February March April
Receipt 50000 8740 7900 -1860
Sales 11340 20160 21840 23360
Total (A) 61340 28900 29740 21500
Payment
Purchase 1200 12100 13100 14100
Expenses 9400 6900 8500 9900
Salary to store
manager 2000 2000 2000 2000
Capital expenditure 40000 8000
Total (B) 52600 21000 31600 26000
Deficit/surplus(A-B) 8740 7900 -1860 -4500
According the above cash budget, it has been found that cash flow of company is going
down due to due to high cost of production. However, it has to start new outlet owing to this
capital expenditure took place. Furthermore, in last two moths General Sportswear is having
negative cash flow which affects overall performance. At this juncture, it can be suggested to
management to employees should be provided training so as to speed up in the flow of
production. Also, cost of production should be decreased in order to increase profit.
3.2 Unit cost of products
Table 2: Unit cost of products
Cost 30% mark-up on cost price
25% on return on
capital
6
At last customer get updates of General Sportswear with regards to new products and services.
2.4 Impact of finance on financial statement
The finance affect financial statement by increasing cost and decreasing profitability. For
example profit and loss contain information related to interest and other charges paid for raising
fiance from external sources (Richars, 2012). Further, balance sheet is the major statement which
is affected by finance as it increase both side assets and liability in the same proportion.
TASK 3
3.1 Preparing cash budget
Table 1: Cash budget
Months January February March April
Receipt 50000 8740 7900 -1860
Sales 11340 20160 21840 23360
Total (A) 61340 28900 29740 21500
Payment
Purchase 1200 12100 13100 14100
Expenses 9400 6900 8500 9900
Salary to store
manager 2000 2000 2000 2000
Capital expenditure 40000 8000
Total (B) 52600 21000 31600 26000
Deficit/surplus(A-B) 8740 7900 -1860 -4500
According the above cash budget, it has been found that cash flow of company is going
down due to due to high cost of production. However, it has to start new outlet owing to this
capital expenditure took place. Furthermore, in last two moths General Sportswear is having
negative cash flow which affects overall performance. At this juncture, it can be suggested to
management to employees should be provided training so as to speed up in the flow of
production. Also, cost of production should be decreased in order to increase profit.
3.2 Unit cost of products
Table 2: Unit cost of products
Cost 30% mark-up on cost price
25% on return on
capital
6
⊘ This is a preview!⊘
Do you want full access?
Subscribe today to unlock all pages.
Trusted by 1+ million students worldwide
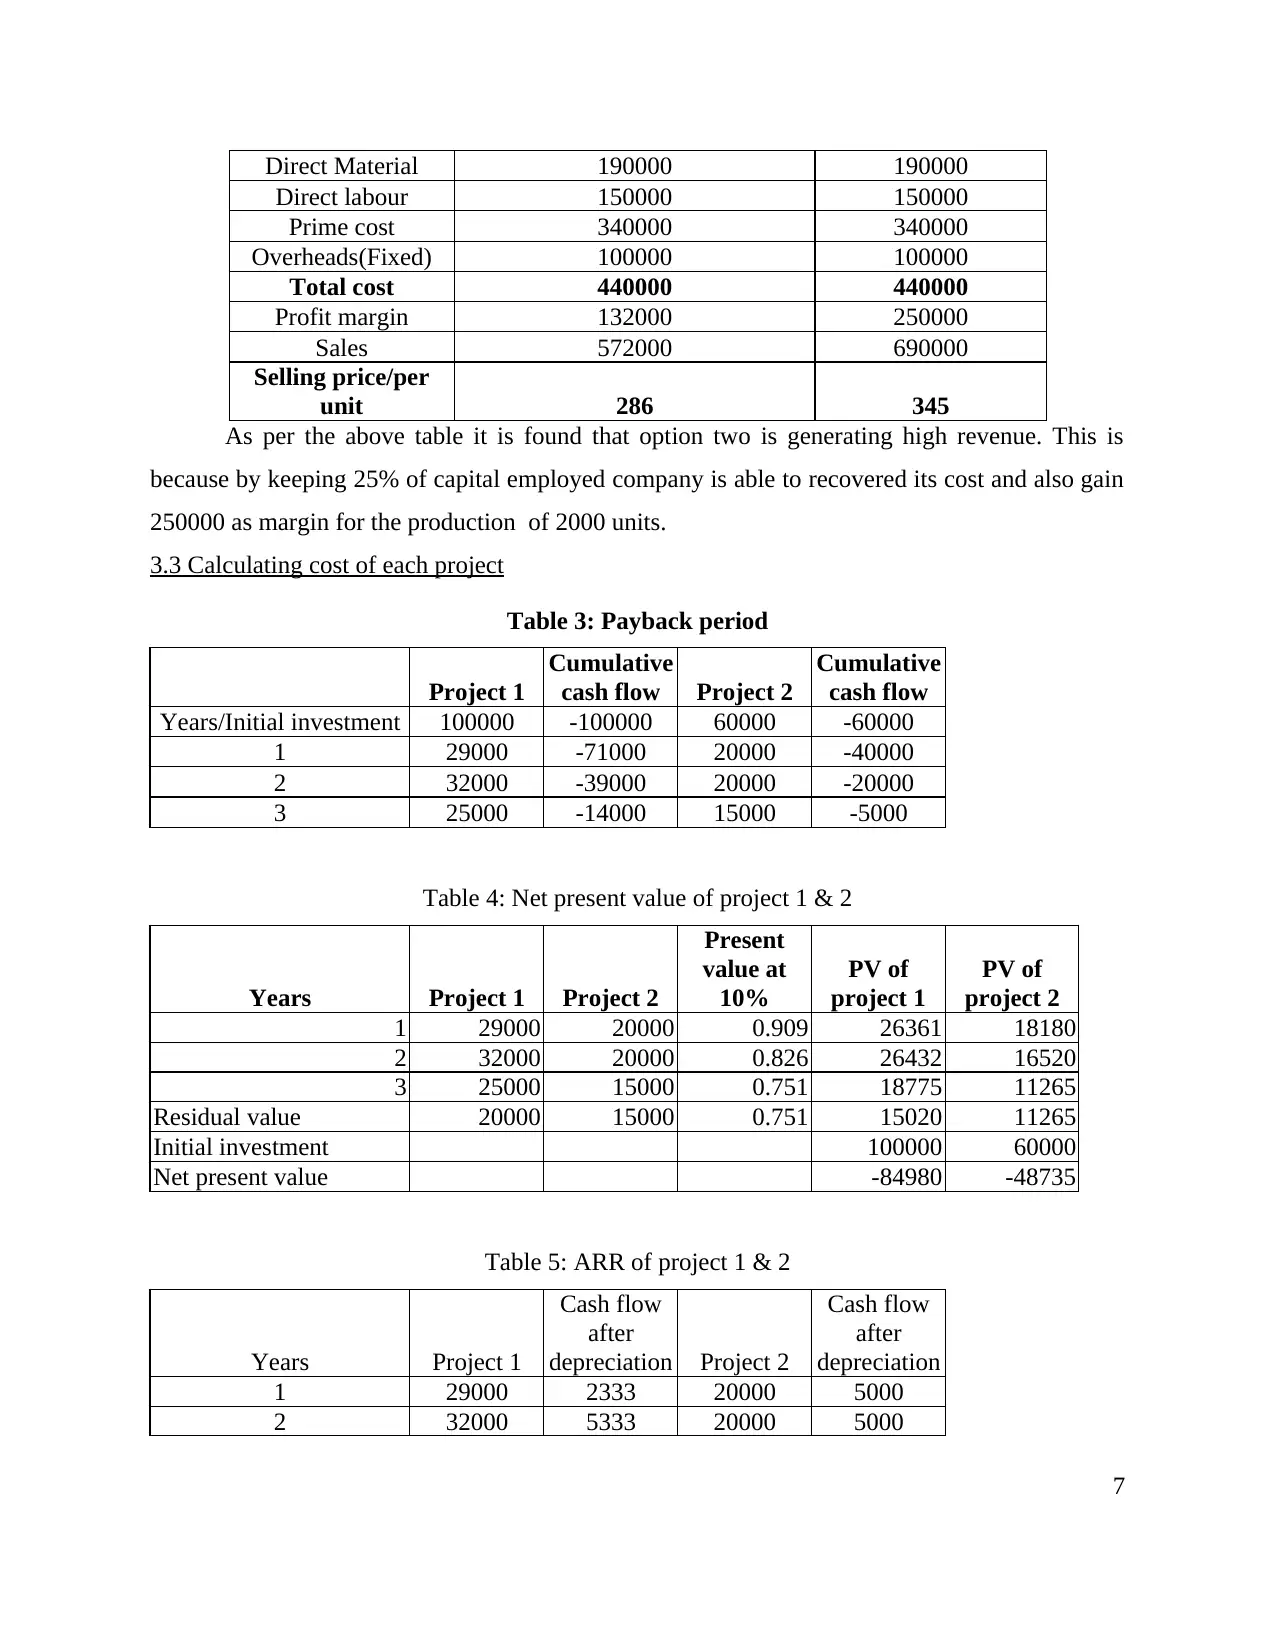
Direct Material 190000 190000
Direct labour 150000 150000
Prime cost 340000 340000
Overheads(Fixed) 100000 100000
Total cost 440000 440000
Profit margin 132000 250000
Sales 572000 690000
Selling price/per
unit 286 345
As per the above table it is found that option two is generating high revenue. This is
because by keeping 25% of capital employed company is able to recovered its cost and also gain
250000 as margin for the production of 2000 units.
3.3 Calculating cost of each project
Table 3: Payback period
Project 1
Cumulative
cash flow Project 2
Cumulative
cash flow
Years/Initial investment 100000 -100000 60000 -60000
1 29000 -71000 20000 -40000
2 32000 -39000 20000 -20000
3 25000 -14000 15000 -5000
Table 4: Net present value of project 1 & 2
Years Project 1 Project 2
Present
value at
10%
PV of
project 1
PV of
project 2
1 29000 20000 0.909 26361 18180
2 32000 20000 0.826 26432 16520
3 25000 15000 0.751 18775 11265
Residual value 20000 15000 0.751 15020 11265
Initial investment 100000 60000
Net present value -84980 -48735
Table 5: ARR of project 1 & 2
Years Project 1
Cash flow
after
depreciation Project 2
Cash flow
after
depreciation
1 29000 2333 20000 5000
2 32000 5333 20000 5000
7
Paraphrase This Document
Need a fresh take? Get an instant paraphrase of this document with our AI Paraphraser
3 25000 -1667 15000 0
Residual value 20000 15000
Depreciation 26667 15000
Initial investment 100000 60000
Average cash flow 1999.66 3333.33
ARR 1.99 5.55
The above calculation depicts that both projects are generating negative revenue (as per
payback and net present value method). However, according to accounting rate of return project
2 should be selected because it is generating high return for the firm. Furthermore, payback table
is showing that initial investment cannot be covered in 3 years. Similarly, net present value also
depicts that both of these project do not prove to be beneficial for Axis Ltd.
TASK 4
4.1 Main financial statements
There are three main financial statements such as balance sheet, profit and loss as well as
fund flow statement. These financial statements enable management to keep record related to
profit and loss of the firm (Liu and et.al., 2007). It aids to meet expectation of different
stakeholders. Furthermore, income statement facilitates to keep record related to cost of finance
such as interest. On the other hand, balance sheet consists of information related to assets and
liabilities.
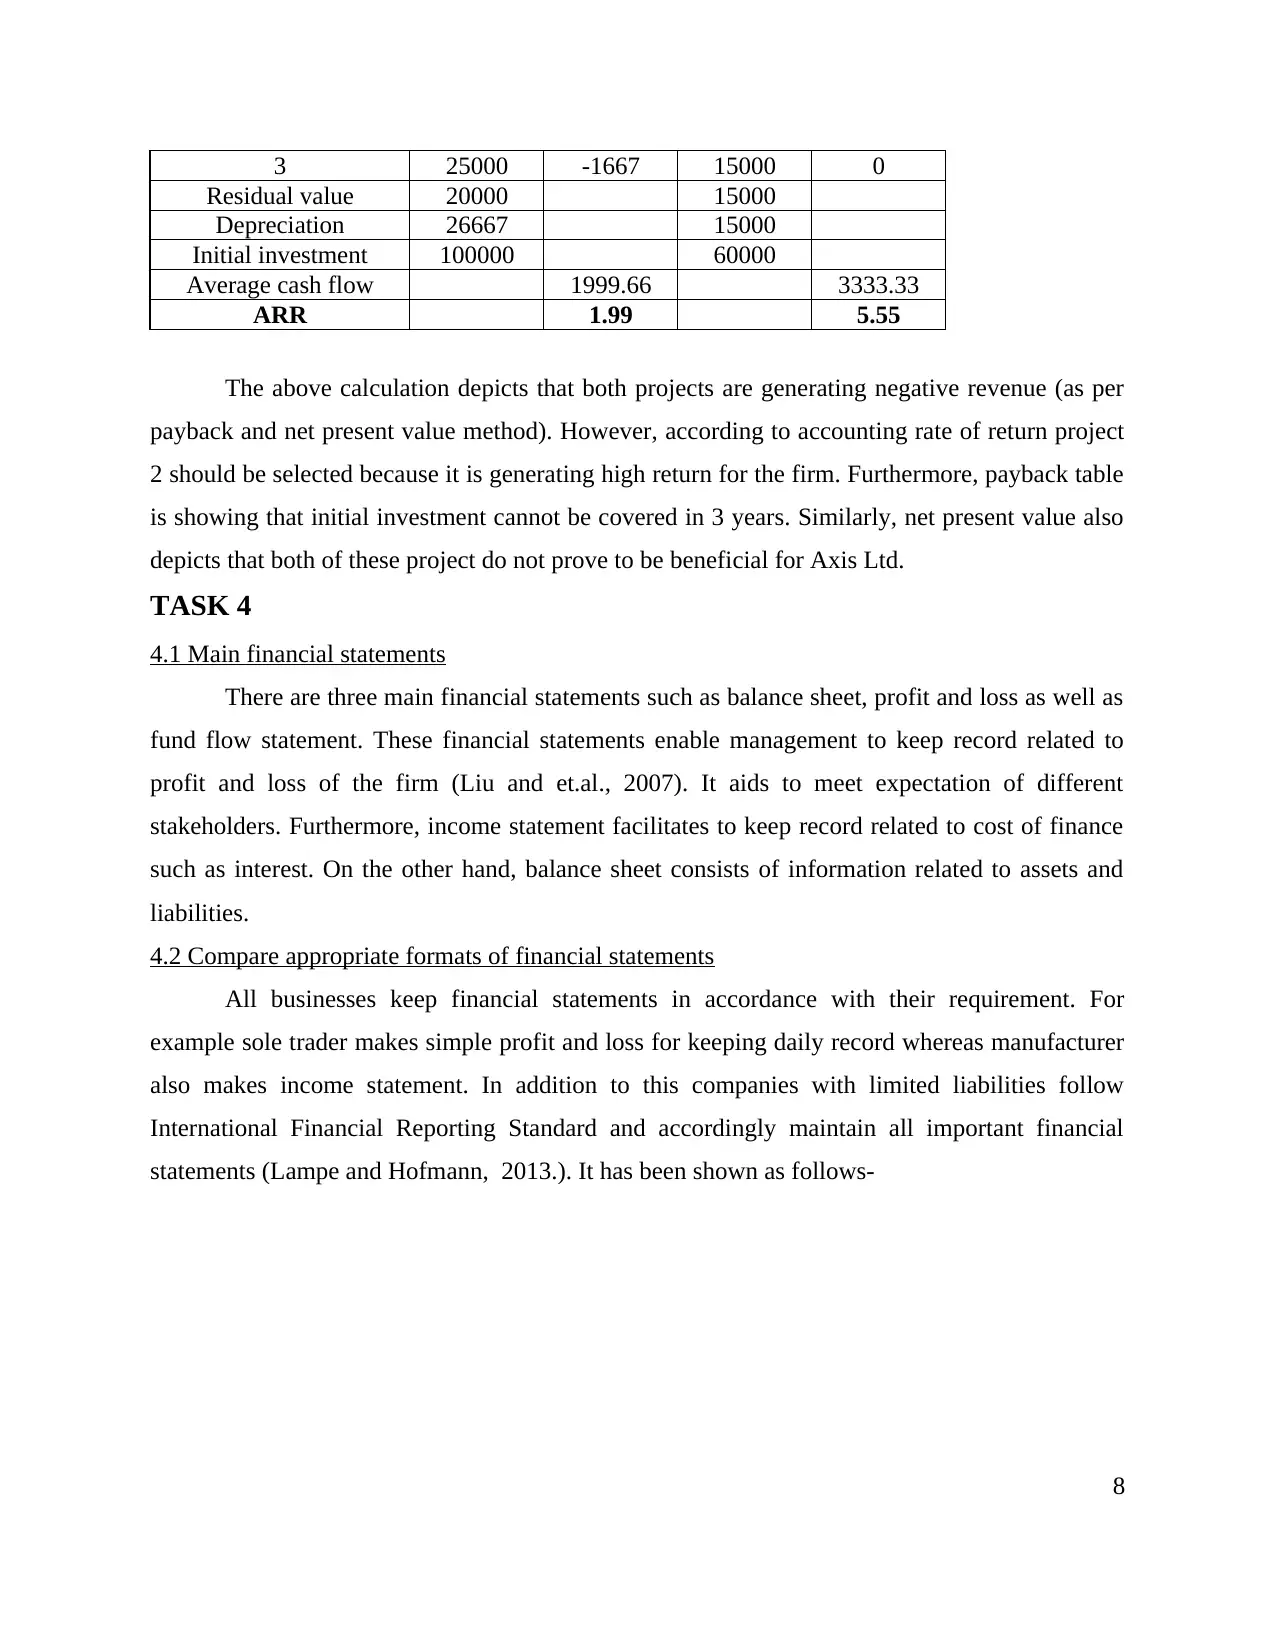
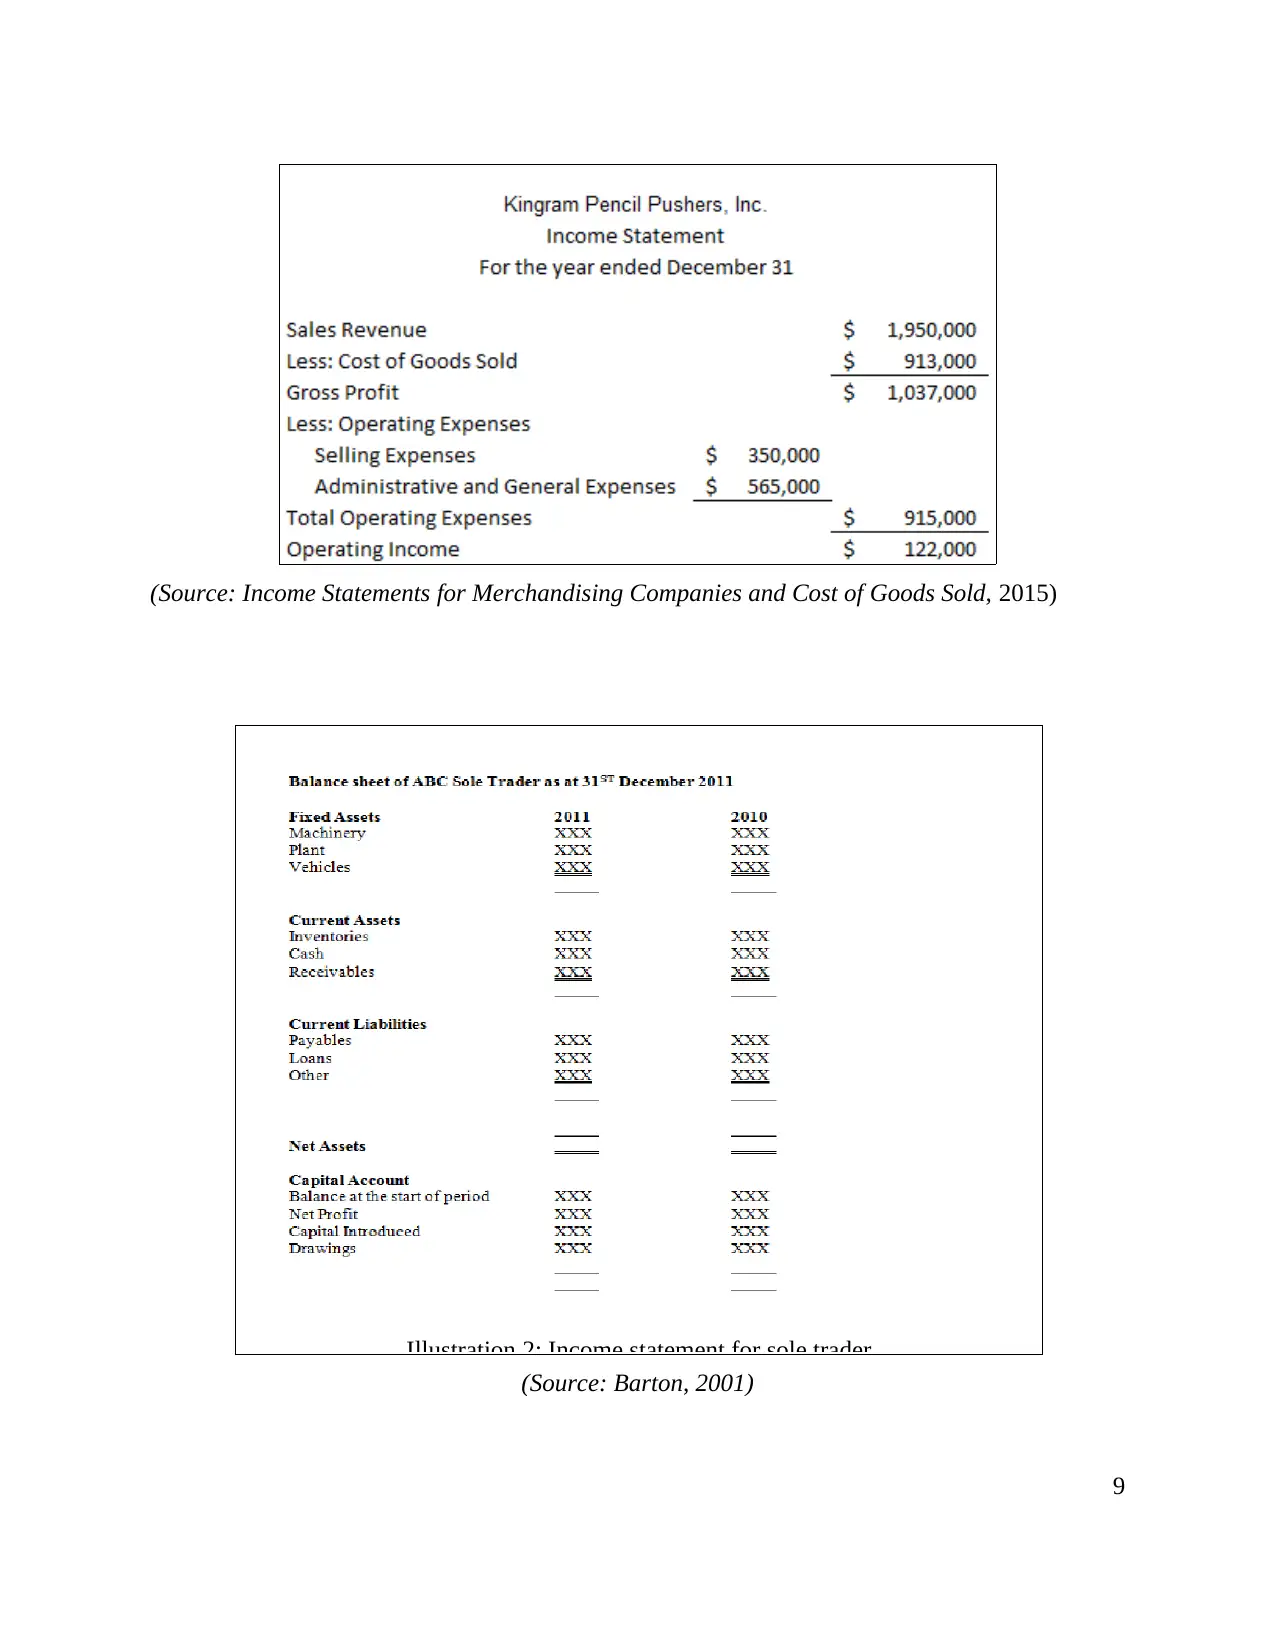
4.2 Compare appropriate formats of financial statements
All businesses keep financial statements in accordance with their requirement. For
example sole trader makes simple profit and loss for keeping daily record whereas manufacturer
also makes income statement. In addition to this companies with limited liabilities follow
International Financial Reporting Standard and accordingly maintain all important financial
statements (Lampe and Hofmann, 2013.). It has been shown as follows-
8
Residual value 20000 15000
Depreciation 26667 15000
Initial investment 100000 60000
Average cash flow 1999.66 3333.33
ARR 1.99 5.55
The above calculation depicts that both projects are generating negative revenue (as per
payback and net present value method). However, according to accounting rate of return project
2 should be selected because it is generating high return for the firm. Furthermore, payback table
is showing that initial investment cannot be covered in 3 years. Similarly, net present value also
depicts that both of these project do not prove to be beneficial for Axis Ltd.
TASK 4
4.1 Main financial statements
There are three main financial statements such as balance sheet, profit and loss as well as
fund flow statement. These financial statements enable management to keep record related to
profit and loss of the firm (Liu and et.al., 2007). It aids to meet expectation of different
stakeholders. Furthermore, income statement facilitates to keep record related to cost of finance
such as interest. On the other hand, balance sheet consists of information related to assets and
liabilities.
4.2 Compare appropriate formats of financial statements
All businesses keep financial statements in accordance with their requirement. For
example sole trader makes simple profit and loss for keeping daily record whereas manufacturer
also makes income statement. In addition to this companies with limited liabilities follow
International Financial Reporting Standard and accordingly maintain all important financial
statements (Lampe and Hofmann, 2013.). It has been shown as follows-
8
(Source: Income Statements for Merchandising Companies and Cost of Goods Sold, 2015)
(Source: Barton, 2001)
9
Illustration 2: Income statement for sole trader
(Source: Barton, 2001)
9
Illustration 2: Income statement for sole trader
⊘ This is a preview!⊘
Do you want full access?
Subscribe today to unlock all pages.
Trusted by 1+ million students worldwide
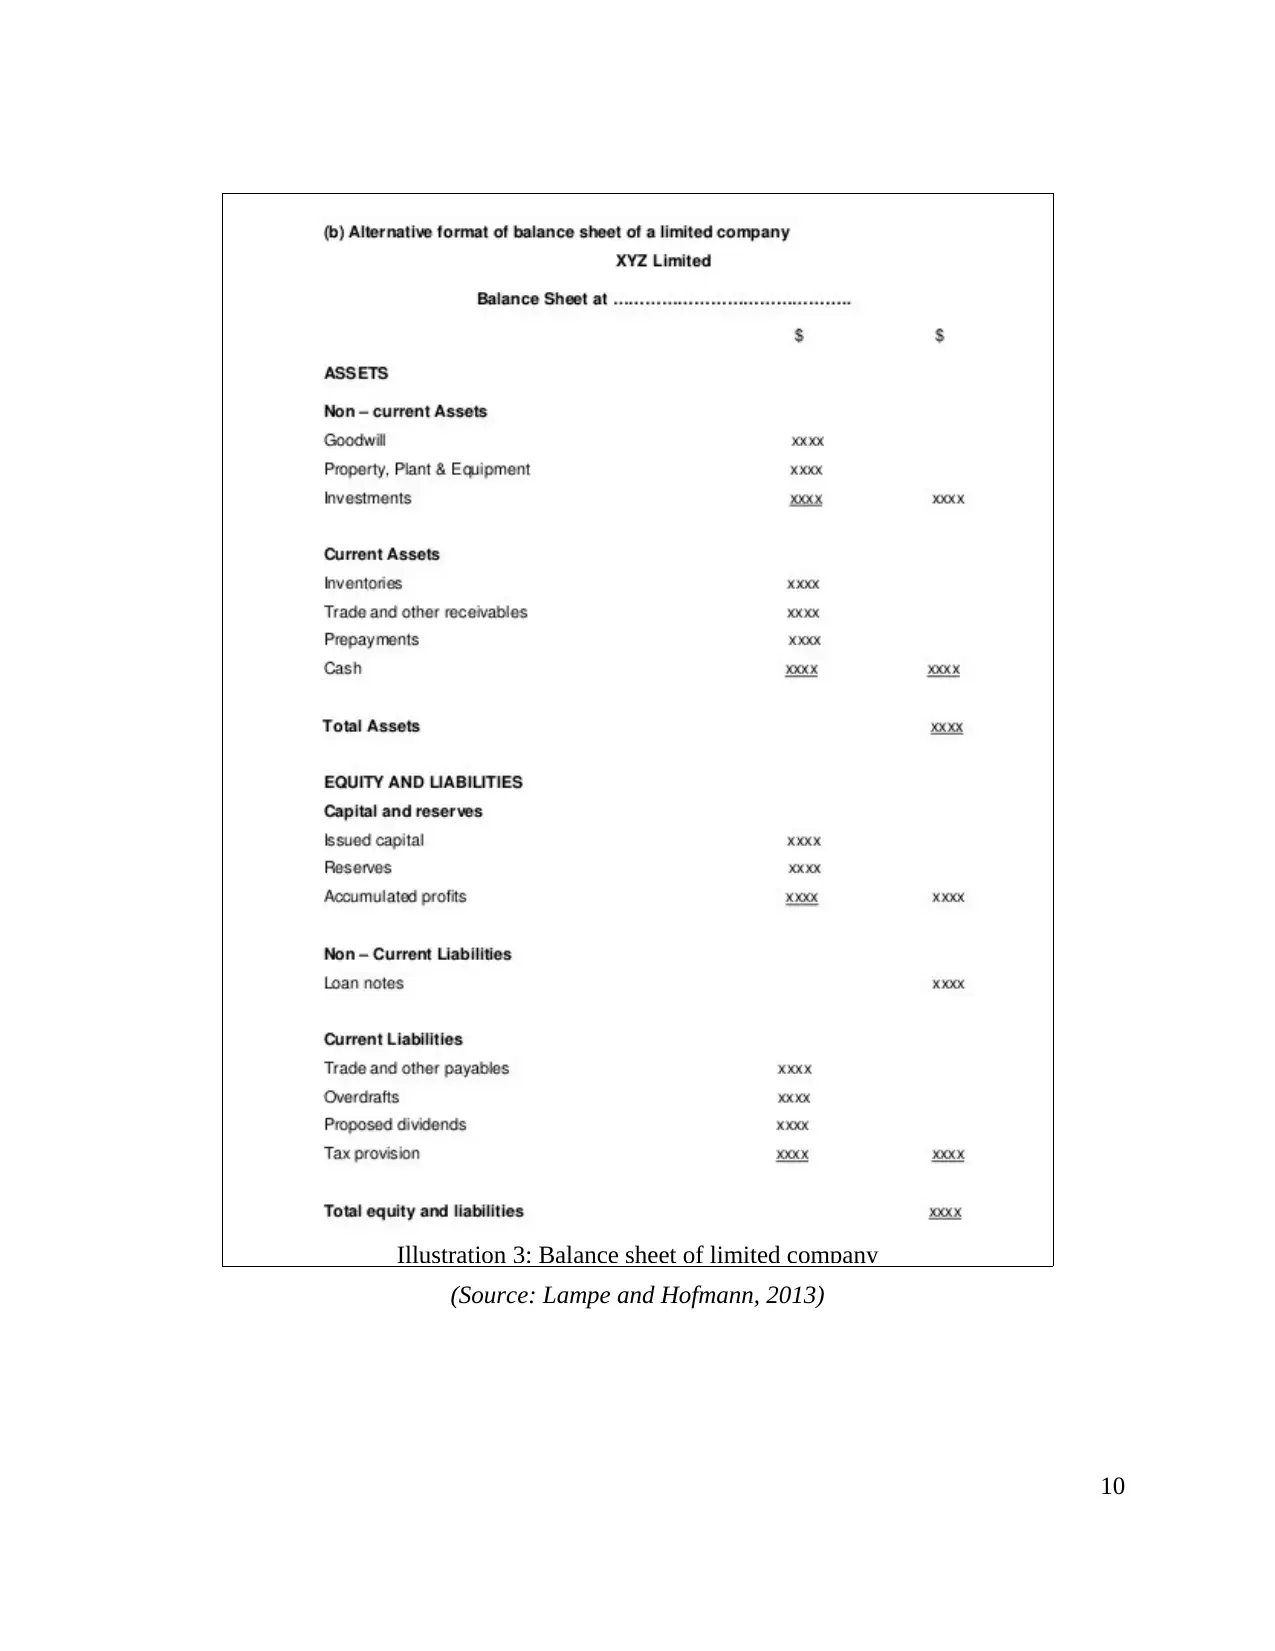
(Source: Lampe and Hofmann, 2013)
10
Illustration 3: Balance sheet of limited company
10
Illustration 3: Balance sheet of limited company
Paraphrase This Document
Need a fresh take? Get an instant paraphrase of this document with our AI Paraphraser
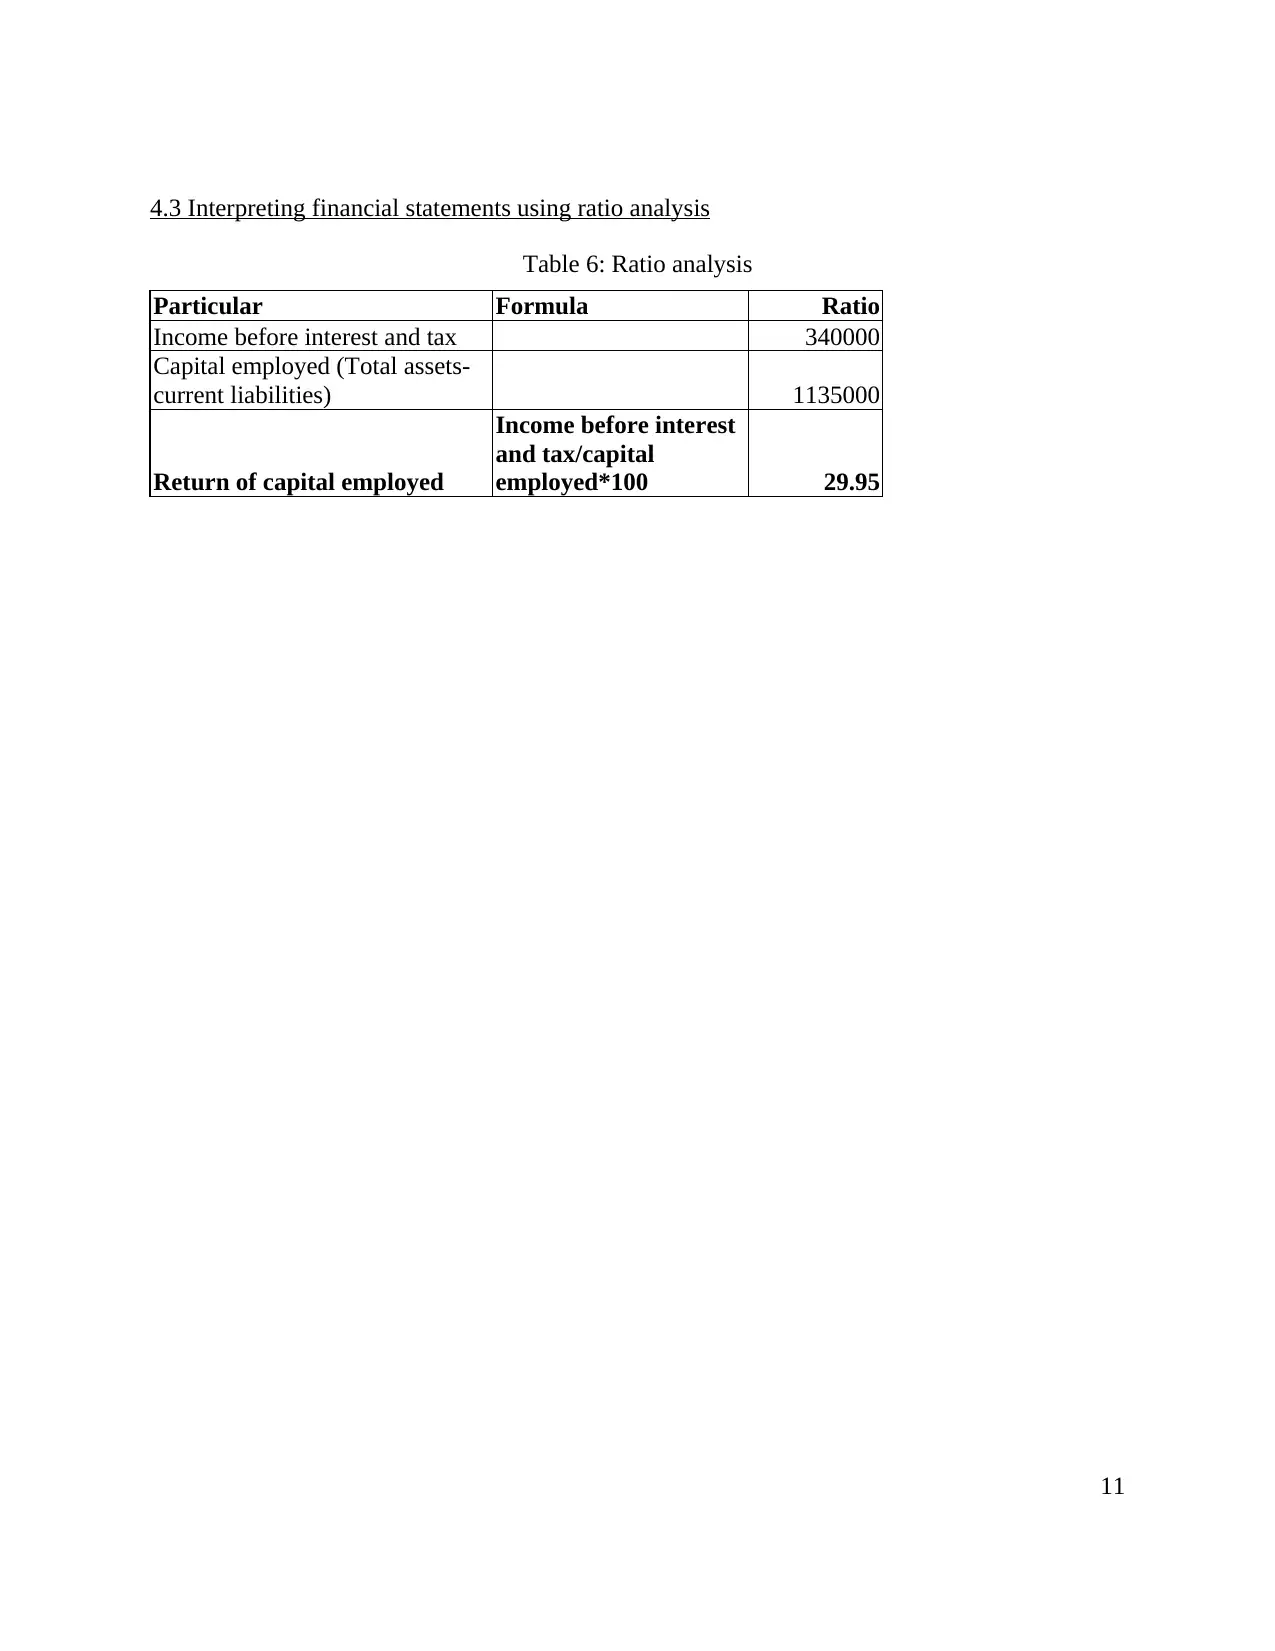
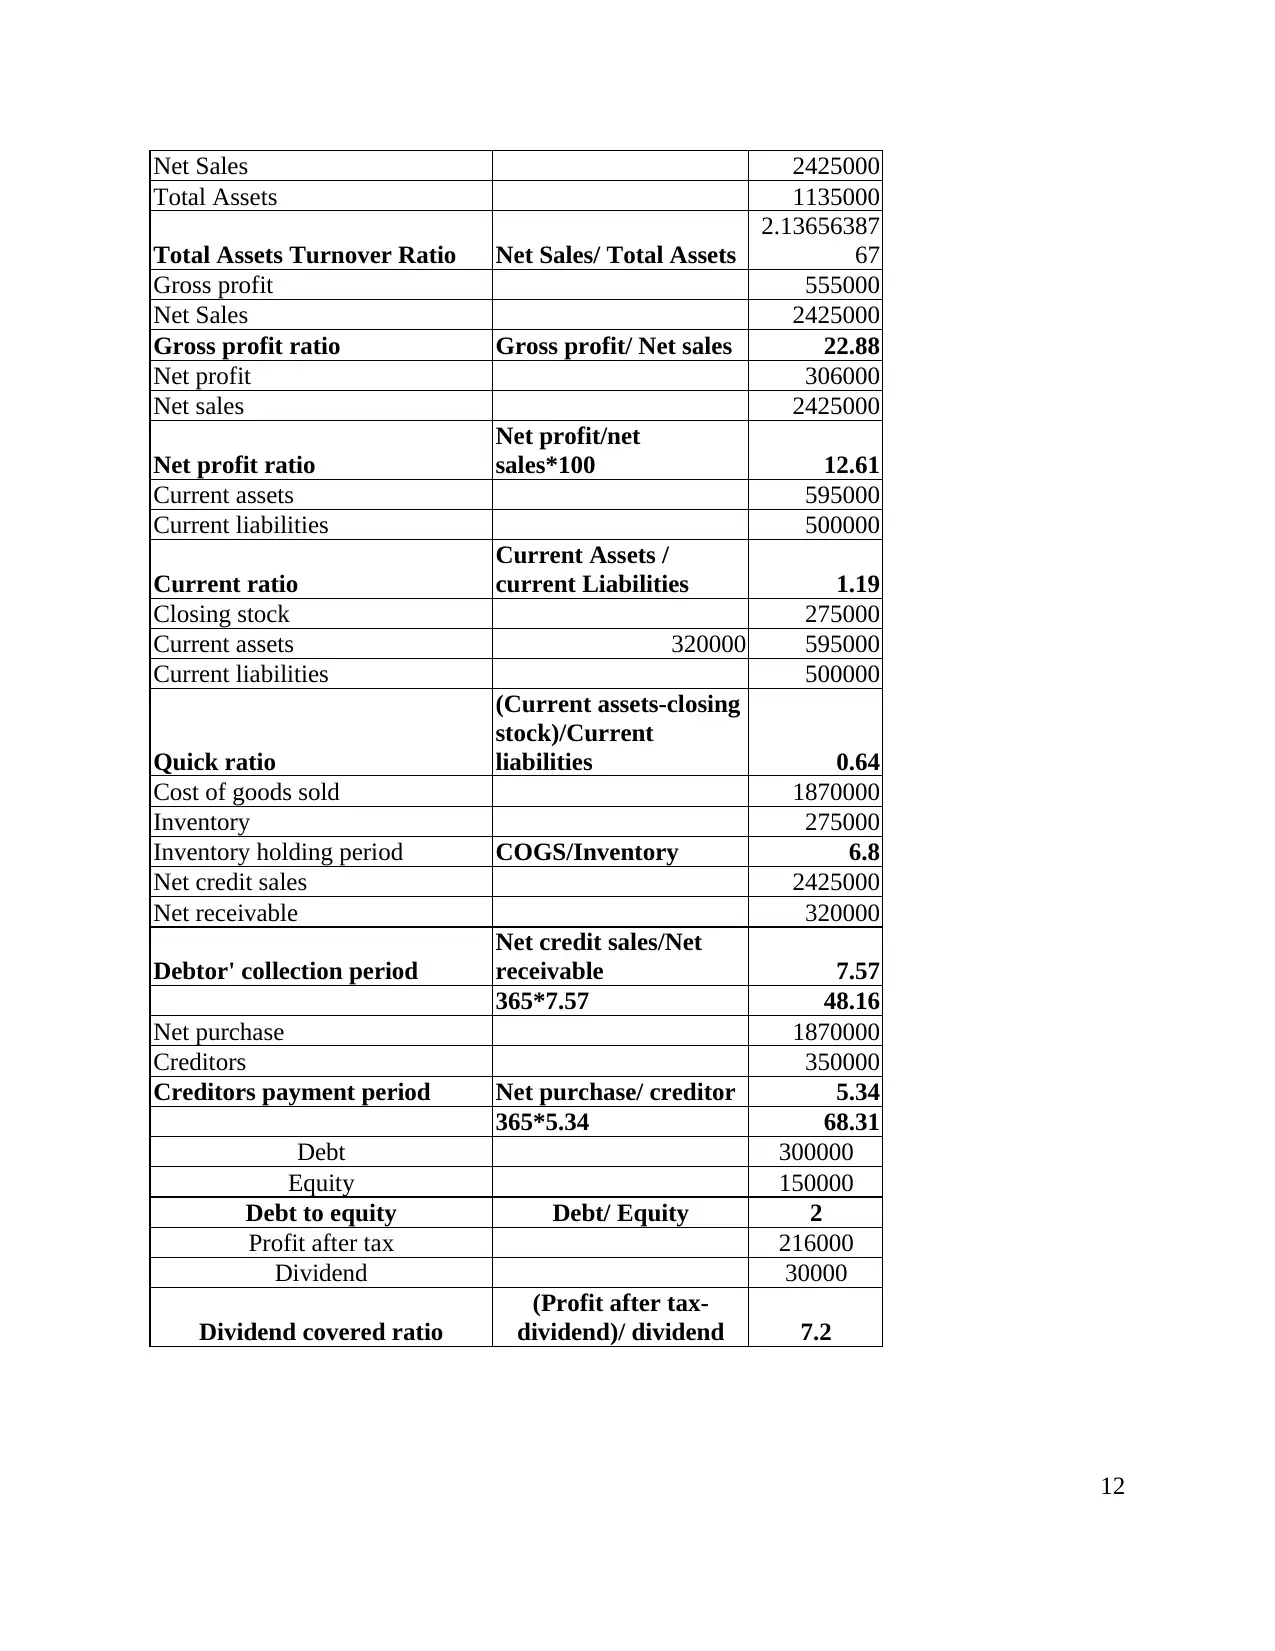
4.3 Interpreting financial statements using ratio analysis
Table 6: Ratio analysis
Particular Formula Ratio
Income before interest and tax 340000
Capital employed (Total assets-
current liabilities) 1135000
Return of capital employed
Income before interest
and tax/capital
employed*100 29.95
11
Table 6: Ratio analysis
Particular Formula Ratio
Income before interest and tax 340000
Capital employed (Total assets-
current liabilities) 1135000
Return of capital employed
Income before interest
and tax/capital
employed*100 29.95
11
Net Sales 2425000
Total Assets 1135000
Total Assets Turnover Ratio Net Sales/ Total Assets
2.13656387
67
Gross profit 555000
Net Sales 2425000
Gross profit ratio Gross profit/ Net sales 22.88
Net profit 306000
Net sales 2425000
Net profit ratio
Net profit/net
sales*100 12.61
Current assets 595000
Current liabilities 500000
Current ratio
Current Assets /
current Liabilities 1.19
Closing stock 275000
Current assets 320000 595000
Current liabilities 500000
Quick ratio
(Current assets-closing
stock)/Current
liabilities 0.64
Cost of goods sold 1870000
Inventory 275000
Inventory holding period COGS/Inventory 6.8
Net credit sales 2425000
Net receivable 320000
Debtor' collection period
Net credit sales/Net
receivable 7.57
365*7.57 48.16
Net purchase 1870000
Creditors 350000
Creditors payment period Net purchase/ creditor 5.34
365*5.34 68.31
Debt 300000
Equity 150000
Debt to equity Debt/ Equity 2
Profit after tax 216000
Dividend 30000
Dividend covered ratio
(Profit after tax-
dividend)/ dividend 7.2
12
⊘ This is a preview!⊘
Do you want full access?
Subscribe today to unlock all pages.
Trusted by 1+ million students worldwide
1 out of 14
Related Documents


Your All-in-One AI-Powered Toolkit for Academic Success.
+13062052269
info@desklib.com
Available 24*7 on WhatsApp / Email
![[object Object]](/_next/static/media/star-bottom.7253800d.svg)
Unlock your academic potential
Copyright © 2020–2026 A2Z Services. All Rights Reserved. Developed and managed by ZUCOL.