Corporate Finance: Efficient Market Hypothesis Project Report
VerifiedAdded on 2021/04/17
|9
|2423
|23
Project
AI Summary
This project report delves into the efficient market hypothesis (EMH) in corporate finance, examining its different forms (weak, semi-strong, and strong) and discussing its implications. The report analyzes the views of Warren Buffett, who does not believe in EMH, and contrasts them with the theory. It explores the controversy surrounding EMH, particularly the debate on technical and fundamental analysis. The report further compares the returns of BHP Billiton stock with the FTSE index to evaluate market efficiency. The analysis uses data from 2013 to 2018 to highlight the fluctuations in returns and concludes that the capital market may not always be efficient. The study emphasizes the importance of critical thinking for investors, suggesting that EMH is based on assumptions and may not offer a reliable basis for investment decisions. The report concludes by highlighting that stock prices are influenced by investor sentiment and market trends. The appendix includes a table of the data used for the analysis, detailing the adjusted closing prices and returns for both BHP Billiton and the FTSE index.
Running Head: Corporate Finance
1
Project Report: Corporate Finance
1
Project Report: Corporate Finance
Paraphrase This Document
Need a fresh take? Get an instant paraphrase of this document with our AI Paraphraser
Corporate Finance
2
Contents
Introduction.......................................................................................................................3
Efficiency market hypothesis...........................................................................................3
Different forms of market efficiency................................................................................3
Discussion about EMH.....................................................................................................4
Difference among the returns...........................................................................................5
Conclusion........................................................................................................................6
References.........................................................................................................................7
Appendix...........................................................................................................................8
Corporate Finance
3
Introduction:
Warren Buffet does not believe in efficient market hypothesis. He is one of the
greatest investors in current scenario. Warren Buffet believes that the share price of a
particular company could be controlled by the inventors by selling bulk shares or buying bulk
shares at any time. Due to the information and insider knowledge about the security market,
Warren Buffet managed to outperform in the market and the companies of Warren Buffet has
managed to maintain a good average market rate. The report explains about the EMH and the
related forms of EMH in a security market.
Efficiency market hypothesis:
Efficient market hypothesis is a financial theory which explains that it is not possible
for anyone to beat the stock market and stock price of an organization reflects about entire
position and performance of an organization. EMH theory explains that a stock is always
traded in its fair value and it makes it sure that no stock is purchased or sold in over or under
value (Watson and Head, 2016). Though, the theory of EMH is highly controversial as people
believe that technical and fundamental analysis is pointless while evaluating a stock’s price.
Different forms of market efficiency:
Though, it is believed by EMH theory that market is efficient. However, the EMH
could be categorized into 3 levels, which are as follows:
1. Weak form EMH:
Weak form of EMH explains that it is assumed that the market’s rate of return is
independent. These values changes independently and the market index does not
make an impact on the stock price of the company (Degutis and Novickyte, 2014).
2. Semi strong EMH:
Semi strong form of EMH explains that it is assumed that the market’s rate of return
is semi independent. These values changes with the help of market index as well as
with the internal changes in the organization, stock price of the company is linked
with both the internal changes as well as market index.
3. Strong EMH:
⊘ This is a preview!⊘
Do you want full access?
Subscribe today to unlock all pages.
Trusted by 1+ million students worldwide
Corporate Finance
4
Further, strong form of EMH explains that it is assumed that the market’s rate of
return is dependent on market index. These values changes only with the help of
market index. Stock price of the company is linked with the market index (Narayan,
Narayan, Popp and Ali Ahmed, 2015). With the change in market index, stock price
would automatically change.
It explains that there are three forms of EMH. The form of EMH could be identified
by any analyst through various financial techniques such as evaluating the market index.
Exchange specialist, regression, event test, trading test etc.
Discussion about EMH:
Hamid et al, (2017) has explained that efficient market hypothesis (EMH) is a theory
of finance which explains that it is not possible for anyone to beat the stock market. Stock
price of an organization reflects about inside changes of the organization. Further, it has been
added by Marwala and Evan, (2018) that EMH theory explains that a stock is always traded
in its fair value and it makes it sure that no stock is purchased or sold in over or under value.
But the given case and study of Warren Buffet explains it wrong. Warren Buffet believes that
the share price of a particular company could be controlled by the inventors by selling bulk
shares or buying bulk shares at any time (Watson and Head, 2016).
It explains that the theory of EMH is highly controversial. People believe that
technical and fundamental analysis is pointless while evaluating a stock’s price. If the EMH
theory explains that the stock price could not be overvalued or under value than it was never
possible for Warren Buffet to set market indices of 11.16% per year. Warren Buffet believes
that it is not possible for any organization to maintain and manage the stock price (Frisch and
Kolaric, 2014). Stock price of an organization could be up and down with the trend of buying
the stock or selling the stock.
Further, it has been argued by Spyridon, (2016) that a market could never be efficient
as the stock price of an organization never depends on the organization’s performance and the
position of the organization. However, Kauffman, Spaulding and Wood, (2009) has reported
against to it and depicted that the inside changes and good performance of an organization
always enhances the stock price of an organization and vice versa. EMH theory assumes that
the relevant information about an organization should be full and reflects the relevant
information of the company correctly (Malkiel, 2003). Formally, there a capital market could
Paraphrase This Document
Need a fresh take? Get an instant paraphrase of this document with our AI Paraphraser
Corporate Finance
5
only be efficient if the stock price of an organization is never unaffected after disclosing all
the information.
Most of the analyst has believed that EMH theory is based on many assumptions and
thus, it should not be concerned while making an investment into the stock market. Further,
it has been added by Frisch and Kolaric, (2014) that future analyst should evaluate, analyze
and disclose the new method of investment as security market could never be efficient.
Though, Marwala and Evan (2018) has claimed that if the stock price of an organization is
undervalued than stock market should stop the trade of that stock for some time, it would
help the market to be efficient and with the help of it, the securities could be traded in fair
value. Warren Buffet has expressed his thought about stock and said that investors should
never be emotional about its investment and must invest crucially as investor could be
emotional to stocks but stocks would never be emotional for the investors (Degutis and
Novickyte, 2014).
Thus, the warren Buffet case and the study on various articles about the EMH theory
explain that capital market could never be efficient. EMH theory is based on many
assumptions and thus it does not offer a good conclusion to the investor. An investor should
think crucially while investing into the stock.
Difference among the returns:
For evaluating the efficient market hypothesis in a better way, UK stock, BHP
Billiton stock, has been analyzed and compared with the FTSE index to evaluate that how
much market is efficient and how the stock price and return of FTSE index is impacting on
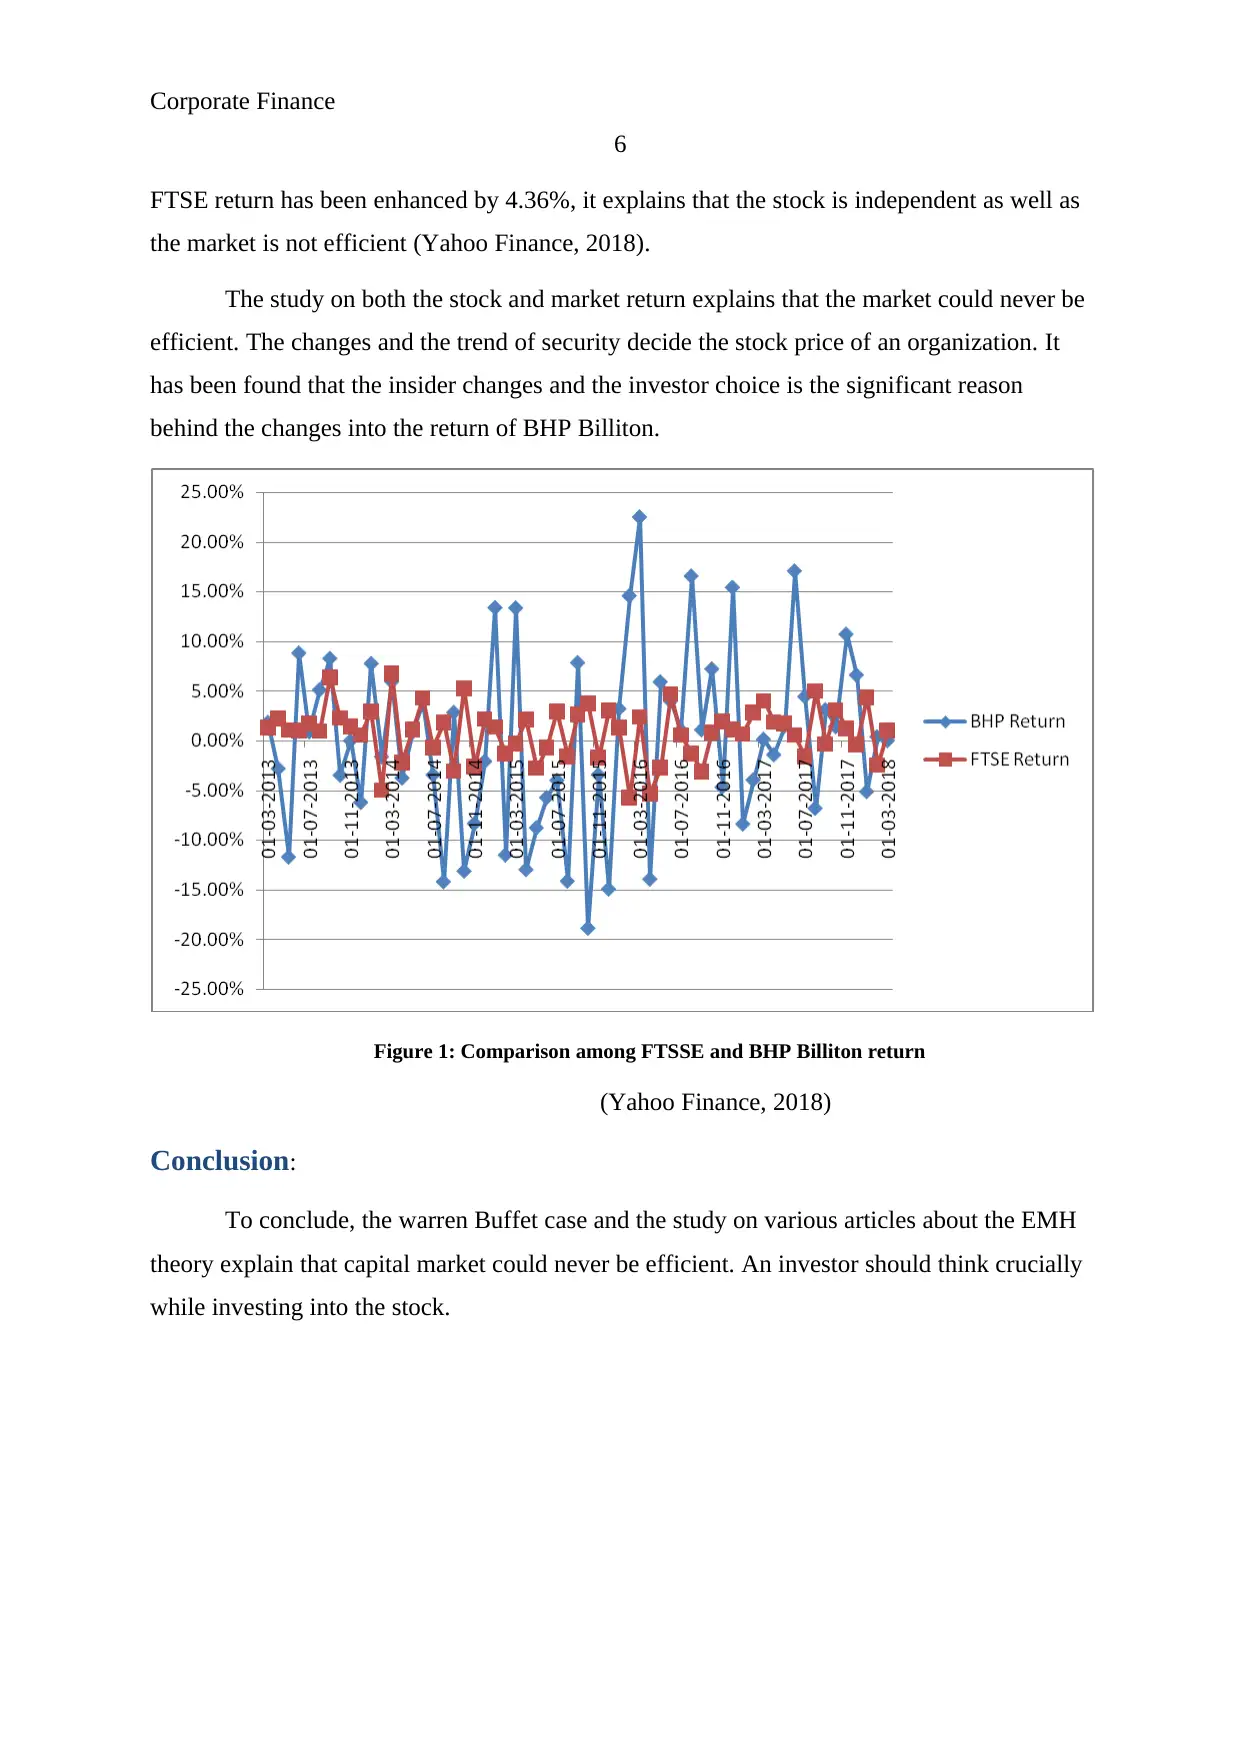
the BHP Billiton stock. The Below given figure explains that the market return of BHP
Billion and FTSE are changing rapidly. Though, it has been evaluated that the returns of BHP
Billiton is changing on a higher level whereas the return of FTSE stock is changing at a lower
level (Watson and Head, 2016).
It explains that the weak form of efficiency is there among FTSE returns and BHP
Billiton returns. Through the analysis on both the stock, it has been evaluated that on 1-7-
2014, the return of BHP Billiton has been enhanced by 3.86% and on the other hand, FTSE
return has been enhanced by 4.29%, it explains that the market was quite efficient. Through,
on 1-1-2018, the return of BHP Billiton has been decreased by 5.14% and on the other hand,
5
only be efficient if the stock price of an organization is never unaffected after disclosing all
the information.
Most of the analyst has believed that EMH theory is based on many assumptions and
thus, it should not be concerned while making an investment into the stock market. Further,
it has been added by Frisch and Kolaric, (2014) that future analyst should evaluate, analyze
and disclose the new method of investment as security market could never be efficient.
Though, Marwala and Evan (2018) has claimed that if the stock price of an organization is
undervalued than stock market should stop the trade of that stock for some time, it would
help the market to be efficient and with the help of it, the securities could be traded in fair
value. Warren Buffet has expressed his thought about stock and said that investors should
never be emotional about its investment and must invest crucially as investor could be
emotional to stocks but stocks would never be emotional for the investors (Degutis and
Novickyte, 2014).
Thus, the warren Buffet case and the study on various articles about the EMH theory
explain that capital market could never be efficient. EMH theory is based on many
assumptions and thus it does not offer a good conclusion to the investor. An investor should
think crucially while investing into the stock.
Difference among the returns:
For evaluating the efficient market hypothesis in a better way, UK stock, BHP
Billiton stock, has been analyzed and compared with the FTSE index to evaluate that how
much market is efficient and how the stock price and return of FTSE index is impacting on
the BHP Billiton stock. The Below given figure explains that the market return of BHP
Billion and FTSE are changing rapidly. Though, it has been evaluated that the returns of BHP
Billiton is changing on a higher level whereas the return of FTSE stock is changing at a lower
level (Watson and Head, 2016).
It explains that the weak form of efficiency is there among FTSE returns and BHP
Billiton returns. Through the analysis on both the stock, it has been evaluated that on 1-7-
2014, the return of BHP Billiton has been enhanced by 3.86% and on the other hand, FTSE
return has been enhanced by 4.29%, it explains that the market was quite efficient. Through,
on 1-1-2018, the return of BHP Billiton has been decreased by 5.14% and on the other hand,
Corporate Finance
6
FTSE return has been enhanced by 4.36%, it explains that the stock is independent as well as
the market is not efficient (Yahoo Finance, 2018).
The study on both the stock and market return explains that the market could never be
efficient. The changes and the trend of security decide the stock price of an organization. It
has been found that the insider changes and the investor choice is the significant reason
behind the changes into the return of BHP Billiton.
Figure 1: Comparison among FTSSE and BHP Billiton return
(Yahoo Finance, 2018)
Conclusion:
To conclude, the warren Buffet case and the study on various articles about the EMH
theory explain that capital market could never be efficient. An investor should think crucially
while investing into the stock.
⊘ This is a preview!⊘
Do you want full access?
Subscribe today to unlock all pages.
Trusted by 1+ million students worldwide
Corporate Finance
7
References:
And Increases In The South African Stock Market: A Note On Market.International
Business and Economics Research Journal, 04/2014, Volume 13, Issue 3
Degutis, A. and Novickyte, L., 2014. The efficient market hypothesis: a critical review of
literature and methodology. Ekonomika, 93(2), p.7.
Frisch,T. and Kolaric, S. D. 2014. ReturnsOn Large Stock Price Declines
Hamid, K., Suleman, M.T., Ali Shah, S.Z., Akash, I. and Shahid, R., 2017. Testing the weak
form of efficient market hypothesis: Empirical evidence from Asia-Pacific markets.
Kauffman, R. J; Spaulding, T. J; and Wood, C. A. 2009 .Are online auction marketsefficient?
An empirical study of market liquidity and abnormalreturns. Decision Support Systems,
2009, Volume 48, Issue 1.
Malkiel, B,G. 2003. The EfficientMarketHypothesis and Its Critics .The Journal of Economic
Perspectives, 03/2003, Volume 17, Issue 1
Marwala, T. and Evan H. "Efficient Market Hypothesis." Artificial Intelligence and
Economic Theory: Skynet in the Market. Springer, Cham, 2017. 101-110.
Narayan, P.K., Narayan, S., Popp, S. and Ali Ahmed, H., 2015. Is the efficient market
hypothesis day-of-the-week dependent? Evidence from the banking sector. Applied
Economics, 47(23), pp.2359-2378.
Spyridon ,R. 2016.Abnormal stock returns in Greece during the Cypriot banking crisis
Journal of Money Laundering Control, 05/2016, Volume 19, Issue 2
Timmermann, A and Granger, C. 2004. Efficientmarkethypothesis and forecastingW.J
International Journal of Forecasting, 2004, Volume 20, Issue 1
Watson,D and Head, A. 2016.Corporate Finance: Principles and Practice 7th
Edition .Prentice Hall.
Yahoo Finance. 2018. BHP Billiton. [Online]. Available at:
https://in.finance.yahoo.com/quote/BHP/history?p=BHP [Accessed as on 6th Feb 2018].
Paraphrase This Document
Need a fresh take? Get an instant paraphrase of this document with our AI Paraphraser
Corporate Finance
8
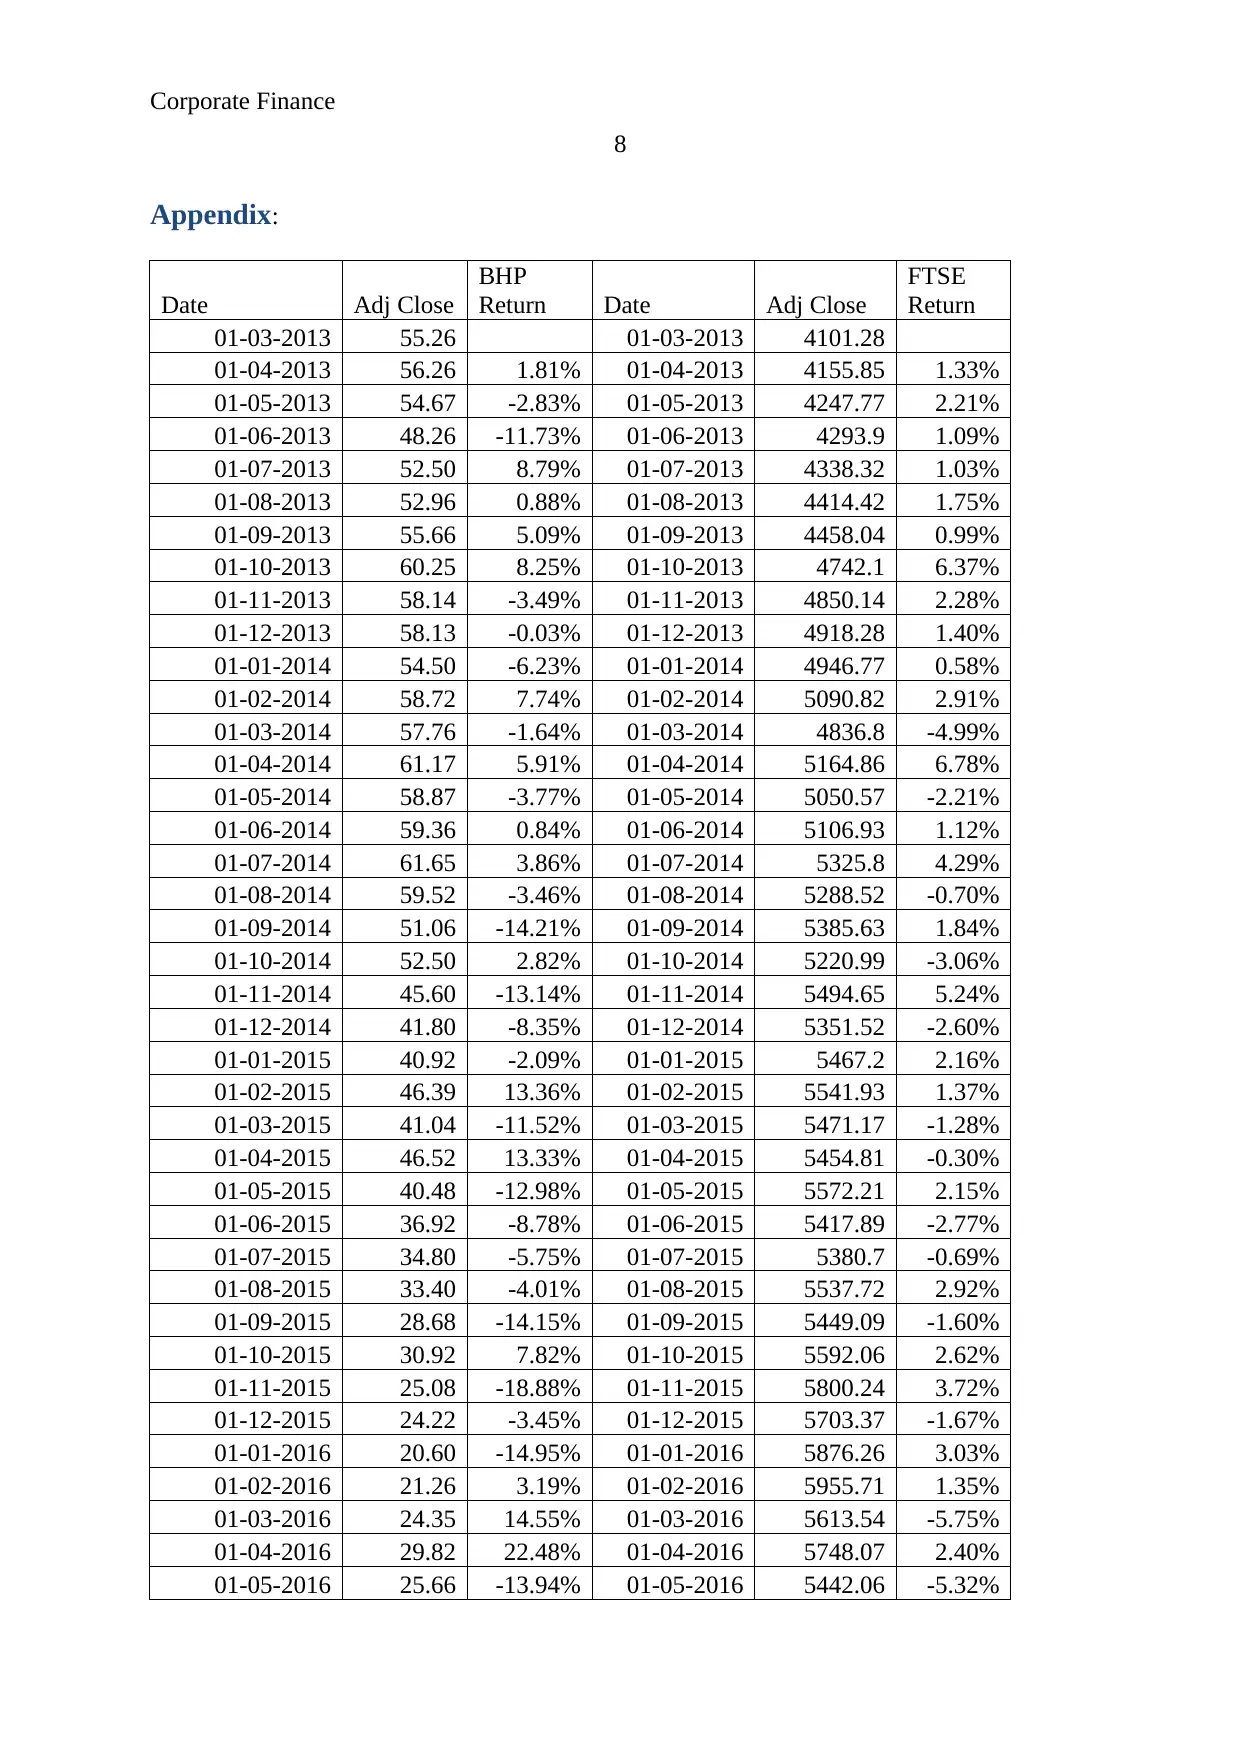
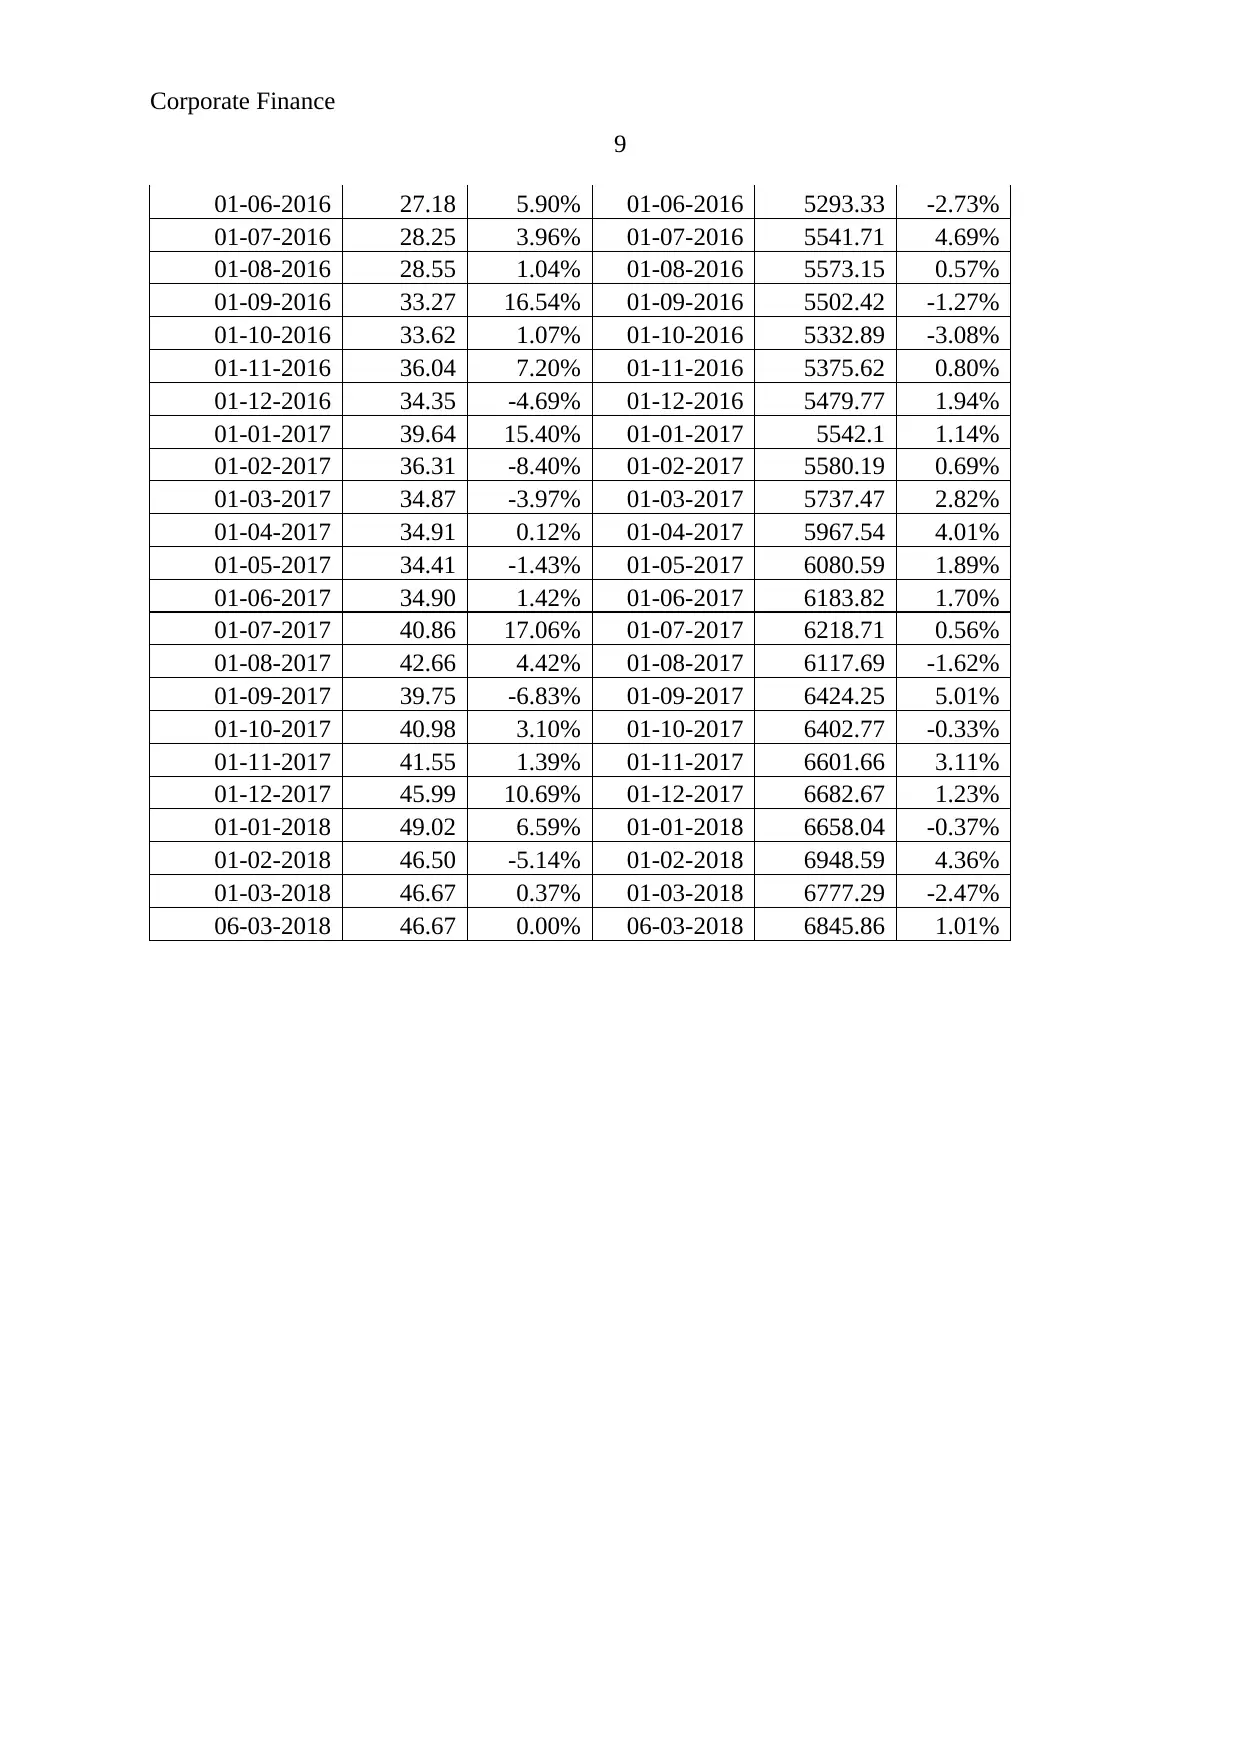
Appendix:
Date Adj Close
BHP
Return Date Adj Close
FTSE
Return
01-03-2013 55.26 01-03-2013 4101.28
01-04-2013 56.26 1.81% 01-04-2013 4155.85 1.33%
01-05-2013 54.67 -2.83% 01-05-2013 4247.77 2.21%
01-06-2013 48.26 -11.73% 01-06-2013 4293.9 1.09%
01-07-2013 52.50 8.79% 01-07-2013 4338.32 1.03%
01-08-2013 52.96 0.88% 01-08-2013 4414.42 1.75%
01-09-2013 55.66 5.09% 01-09-2013 4458.04 0.99%
01-10-2013 60.25 8.25% 01-10-2013 4742.1 6.37%
01-11-2013 58.14 -3.49% 01-11-2013 4850.14 2.28%
01-12-2013 58.13 -0.03% 01-12-2013 4918.28 1.40%
01-01-2014 54.50 -6.23% 01-01-2014 4946.77 0.58%
01-02-2014 58.72 7.74% 01-02-2014 5090.82 2.91%
01-03-2014 57.76 -1.64% 01-03-2014 4836.8 -4.99%
01-04-2014 61.17 5.91% 01-04-2014 5164.86 6.78%
01-05-2014 58.87 -3.77% 01-05-2014 5050.57 -2.21%
01-06-2014 59.36 0.84% 01-06-2014 5106.93 1.12%
01-07-2014 61.65 3.86% 01-07-2014 5325.8 4.29%
01-08-2014 59.52 -3.46% 01-08-2014 5288.52 -0.70%
01-09-2014 51.06 -14.21% 01-09-2014 5385.63 1.84%
01-10-2014 52.50 2.82% 01-10-2014 5220.99 -3.06%
01-11-2014 45.60 -13.14% 01-11-2014 5494.65 5.24%
01-12-2014 41.80 -8.35% 01-12-2014 5351.52 -2.60%
01-01-2015 40.92 -2.09% 01-01-2015 5467.2 2.16%
01-02-2015 46.39 13.36% 01-02-2015 5541.93 1.37%
01-03-2015 41.04 -11.52% 01-03-2015 5471.17 -1.28%
01-04-2015 46.52 13.33% 01-04-2015 5454.81 -0.30%
01-05-2015 40.48 -12.98% 01-05-2015 5572.21 2.15%
01-06-2015 36.92 -8.78% 01-06-2015 5417.89 -2.77%
01-07-2015 34.80 -5.75% 01-07-2015 5380.7 -0.69%
01-08-2015 33.40 -4.01% 01-08-2015 5537.72 2.92%
01-09-2015 28.68 -14.15% 01-09-2015 5449.09 -1.60%
01-10-2015 30.92 7.82% 01-10-2015 5592.06 2.62%
01-11-2015 25.08 -18.88% 01-11-2015 5800.24 3.72%
01-12-2015 24.22 -3.45% 01-12-2015 5703.37 -1.67%
01-01-2016 20.60 -14.95% 01-01-2016 5876.26 3.03%
01-02-2016 21.26 3.19% 01-02-2016 5955.71 1.35%
01-03-2016 24.35 14.55% 01-03-2016 5613.54 -5.75%
01-04-2016 29.82 22.48% 01-04-2016 5748.07 2.40%
01-05-2016 25.66 -13.94% 01-05-2016 5442.06 -5.32%
8
Appendix:
Date Adj Close
BHP
Return Date Adj Close
FTSE
Return
01-03-2013 55.26 01-03-2013 4101.28
01-04-2013 56.26 1.81% 01-04-2013 4155.85 1.33%
01-05-2013 54.67 -2.83% 01-05-2013 4247.77 2.21%
01-06-2013 48.26 -11.73% 01-06-2013 4293.9 1.09%
01-07-2013 52.50 8.79% 01-07-2013 4338.32 1.03%
01-08-2013 52.96 0.88% 01-08-2013 4414.42 1.75%
01-09-2013 55.66 5.09% 01-09-2013 4458.04 0.99%
01-10-2013 60.25 8.25% 01-10-2013 4742.1 6.37%
01-11-2013 58.14 -3.49% 01-11-2013 4850.14 2.28%
01-12-2013 58.13 -0.03% 01-12-2013 4918.28 1.40%
01-01-2014 54.50 -6.23% 01-01-2014 4946.77 0.58%
01-02-2014 58.72 7.74% 01-02-2014 5090.82 2.91%
01-03-2014 57.76 -1.64% 01-03-2014 4836.8 -4.99%
01-04-2014 61.17 5.91% 01-04-2014 5164.86 6.78%
01-05-2014 58.87 -3.77% 01-05-2014 5050.57 -2.21%
01-06-2014 59.36 0.84% 01-06-2014 5106.93 1.12%
01-07-2014 61.65 3.86% 01-07-2014 5325.8 4.29%
01-08-2014 59.52 -3.46% 01-08-2014 5288.52 -0.70%
01-09-2014 51.06 -14.21% 01-09-2014 5385.63 1.84%
01-10-2014 52.50 2.82% 01-10-2014 5220.99 -3.06%
01-11-2014 45.60 -13.14% 01-11-2014 5494.65 5.24%
01-12-2014 41.80 -8.35% 01-12-2014 5351.52 -2.60%
01-01-2015 40.92 -2.09% 01-01-2015 5467.2 2.16%
01-02-2015 46.39 13.36% 01-02-2015 5541.93 1.37%
01-03-2015 41.04 -11.52% 01-03-2015 5471.17 -1.28%
01-04-2015 46.52 13.33% 01-04-2015 5454.81 -0.30%
01-05-2015 40.48 -12.98% 01-05-2015 5572.21 2.15%
01-06-2015 36.92 -8.78% 01-06-2015 5417.89 -2.77%
01-07-2015 34.80 -5.75% 01-07-2015 5380.7 -0.69%
01-08-2015 33.40 -4.01% 01-08-2015 5537.72 2.92%
01-09-2015 28.68 -14.15% 01-09-2015 5449.09 -1.60%
01-10-2015 30.92 7.82% 01-10-2015 5592.06 2.62%
01-11-2015 25.08 -18.88% 01-11-2015 5800.24 3.72%
01-12-2015 24.22 -3.45% 01-12-2015 5703.37 -1.67%
01-01-2016 20.60 -14.95% 01-01-2016 5876.26 3.03%
01-02-2016 21.26 3.19% 01-02-2016 5955.71 1.35%
01-03-2016 24.35 14.55% 01-03-2016 5613.54 -5.75%
01-04-2016 29.82 22.48% 01-04-2016 5748.07 2.40%
01-05-2016 25.66 -13.94% 01-05-2016 5442.06 -5.32%
Corporate Finance
9
01-06-2016 27.18 5.90% 01-06-2016 5293.33 -2.73%
01-07-2016 28.25 3.96% 01-07-2016 5541.71 4.69%
01-08-2016 28.55 1.04% 01-08-2016 5573.15 0.57%
01-09-2016 33.27 16.54% 01-09-2016 5502.42 -1.27%
01-10-2016 33.62 1.07% 01-10-2016 5332.89 -3.08%
01-11-2016 36.04 7.20% 01-11-2016 5375.62 0.80%
01-12-2016 34.35 -4.69% 01-12-2016 5479.77 1.94%
01-01-2017 39.64 15.40% 01-01-2017 5542.1 1.14%
01-02-2017 36.31 -8.40% 01-02-2017 5580.19 0.69%
01-03-2017 34.87 -3.97% 01-03-2017 5737.47 2.82%
01-04-2017 34.91 0.12% 01-04-2017 5967.54 4.01%
01-05-2017 34.41 -1.43% 01-05-2017 6080.59 1.89%
01-06-2017 34.90 1.42% 01-06-2017 6183.82 1.70%
01-07-2017 40.86 17.06% 01-07-2017 6218.71 0.56%
01-08-2017 42.66 4.42% 01-08-2017 6117.69 -1.62%
01-09-2017 39.75 -6.83% 01-09-2017 6424.25 5.01%
01-10-2017 40.98 3.10% 01-10-2017 6402.77 -0.33%
01-11-2017 41.55 1.39% 01-11-2017 6601.66 3.11%
01-12-2017 45.99 10.69% 01-12-2017 6682.67 1.23%
01-01-2018 49.02 6.59% 01-01-2018 6658.04 -0.37%
01-02-2018 46.50 -5.14% 01-02-2018 6948.59 4.36%
01-03-2018 46.67 0.37% 01-03-2018 6777.29 -2.47%
06-03-2018 46.67 0.00% 06-03-2018 6845.86 1.01%
⊘ This is a preview!⊘
Do you want full access?
Subscribe today to unlock all pages.
Trusted by 1+ million students worldwide
1 out of 9
Related Documents


Your All-in-One AI-Powered Toolkit for Academic Success.
+13062052269
info@desklib.com
Available 24*7 on WhatsApp / Email
![[object Object]](/_next/static/media/star-bottom.7253800d.svg)
Unlock your academic potential
Copyright © 2020–2026 A2Z Services. All Rights Reserved. Developed and managed by ZUCOL.