FIN203 Corporate Finance: FMG Financial Analysis and Project Selection
VerifiedAdded on 2023/06/04
|9
|1698
|436
Report
AI Summary
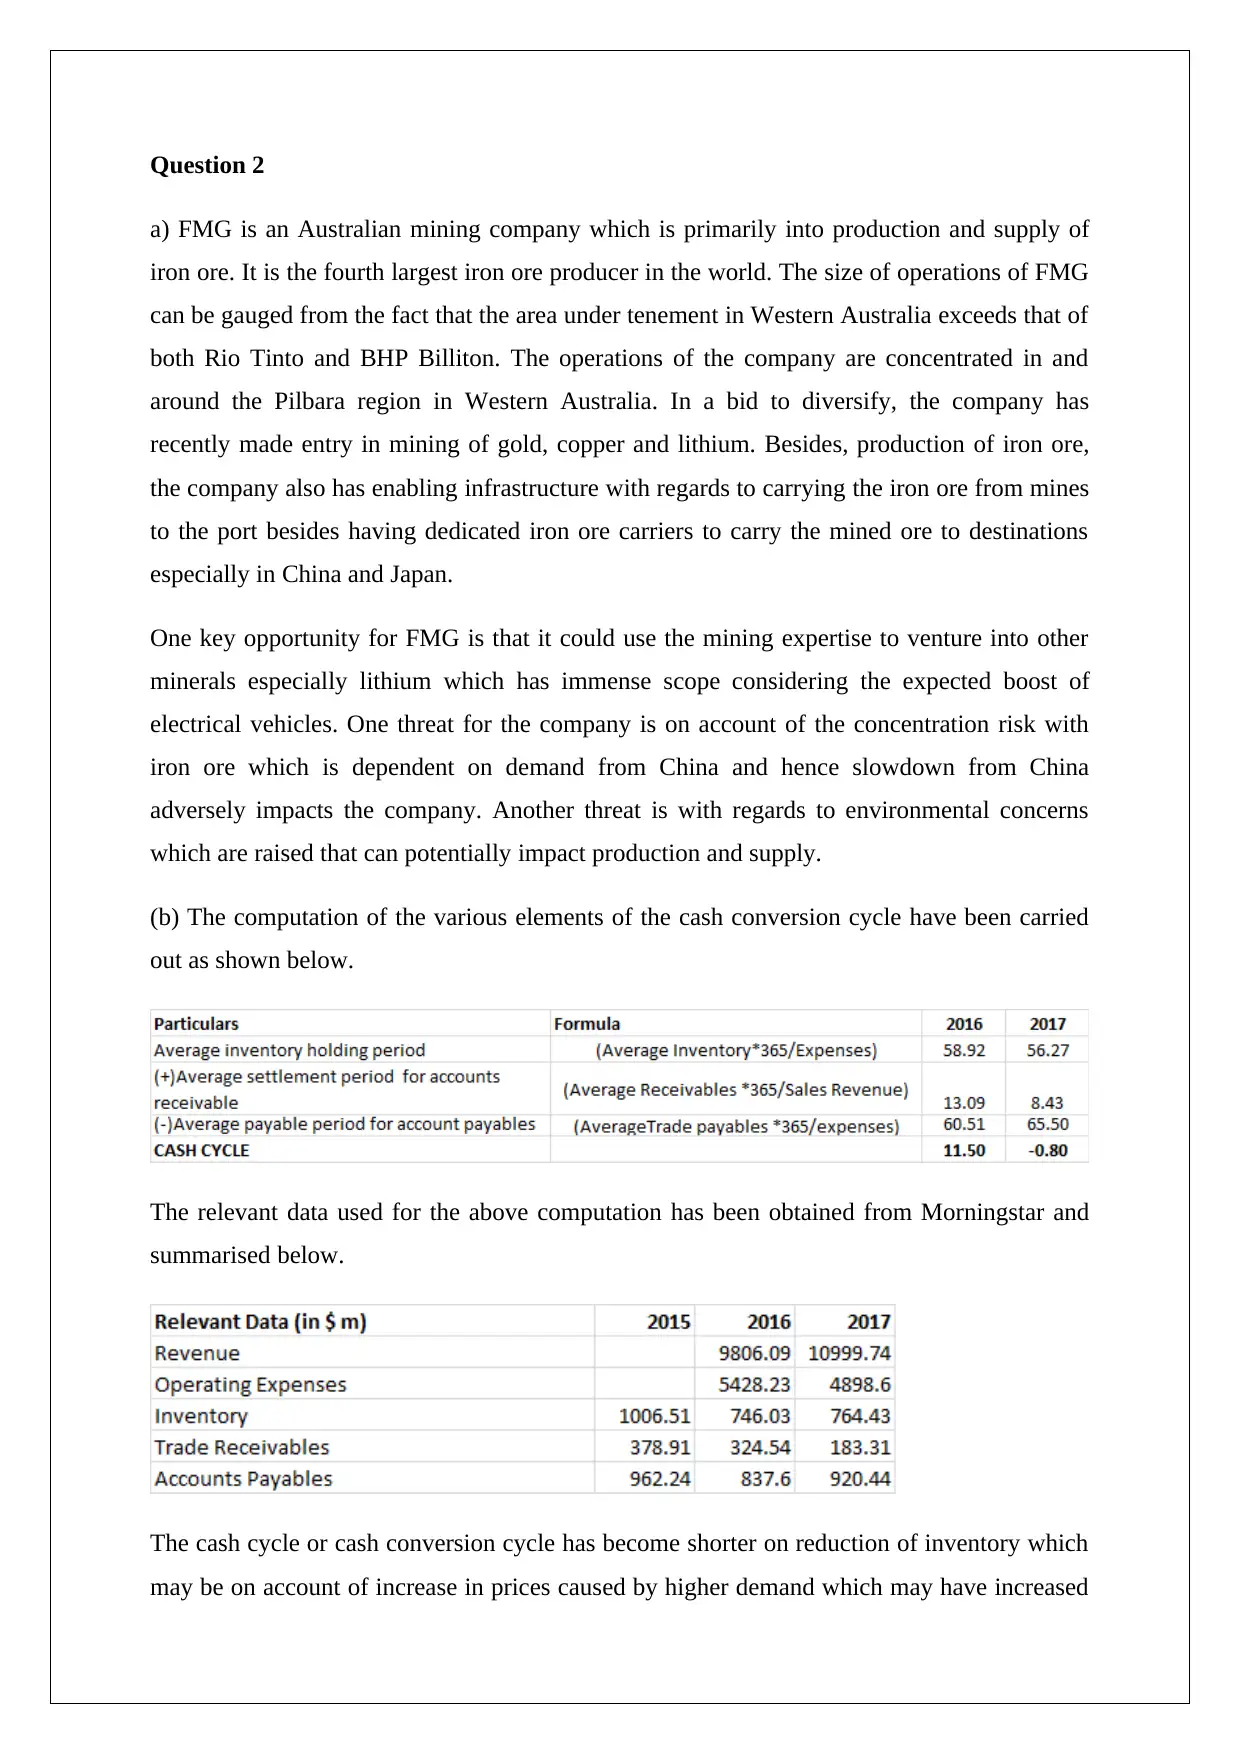
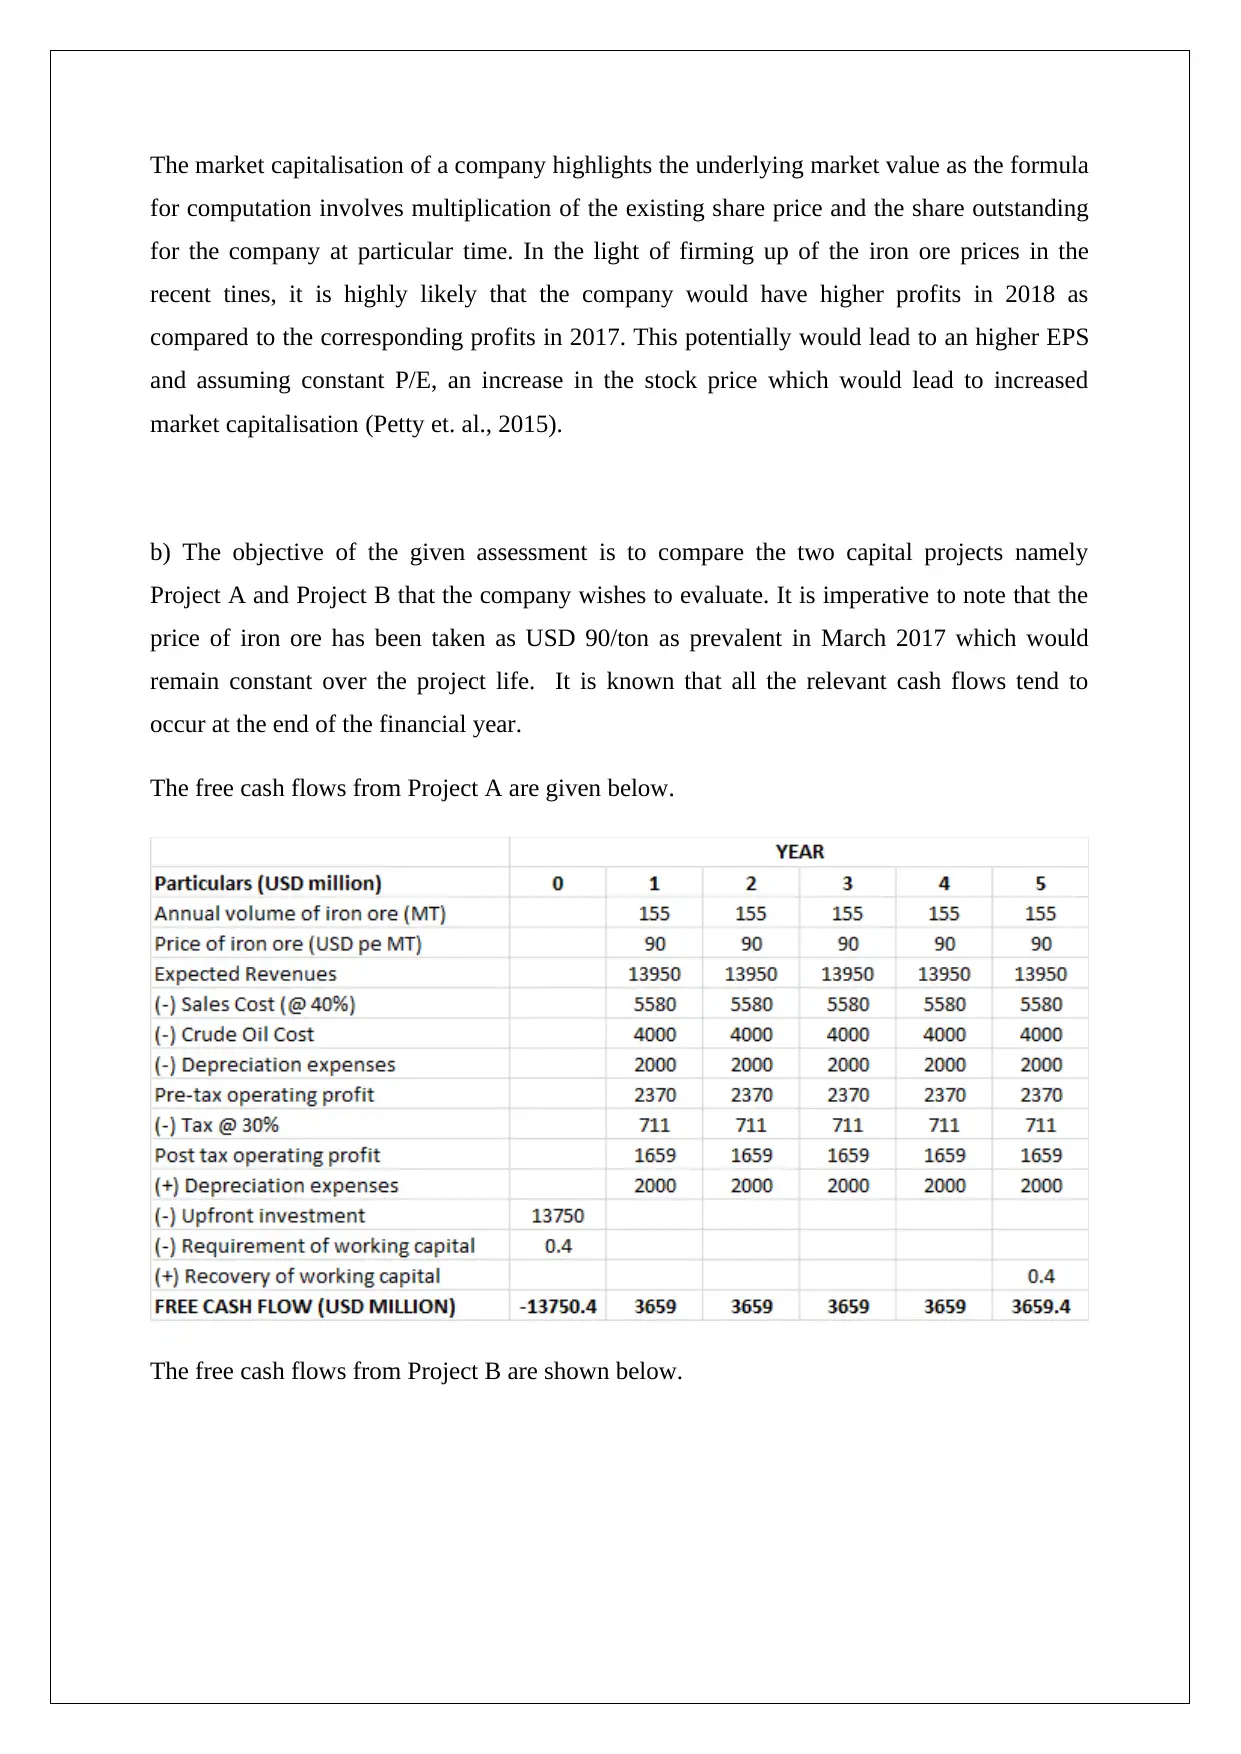
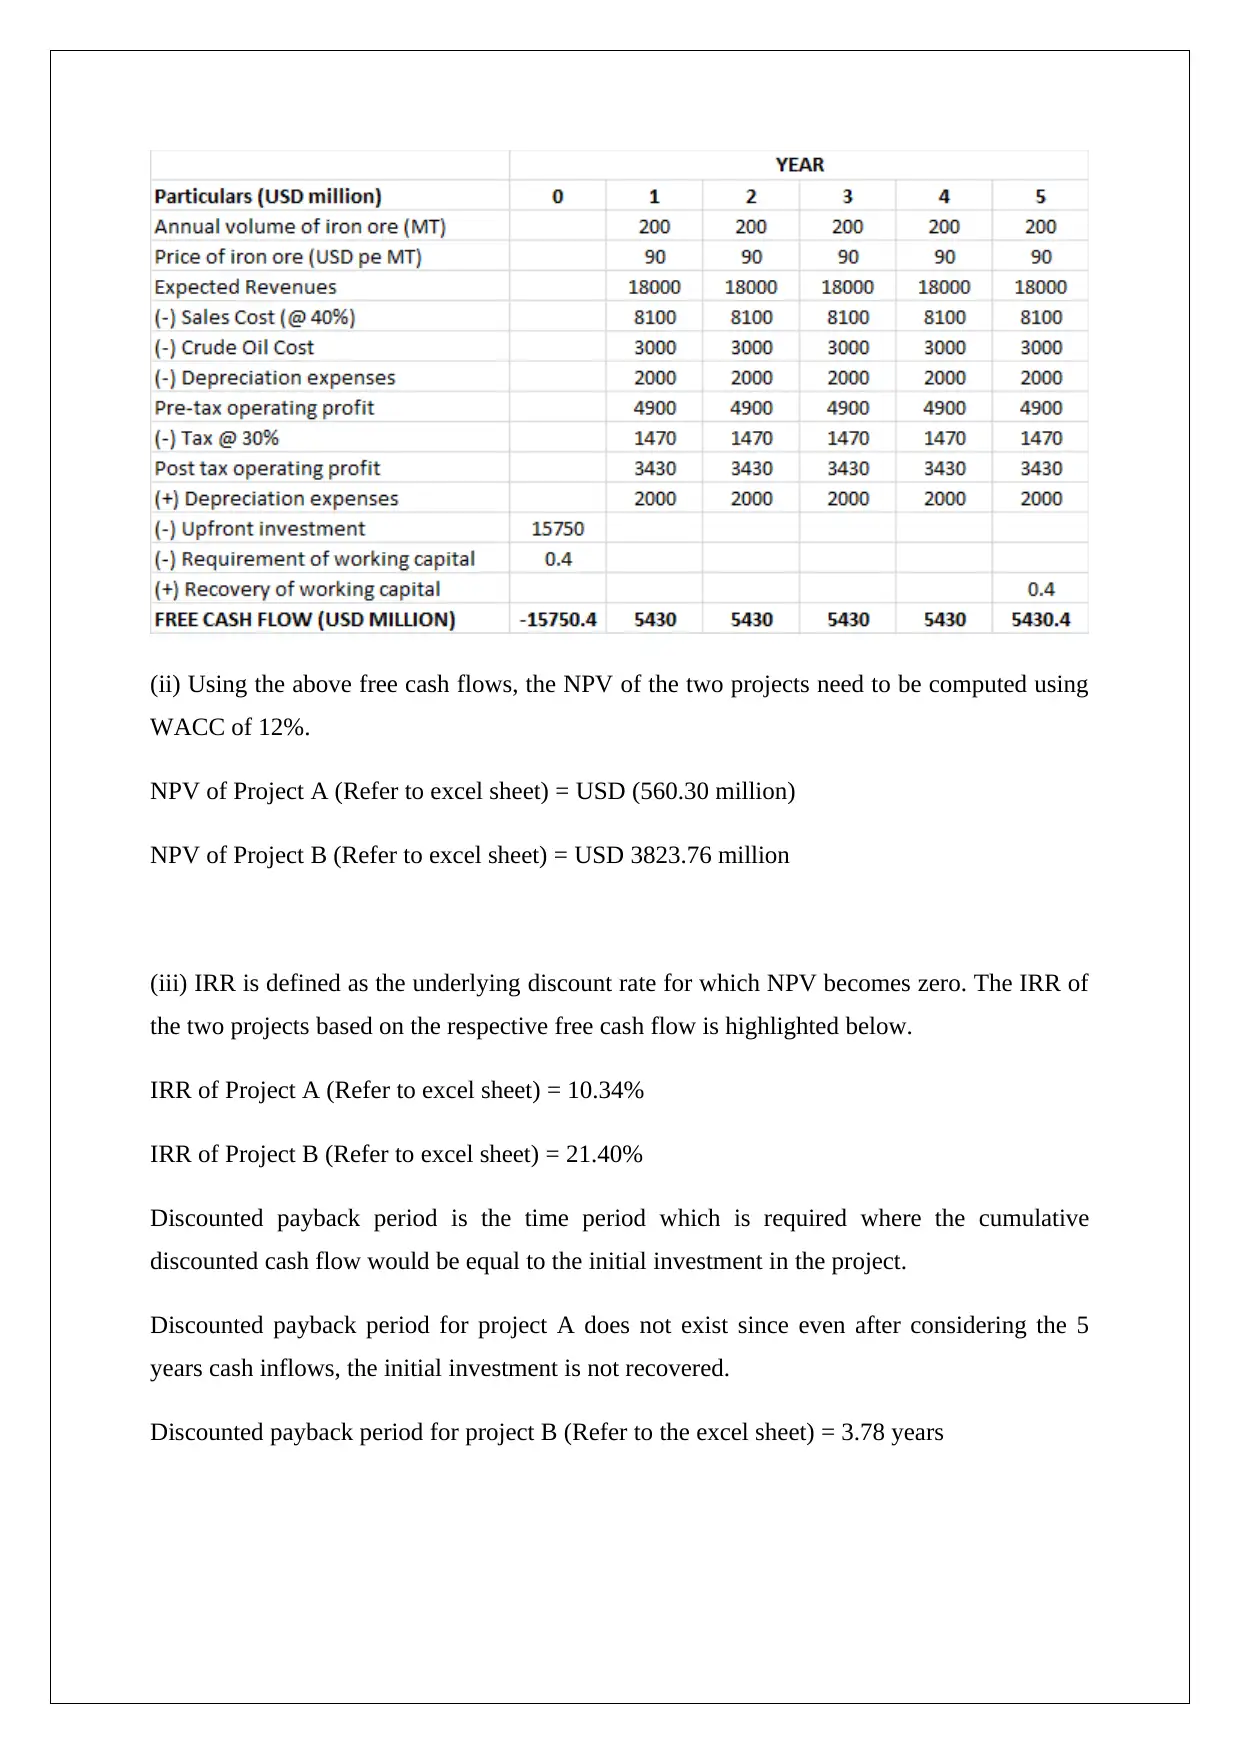
This report provides a comprehensive financial analysis of Fortescue Metals Group (FMG), an Australian mining company. It assesses FMG's opportunities and threats, including diversification into lithium and concentration risk with iron ore demand from China. The report analyzes the cash conversion cycle, capital funding through equity, and bond valuation. It uses the CAPM approach and Gordon dividend model to evaluate FMG stock. Furthermore, the report compares two capital projects (Project A and Project B) using NPV, IRR, and discounted payback period, concluding that Project B is the preferred investment. Desklib offers a platform to explore similar solved assignments and past papers for students.

1 out of 9
Related Documents


Your All-in-One AI-Powered Toolkit for Academic Success.
+13062052269
info@desklib.com
Available 24*7 on WhatsApp / Email
![[object Object]](/_next/static/media/star-bottom.7253800d.svg)
Copyright © 2020–2026 A2Z Services. All Rights Reserved. Developed and managed by ZUCOL.