Corporate Finance Assignment: Portfolio Risk and Return Analysis
VerifiedAdded on 2022/08/21
|12
|2535
|12
Homework Assignment
AI Summary
This corporate finance assignment delves into the core concepts of portfolio management, risk assessment, and return calculation. The assignment begins by explaining the calculation of share risk using standard deviation and how adding new shares affects a portfolio's risk and return profile. It examines the impact of including a risk-free asset and differentiates between systematic and unsystematic risks. The assignment then presents a series of portfolio calculations, evaluating the expected return and standard deviation of five different portfolios. The analysis includes a comparison of the risk-return trade-offs between the portfolios, exploring how different asset allocations and the inclusion of risk-free assets influence overall portfolio performance. The assignment provides a comprehensive understanding of portfolio diversification and risk management techniques.

Running head: CORPORATE FINANCE
Corporate Finance
Name of the Student:
Name of the University:
Author’s Note:
Course ID:
Corporate Finance
Name of the Student:
Name of the University:
Author’s Note:
Course ID:
Paraphrase This Document
Need a fresh take? Get an instant paraphrase of this document with our AI Paraphraser
1
CORPORATE FINANCE
Table of Contents
Part 1:...............................................................................................................................................2
Question 1: Explaining the risk of shares can be calculated by the standard deviation..............2
Question 2: Explaining how adding new shares to a portfolio can affect the risk and return of
that portfolio................................................................................................................................3
Question 3: Explaining what would happen if one of the two assets was a risk-free asset.........4
Question 4: Explaining the distinction between Systematic and Unsystematic Risk..................4
Part 2:...............................................................................................................................................5
i) Calculating the expected return and the standard deviation of Portfolio l:..............................5
ii) Calculating the expected return and the standard deviation of Portfolio 2:............................6
iii) Explaining the differences in the risks and the returns between Portfolio 1 and 2:...............6
iv) Calculating the expected return and the standard deviation of Portfolio 3:...........................7
v) Calculating the expected return and the standard deviation of Portfolio 4:............................7
vi) Calculating the expected return and the standard deviation of Portfolio 5:...........................8
vii) Explaining the differences in the risks and the returns between Portfolio 3, 4 and 5:..........9
References:....................................................................................................................................10
2
CORPORATE FINANCE
Part 1:
Question 1: Explaining the risk of shares can be calculated by the standard deviation
The standard deviation formula is mainly used for detecting the level of volatility that is
present within the overall share price valuation. The capital market continuously affects the
overall prices of the stock, where the price fluctuations is taken into consideration, while
calculating the returns. Thus, it is detected that with the implementation of the standard deviation
method, investors can detect the level of risk that is associated with the alternation in the
volatility. The stock prices are considered as the lognormal distribution, where it is detected that
Y = ln(X) is normally distributed. Hence, the stock return on daily basis is mainly compared with
the average returns or mean to determine the level of risk or volatility that is present within the
price fluctuation of the stock. Therefore, the mean of the stock is compared with the stock returns
on daily basis to determine the difference, whereas higher alteration between both the data
instigate about the high volatility present with in the stock. Thus, using the standard deviation,
actual risk associated with the volatility of the stock is detected, which would help them make
appropriate investment decisions1.
1 Briere, Marie, Kim Oosterlinck, and Ariane Szafarz. "Virtual currency, tangible return: Portfolio diversification
with bitcoin." Journal of Asset Management 16.6 (2015): 365-373.
⊘ This is a preview!⊘
Do you want full access?
Subscribe today to unlock all pages.
Trusted by 1+ million students worldwide
3
CORPORATE FINANCE
Question 2: Explaining how adding new shares to a portfolio can affect the risk and return
of that portfolio
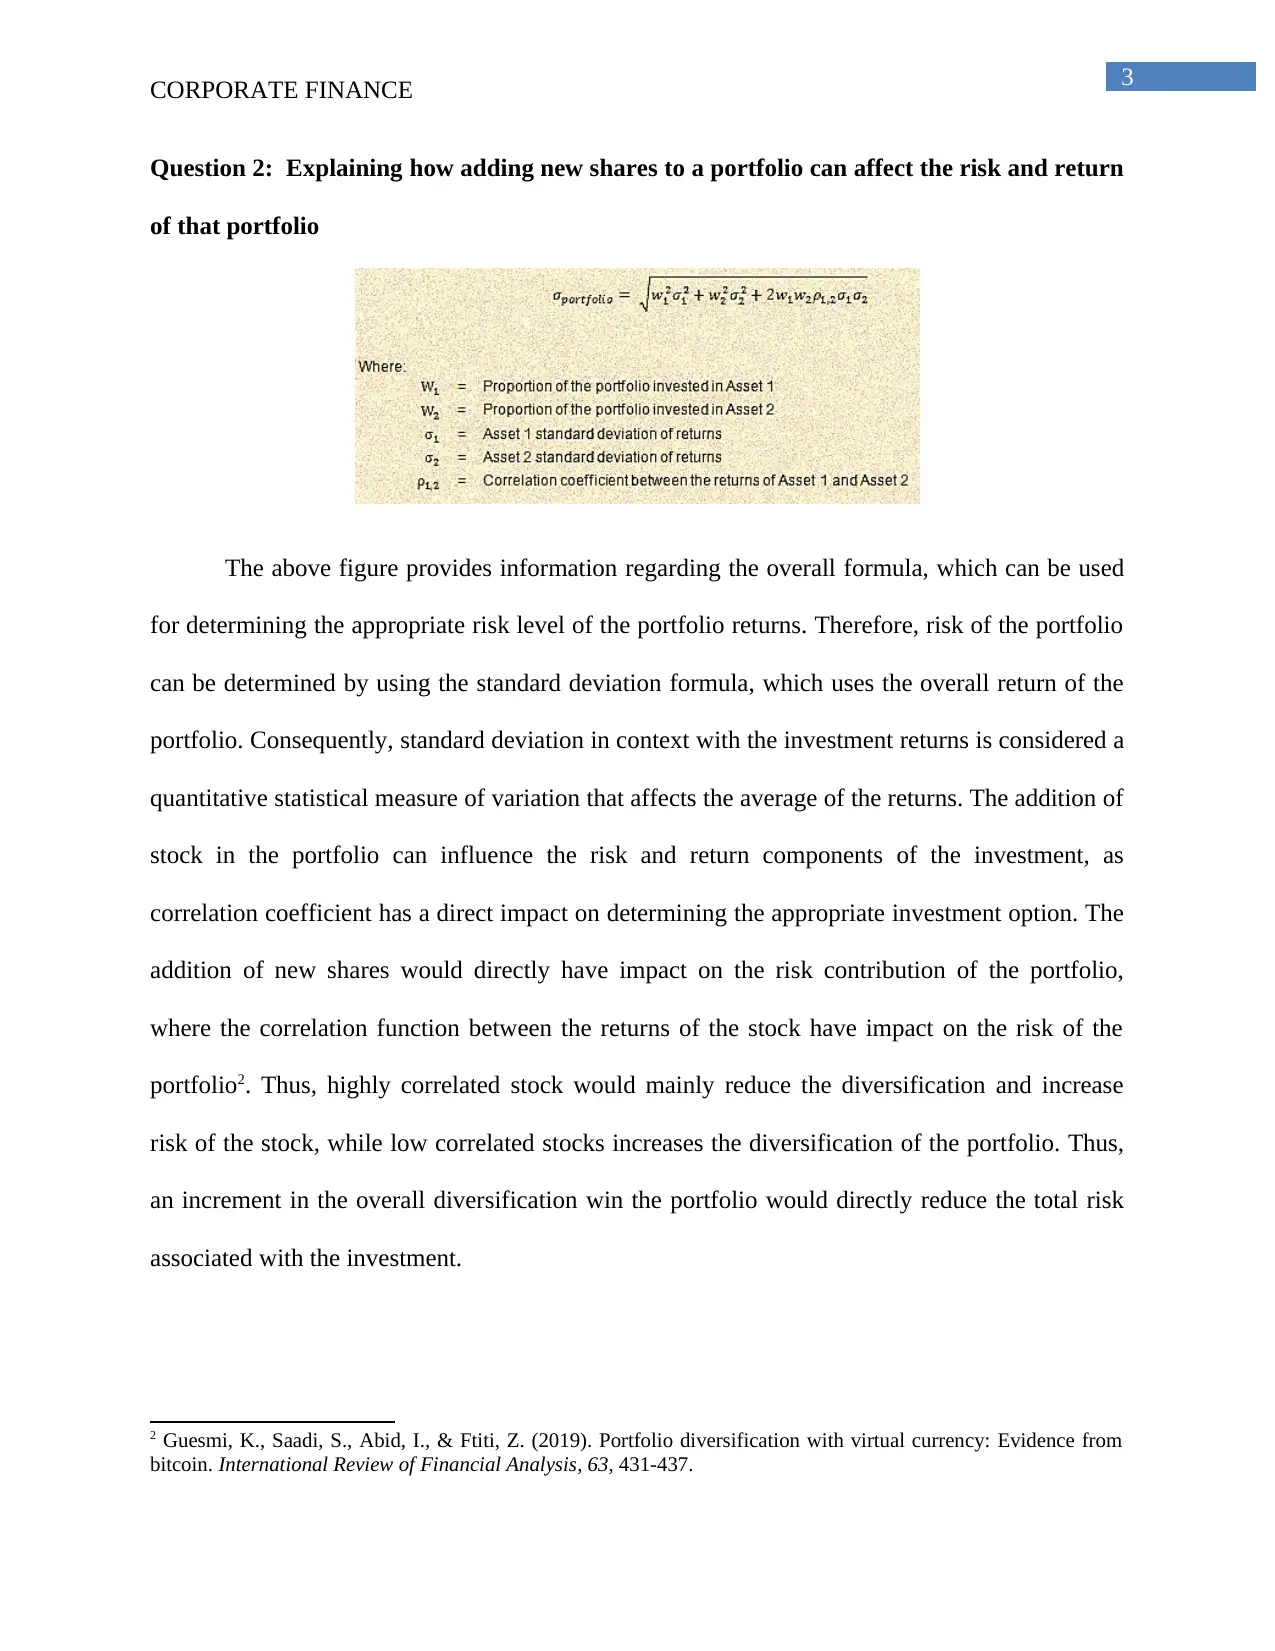
The above figure provides information regarding the overall formula, which can be used
for determining the appropriate risk level of the portfolio returns. Therefore, risk of the portfolio
can be determined by using the standard deviation formula, which uses the overall return of the
portfolio. Consequently, standard deviation in context with the investment returns is considered a
quantitative statistical measure of variation that affects the average of the returns. The addition of
stock in the portfolio can influence the risk and return components of the investment, as
correlation coefficient has a direct impact on determining the appropriate investment option. The
addition of new shares would directly have impact on the risk contribution of the portfolio,
where the correlation function between the returns of the stock have impact on the risk of the
portfolio2. Thus, highly correlated stock would mainly reduce the diversification and increase
risk of the stock, while low correlated stocks increases the diversification of the portfolio. Thus,
an increment in the overall diversification win the portfolio would directly reduce the total risk
associated with the investment.
2 Guesmi, K., Saadi, S., Abid, I., & Ftiti, Z. (2019). Portfolio diversification with virtual currency: Evidence from
bitcoin. International Review of Financial Analysis, 63, 431-437.
CORPORATE FINANCE
Question 2: Explaining how adding new shares to a portfolio can affect the risk and return
of that portfolio
The above figure provides information regarding the overall formula, which can be used
for determining the appropriate risk level of the portfolio returns. Therefore, risk of the portfolio
can be determined by using the standard deviation formula, which uses the overall return of the
portfolio. Consequently, standard deviation in context with the investment returns is considered a
quantitative statistical measure of variation that affects the average of the returns. The addition of
stock in the portfolio can influence the risk and return components of the investment, as
correlation coefficient has a direct impact on determining the appropriate investment option. The
addition of new shares would directly have impact on the risk contribution of the portfolio,
where the correlation function between the returns of the stock have impact on the risk of the
portfolio2. Thus, highly correlated stock would mainly reduce the diversification and increase
risk of the stock, while low correlated stocks increases the diversification of the portfolio. Thus,
an increment in the overall diversification win the portfolio would directly reduce the total risk
associated with the investment.
2 Guesmi, K., Saadi, S., Abid, I., & Ftiti, Z. (2019). Portfolio diversification with virtual currency: Evidence from
bitcoin. International Review of Financial Analysis, 63, 431-437.
Paraphrase This Document
Need a fresh take? Get an instant paraphrase of this document with our AI Paraphraser
4
CORPORATE FINANCE
Question 3: Explaining what would happen if one of the two assets was a risk-free asset
The combination of the two-asset portfolio with one risk free asset will only reduce the
actual risk of the risky investment. From the analysis, it has been detected that the overall
equation would mainly restrict to the risky asset, as the overall standard deviation for the risk-
free asset would be zero, while lower weights of investment in the asset would directly reduce
the actual risk attributes of the two-asset portfolio. Investors include the risk-free asset in the
portfolio to mitigate the overall risk attributes and maximize the level of returns from their
investment3.
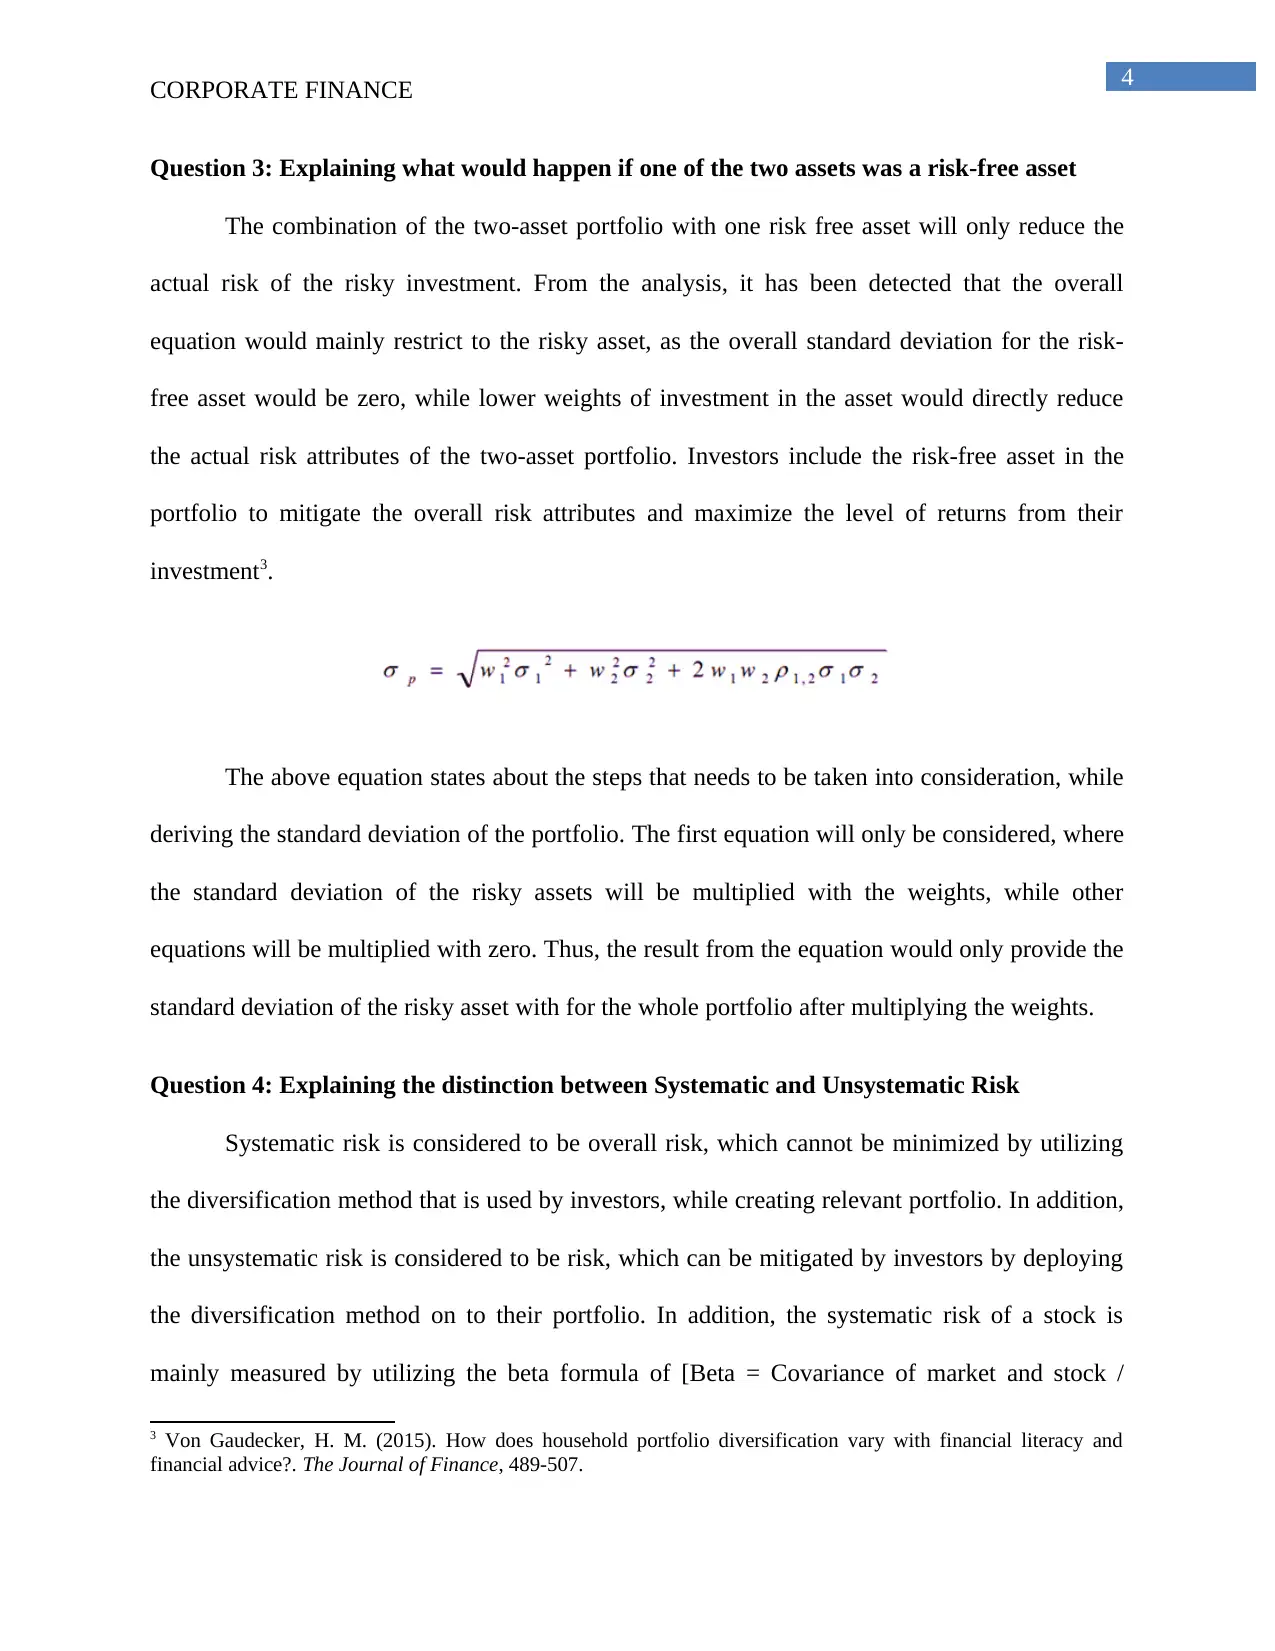
The above equation states about the steps that needs to be taken into consideration, while
deriving the standard deviation of the portfolio. The first equation will only be considered, where
the standard deviation of the risky assets will be multiplied with the weights, while other
equations will be multiplied with zero. Thus, the result from the equation would only provide the
standard deviation of the risky asset with for the whole portfolio after multiplying the weights.
Question 4: Explaining the distinction between Systematic and Unsystematic Risk
Systematic risk is considered to be overall risk, which cannot be minimized by utilizing
the diversification method that is used by investors, while creating relevant portfolio. In addition,
the unsystematic risk is considered to be risk, which can be mitigated by investors by deploying
the diversification method on to their portfolio. In addition, the systematic risk of a stock is
mainly measured by utilizing the beta formula of [Beta = Covariance of market and stock /
3 Von Gaudecker, H. M. (2015). How does household portfolio diversification vary with financial literacy and
financial advice?. The Journal of Finance, 489-507.
CORPORATE FINANCE
Question 3: Explaining what would happen if one of the two assets was a risk-free asset
The combination of the two-asset portfolio with one risk free asset will only reduce the
actual risk of the risky investment. From the analysis, it has been detected that the overall
equation would mainly restrict to the risky asset, as the overall standard deviation for the risk-
free asset would be zero, while lower weights of investment in the asset would directly reduce
the actual risk attributes of the two-asset portfolio. Investors include the risk-free asset in the
portfolio to mitigate the overall risk attributes and maximize the level of returns from their
investment3.
The above equation states about the steps that needs to be taken into consideration, while
deriving the standard deviation of the portfolio. The first equation will only be considered, where
the standard deviation of the risky assets will be multiplied with the weights, while other
equations will be multiplied with zero. Thus, the result from the equation would only provide the
standard deviation of the risky asset with for the whole portfolio after multiplying the weights.
Question 4: Explaining the distinction between Systematic and Unsystematic Risk
Systematic risk is considered to be overall risk, which cannot be minimized by utilizing
the diversification method that is used by investors, while creating relevant portfolio. In addition,
the unsystematic risk is considered to be risk, which can be mitigated by investors by deploying
the diversification method on to their portfolio. In addition, the systematic risk of a stock is
mainly measured by utilizing the beta formula of [Beta = Covariance of market and stock /
3 Von Gaudecker, H. M. (2015). How does household portfolio diversification vary with financial literacy and
financial advice?. The Journal of Finance, 489-507.
5
CORPORATE FINANCE
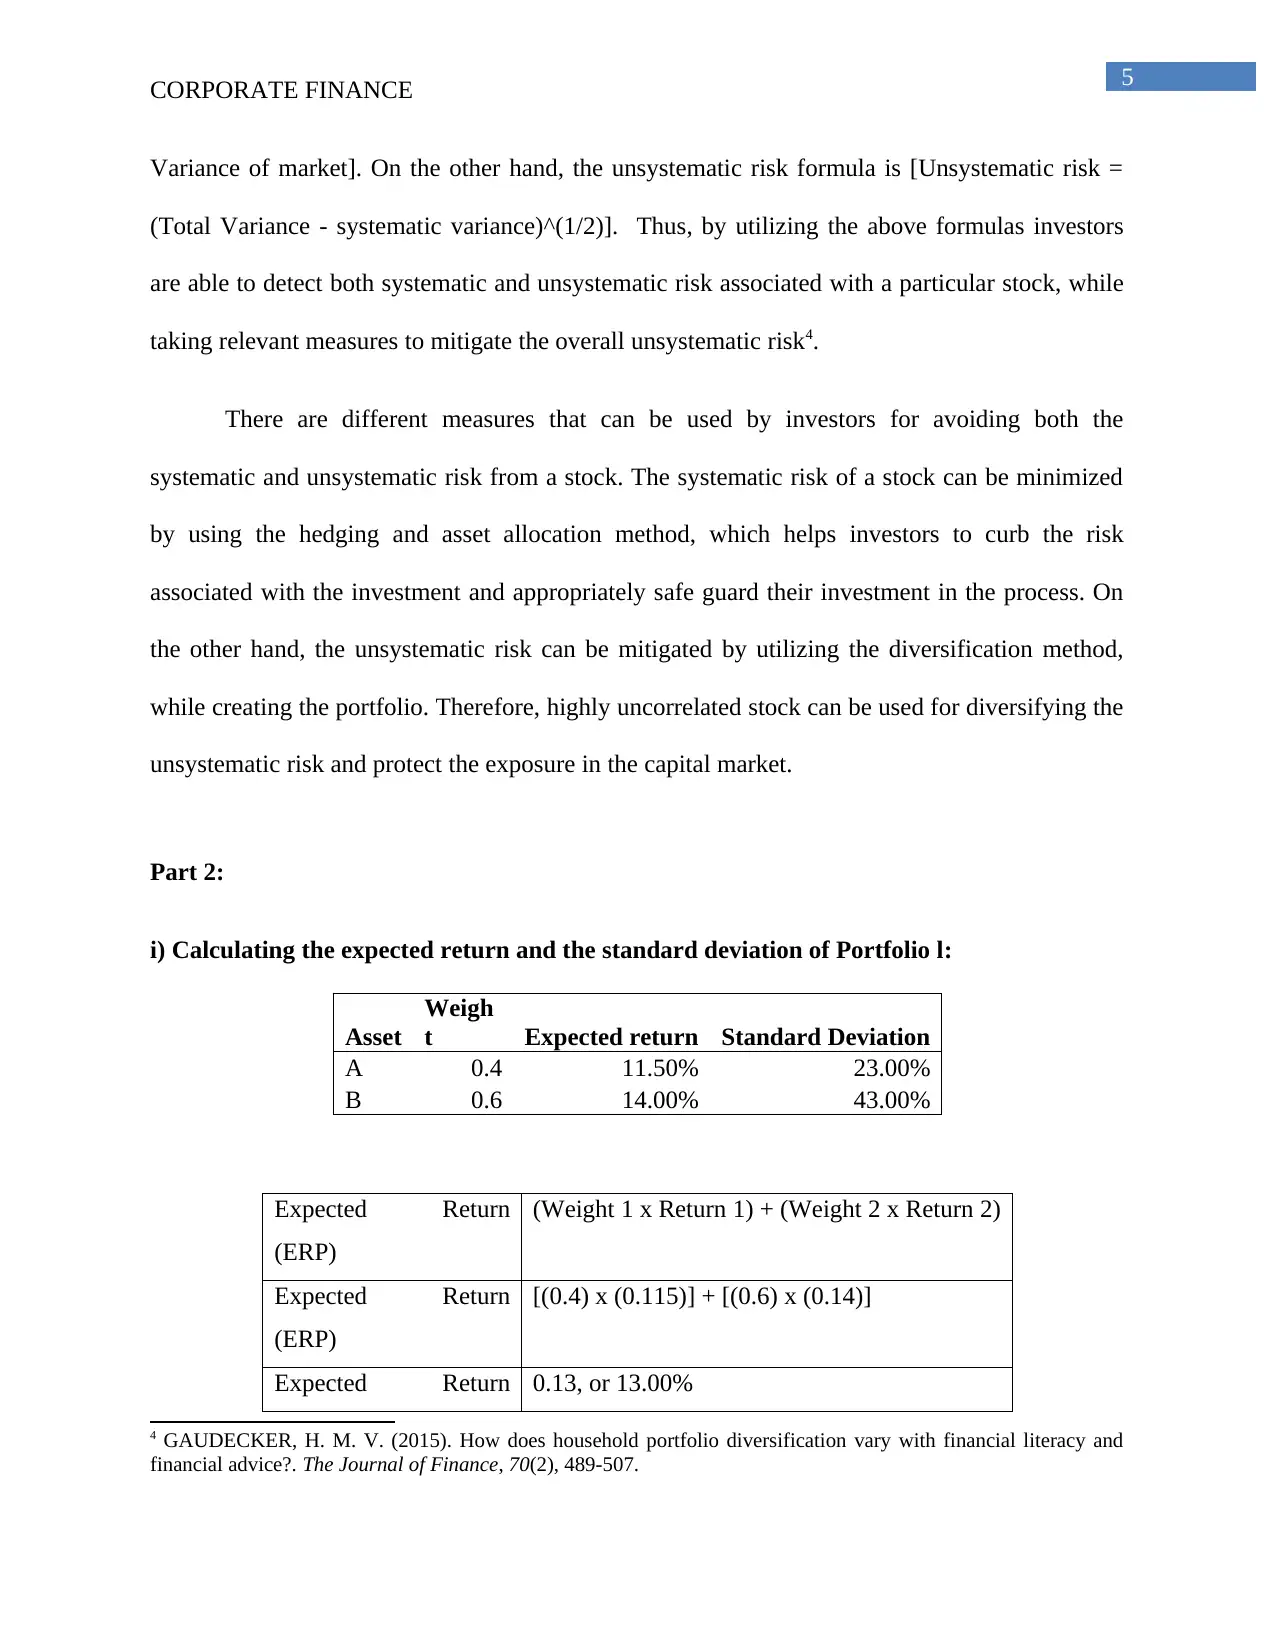
Variance of market]. On the other hand, the unsystematic risk formula is [Unsystematic risk =
(Total Variance - systematic variance)^(1/2)]. Thus, by utilizing the above formulas investors
are able to detect both systematic and unsystematic risk associated with a particular stock, while
taking relevant measures to mitigate the overall unsystematic risk4.
There are different measures that can be used by investors for avoiding both the
systematic and unsystematic risk from a stock. The systematic risk of a stock can be minimized
by using the hedging and asset allocation method, which helps investors to curb the risk
associated with the investment and appropriately safe guard their investment in the process. On
the other hand, the unsystematic risk can be mitigated by utilizing the diversification method,
while creating the portfolio. Therefore, highly uncorrelated stock can be used for diversifying the
unsystematic risk and protect the exposure in the capital market.
Part 2:
i) Calculating the expected return and the standard deviation of Portfolio l:
Asset
Weigh
t Expected return Standard Deviation
A 0.4 11.50% 23.00%
B 0.6 14.00% 43.00%
Expected Return
(ERP)
(Weight 1 x Return 1) + (Weight 2 x Return 2)
Expected Return
(ERP)
[(0.4) x (0.115)] + [(0.6) x (0.14)]
Expected Return 0.13, or 13.00%
4 GAUDECKER, H. M. V. (2015). How does household portfolio diversification vary with financial literacy and
financial advice?. The Journal of Finance, 70(2), 489-507.
CORPORATE FINANCE
Variance of market]. On the other hand, the unsystematic risk formula is [Unsystematic risk =
(Total Variance - systematic variance)^(1/2)]. Thus, by utilizing the above formulas investors
are able to detect both systematic and unsystematic risk associated with a particular stock, while
taking relevant measures to mitigate the overall unsystematic risk4.
There are different measures that can be used by investors for avoiding both the
systematic and unsystematic risk from a stock. The systematic risk of a stock can be minimized
by using the hedging and asset allocation method, which helps investors to curb the risk
associated with the investment and appropriately safe guard their investment in the process. On
the other hand, the unsystematic risk can be mitigated by utilizing the diversification method,
while creating the portfolio. Therefore, highly uncorrelated stock can be used for diversifying the
unsystematic risk and protect the exposure in the capital market.
Part 2:
i) Calculating the expected return and the standard deviation of Portfolio l:
Asset
Weigh
t Expected return Standard Deviation
A 0.4 11.50% 23.00%
B 0.6 14.00% 43.00%
Expected Return
(ERP)
(Weight 1 x Return 1) + (Weight 2 x Return 2)
Expected Return
(ERP)
[(0.4) x (0.115)] + [(0.6) x (0.14)]
Expected Return 0.13, or 13.00%
4 GAUDECKER, H. M. V. (2015). How does household portfolio diversification vary with financial literacy and
financial advice?. The Journal of Finance, 70(2), 489-507.
⊘ This is a preview!⊘
Do you want full access?
Subscribe today to unlock all pages.
Trusted by 1+ million students worldwide
6
CORPORATE FINANCE
(ERP)
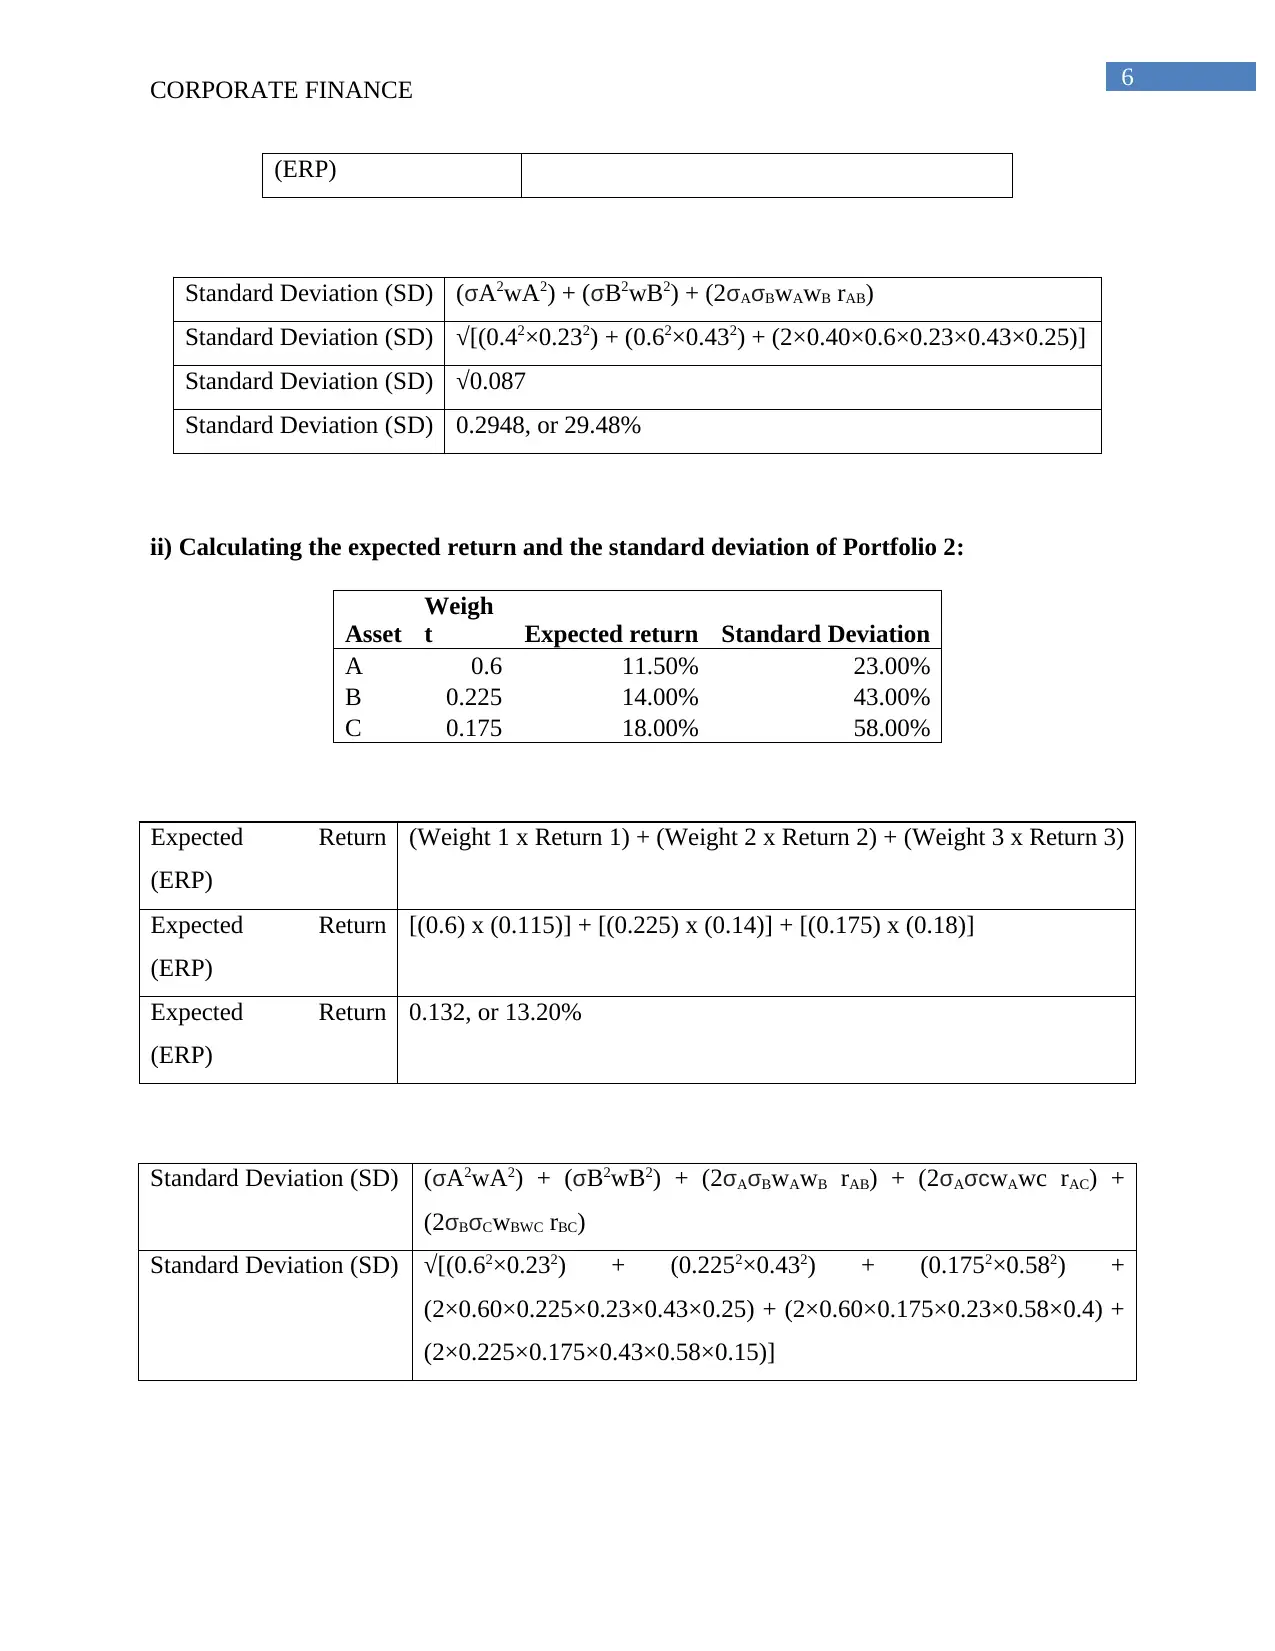
Standard Deviation (SD) (σA2wA2) + (σB2wB2) + (2σAσBwAwB rAB)
Standard Deviation (SD) √[(0.42×0.232) + (0.62×0.432) + (2×0.40×0.6×0.23×0.43×0.25)]
Standard Deviation (SD) √0.087
Standard Deviation (SD) 0.2948, or 29.48%
ii) Calculating the expected return and the standard deviation of Portfolio 2:
Asset
Weigh
t Expected return Standard Deviation
A 0.6 11.50% 23.00%
B 0.225 14.00% 43.00%
C 0.175 18.00% 58.00%
Expected Return
(ERP)
(Weight 1 x Return 1) + (Weight 2 x Return 2) + (Weight 3 x Return 3)
Expected Return
(ERP)
[(0.6) x (0.115)] + [(0.225) x (0.14)] + [(0.175) x (0.18)]
Expected Return
(ERP)
0.132, or 13.20%
Standard Deviation (SD) (σA2wA2) + (σB2wB2) + (2σAσBwAwB rAB) + (2σAσcwAwc rAC) +
(2σBσCwBWC rBC)
Standard Deviation (SD) √[(0.62×0.232) + (0.2252×0.432) + (0.1752×0.582) +
(2×0.60×0.225×0.23×0.43×0.25) + (2×0.60×0.175×0.23×0.58×0.4) +
(2×0.225×0.175×0.43×0.58×0.15)]
CORPORATE FINANCE
(ERP)
Standard Deviation (SD) (σA2wA2) + (σB2wB2) + (2σAσBwAwB rAB)
Standard Deviation (SD) √[(0.42×0.232) + (0.62×0.432) + (2×0.40×0.6×0.23×0.43×0.25)]
Standard Deviation (SD) √0.087
Standard Deviation (SD) 0.2948, or 29.48%
ii) Calculating the expected return and the standard deviation of Portfolio 2:
Asset
Weigh
t Expected return Standard Deviation
A 0.6 11.50% 23.00%
B 0.225 14.00% 43.00%
C 0.175 18.00% 58.00%
Expected Return
(ERP)
(Weight 1 x Return 1) + (Weight 2 x Return 2) + (Weight 3 x Return 3)
Expected Return
(ERP)
[(0.6) x (0.115)] + [(0.225) x (0.14)] + [(0.175) x (0.18)]
Expected Return
(ERP)
0.132, or 13.20%
Standard Deviation (SD) (σA2wA2) + (σB2wB2) + (2σAσBwAwB rAB) + (2σAσcwAwc rAC) +
(2σBσCwBWC rBC)
Standard Deviation (SD) √[(0.62×0.232) + (0.2252×0.432) + (0.1752×0.582) +
(2×0.60×0.225×0.23×0.43×0.25) + (2×0.60×0.175×0.23×0.58×0.4) +
(2×0.225×0.175×0.43×0.58×0.15)]
Paraphrase This Document
Need a fresh take? Get an instant paraphrase of this document with our AI Paraphraser
7
CORPORATE FINANCE
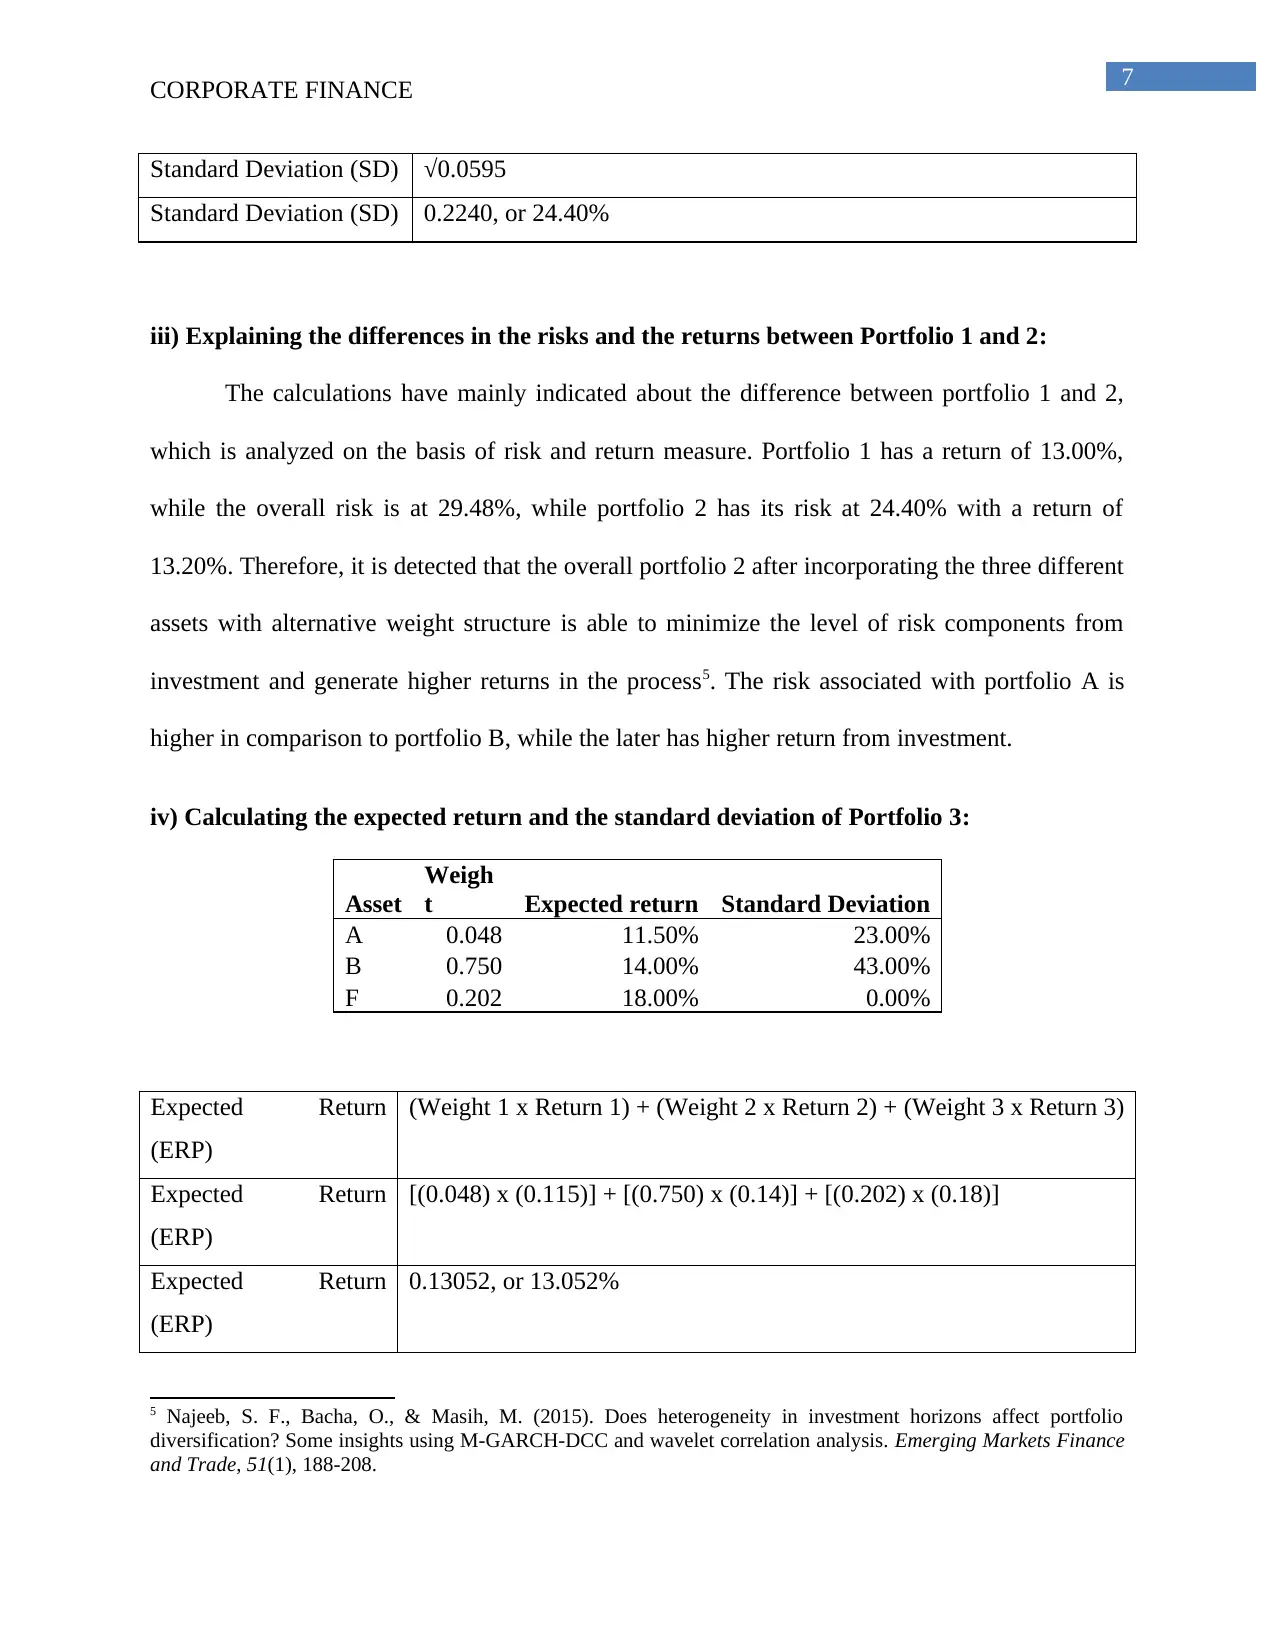
Standard Deviation (SD) √0.0595
Standard Deviation (SD) 0.2240, or 24.40%
iii) Explaining the differences in the risks and the returns between Portfolio 1 and 2:
The calculations have mainly indicated about the difference between portfolio 1 and 2,
which is analyzed on the basis of risk and return measure. Portfolio 1 has a return of 13.00%,
while the overall risk is at 29.48%, while portfolio 2 has its risk at 24.40% with a return of
13.20%. Therefore, it is detected that the overall portfolio 2 after incorporating the three different
assets with alternative weight structure is able to minimize the level of risk components from
investment and generate higher returns in the process5. The risk associated with portfolio A is
higher in comparison to portfolio B, while the later has higher return from investment.
iv) Calculating the expected return and the standard deviation of Portfolio 3:
Asset
Weigh
t Expected return Standard Deviation
A 0.048 11.50% 23.00%
B 0.750 14.00% 43.00%
F 0.202 18.00% 0.00%
Expected Return
(ERP)
(Weight 1 x Return 1) + (Weight 2 x Return 2) + (Weight 3 x Return 3)
Expected Return
(ERP)
[(0.048) x (0.115)] + [(0.750) x (0.14)] + [(0.202) x (0.18)]
Expected Return
(ERP)
0.13052, or 13.052%
5 Najeeb, S. F., Bacha, O., & Masih, M. (2015). Does heterogeneity in investment horizons affect portfolio
diversification? Some insights using M-GARCH-DCC and wavelet correlation analysis. Emerging Markets Finance
and Trade, 51(1), 188-208.
CORPORATE FINANCE
Standard Deviation (SD) √0.0595
Standard Deviation (SD) 0.2240, or 24.40%
iii) Explaining the differences in the risks and the returns between Portfolio 1 and 2:
The calculations have mainly indicated about the difference between portfolio 1 and 2,
which is analyzed on the basis of risk and return measure. Portfolio 1 has a return of 13.00%,
while the overall risk is at 29.48%, while portfolio 2 has its risk at 24.40% with a return of
13.20%. Therefore, it is detected that the overall portfolio 2 after incorporating the three different
assets with alternative weight structure is able to minimize the level of risk components from
investment and generate higher returns in the process5. The risk associated with portfolio A is
higher in comparison to portfolio B, while the later has higher return from investment.
iv) Calculating the expected return and the standard deviation of Portfolio 3:
Asset
Weigh
t Expected return Standard Deviation
A 0.048 11.50% 23.00%
B 0.750 14.00% 43.00%
F 0.202 18.00% 0.00%
Expected Return
(ERP)
(Weight 1 x Return 1) + (Weight 2 x Return 2) + (Weight 3 x Return 3)
Expected Return
(ERP)
[(0.048) x (0.115)] + [(0.750) x (0.14)] + [(0.202) x (0.18)]
Expected Return
(ERP)
0.13052, or 13.052%
5 Najeeb, S. F., Bacha, O., & Masih, M. (2015). Does heterogeneity in investment horizons affect portfolio
diversification? Some insights using M-GARCH-DCC and wavelet correlation analysis. Emerging Markets Finance
and Trade, 51(1), 188-208.
8
CORPORATE FINANCE
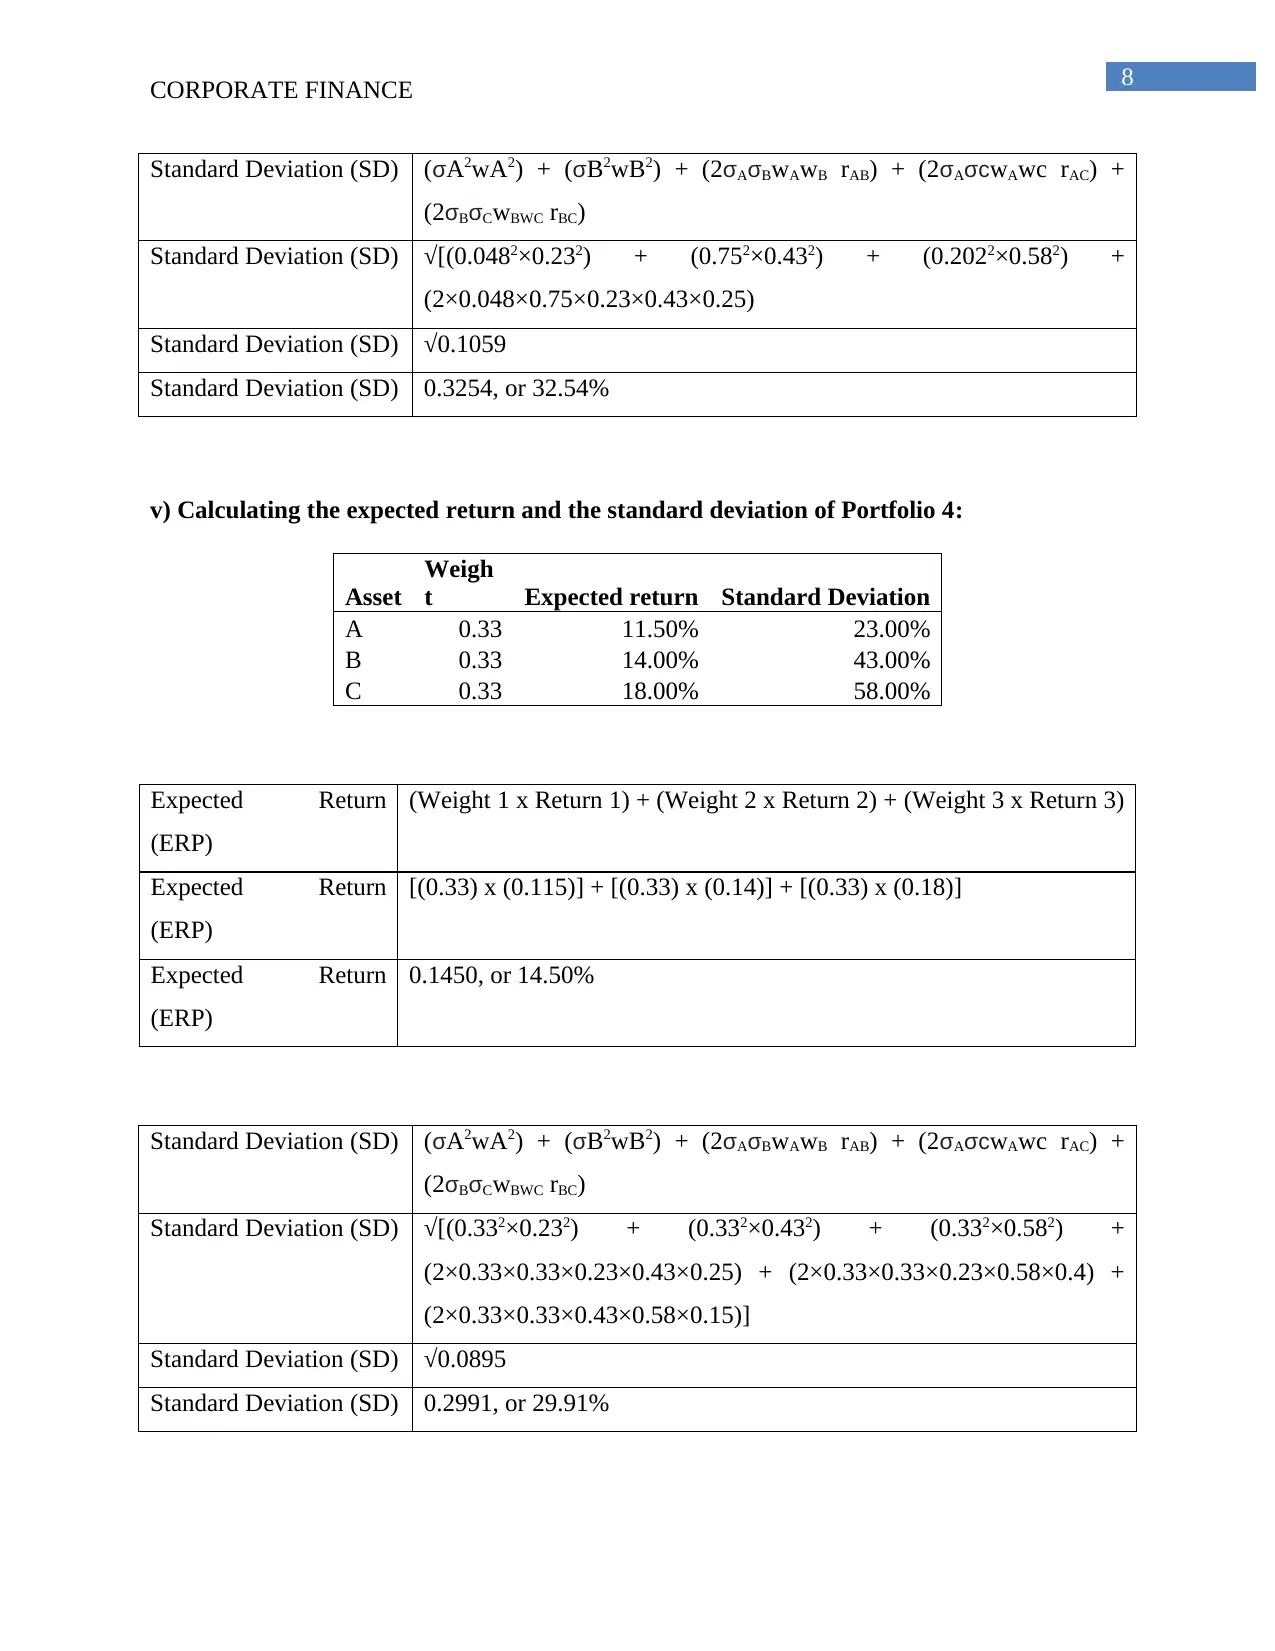
Standard Deviation (SD) (σA2wA2) + (σB2wB2) + (2σAσBwAwB rAB) + (2σAσcwAwc rAC) +
(2σBσCwBWC rBC)
Standard Deviation (SD) √[(0.0482×0.232) + (0.752×0.432) + (0.2022×0.582) +
(2×0.048×0.75×0.23×0.43×0.25)
Standard Deviation (SD) √0.1059
Standard Deviation (SD) 0.3254, or 32.54%
v) Calculating the expected return and the standard deviation of Portfolio 4:
Asset
Weigh
t Expected return Standard Deviation
A 0.33 11.50% 23.00%
B 0.33 14.00% 43.00%
C 0.33 18.00% 58.00%
Expected Return
(ERP)
(Weight 1 x Return 1) + (Weight 2 x Return 2) + (Weight 3 x Return 3)
Expected Return
(ERP)
[(0.33) x (0.115)] + [(0.33) x (0.14)] + [(0.33) x (0.18)]
Expected Return
(ERP)
0.1450, or 14.50%
Standard Deviation (SD) (σA2wA2) + (σB2wB2) + (2σAσBwAwB rAB) + (2σAσcwAwc rAC) +
(2σBσCwBWC rBC)
Standard Deviation (SD) √[(0.332×0.232) + (0.332×0.432) + (0.332×0.582) +
(2×0.33×0.33×0.23×0.43×0.25) + (2×0.33×0.33×0.23×0.58×0.4) +
(2×0.33×0.33×0.43×0.58×0.15)]
Standard Deviation (SD) √0.0895
Standard Deviation (SD) 0.2991, or 29.91%
CORPORATE FINANCE
Standard Deviation (SD) (σA2wA2) + (σB2wB2) + (2σAσBwAwB rAB) + (2σAσcwAwc rAC) +
(2σBσCwBWC rBC)
Standard Deviation (SD) √[(0.0482×0.232) + (0.752×0.432) + (0.2022×0.582) +
(2×0.048×0.75×0.23×0.43×0.25)
Standard Deviation (SD) √0.1059
Standard Deviation (SD) 0.3254, or 32.54%
v) Calculating the expected return and the standard deviation of Portfolio 4:
Asset
Weigh
t Expected return Standard Deviation
A 0.33 11.50% 23.00%
B 0.33 14.00% 43.00%
C 0.33 18.00% 58.00%
Expected Return
(ERP)
(Weight 1 x Return 1) + (Weight 2 x Return 2) + (Weight 3 x Return 3)
Expected Return
(ERP)
[(0.33) x (0.115)] + [(0.33) x (0.14)] + [(0.33) x (0.18)]
Expected Return
(ERP)
0.1450, or 14.50%
Standard Deviation (SD) (σA2wA2) + (σB2wB2) + (2σAσBwAwB rAB) + (2σAσcwAwc rAC) +
(2σBσCwBWC rBC)
Standard Deviation (SD) √[(0.332×0.232) + (0.332×0.432) + (0.332×0.582) +
(2×0.33×0.33×0.23×0.43×0.25) + (2×0.33×0.33×0.23×0.58×0.4) +
(2×0.33×0.33×0.43×0.58×0.15)]
Standard Deviation (SD) √0.0895
Standard Deviation (SD) 0.2991, or 29.91%
⊘ This is a preview!⊘
Do you want full access?
Subscribe today to unlock all pages.
Trusted by 1+ million students worldwide
9
CORPORATE FINANCE
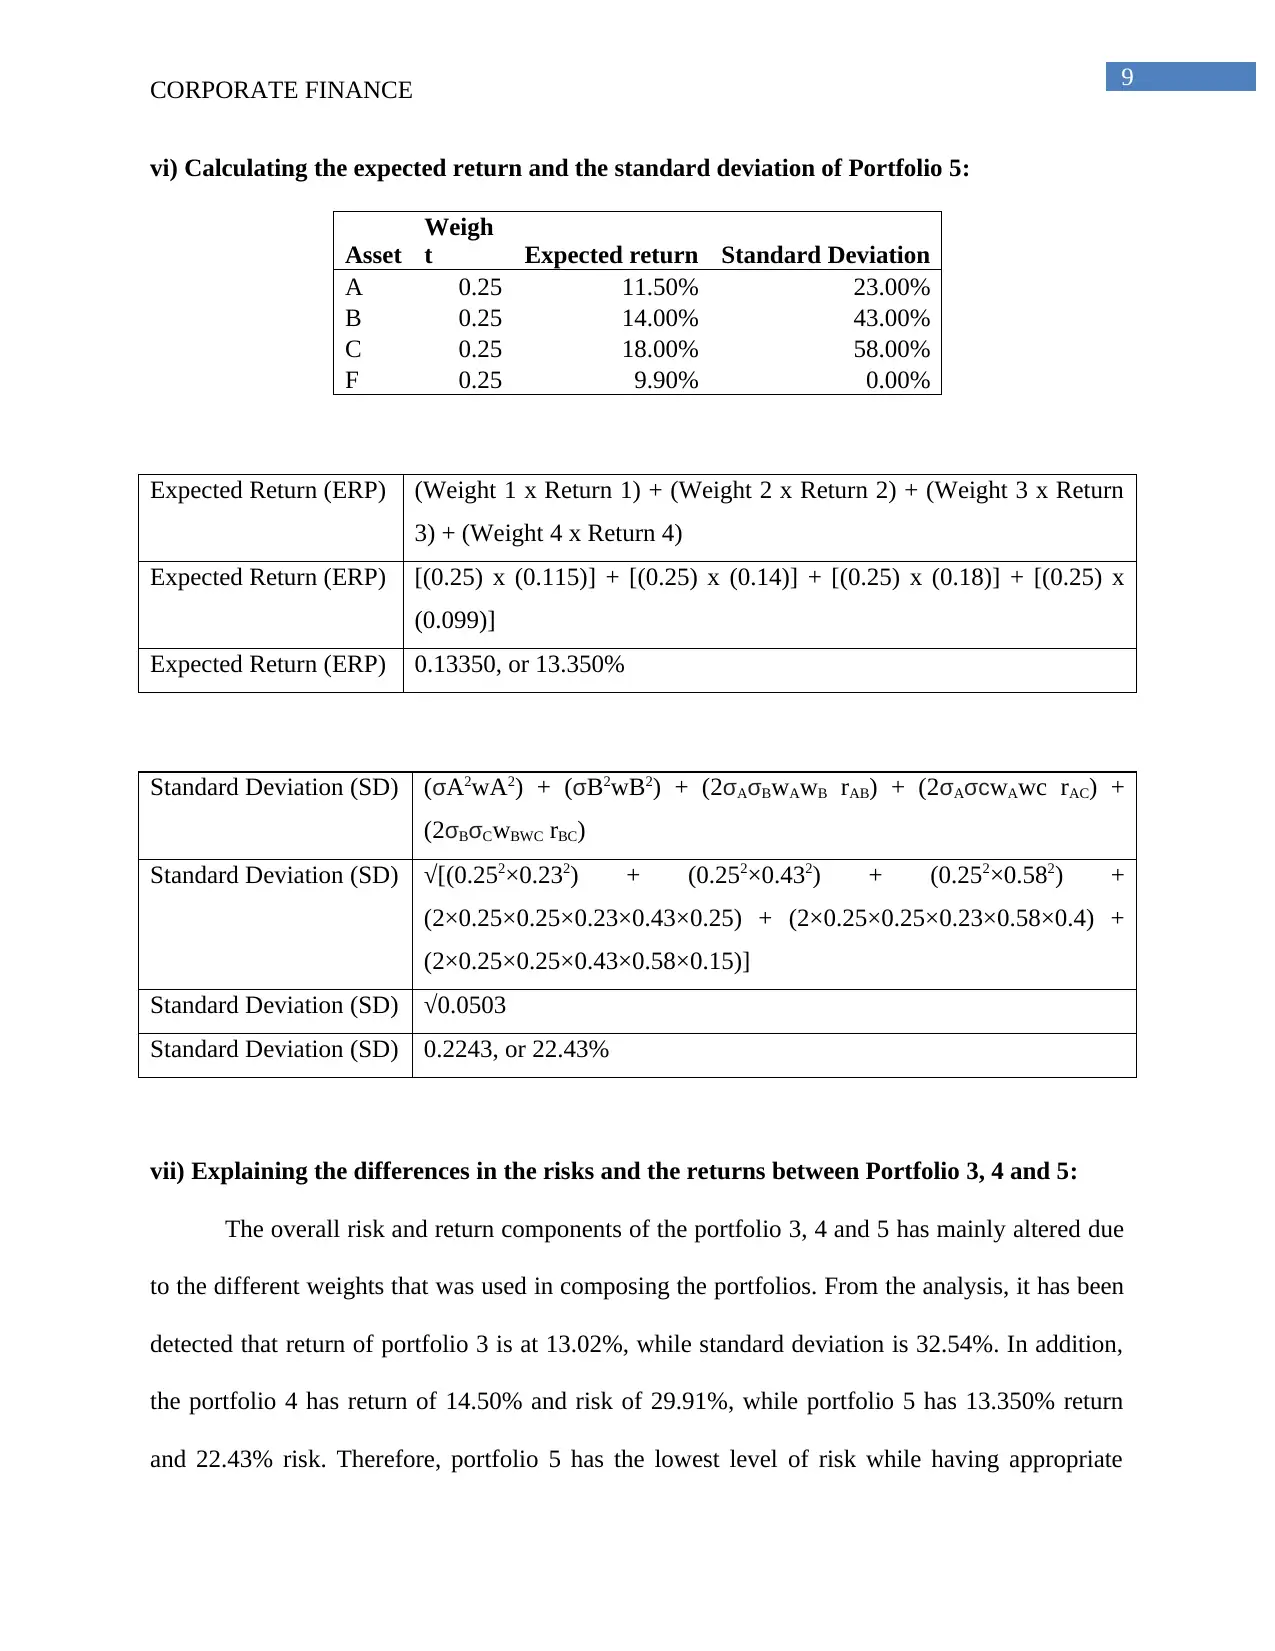
vi) Calculating the expected return and the standard deviation of Portfolio 5:
Asset
Weigh
t Expected return Standard Deviation
A 0.25 11.50% 23.00%
B 0.25 14.00% 43.00%
C 0.25 18.00% 58.00%
F 0.25 9.90% 0.00%
Expected Return (ERP) (Weight 1 x Return 1) + (Weight 2 x Return 2) + (Weight 3 x Return
3) + (Weight 4 x Return 4)
Expected Return (ERP) [(0.25) x (0.115)] + [(0.25) x (0.14)] + [(0.25) x (0.18)] + [(0.25) x
(0.099)]
Expected Return (ERP) 0.13350, or 13.350%
Standard Deviation (SD) (σA2wA2) + (σB2wB2) + (2σAσBwAwB rAB) + (2σAσcwAwc rAC) +
(2σBσCwBWC rBC)
Standard Deviation (SD) √[(0.252×0.232) + (0.252×0.432) + (0.252×0.582) +
(2×0.25×0.25×0.23×0.43×0.25) + (2×0.25×0.25×0.23×0.58×0.4) +
(2×0.25×0.25×0.43×0.58×0.15)]
Standard Deviation (SD) √0.0503
Standard Deviation (SD) 0.2243, or 22.43%
vii) Explaining the differences in the risks and the returns between Portfolio 3, 4 and 5:
The overall risk and return components of the portfolio 3, 4 and 5 has mainly altered due
to the different weights that was used in composing the portfolios. From the analysis, it has been
detected that return of portfolio 3 is at 13.02%, while standard deviation is 32.54%. In addition,
the portfolio 4 has return of 14.50% and risk of 29.91%, while portfolio 5 has 13.350% return
and 22.43% risk. Therefore, portfolio 5 has the lowest level of risk while having appropriate
CORPORATE FINANCE
vi) Calculating the expected return and the standard deviation of Portfolio 5:
Asset
Weigh
t Expected return Standard Deviation
A 0.25 11.50% 23.00%
B 0.25 14.00% 43.00%
C 0.25 18.00% 58.00%
F 0.25 9.90% 0.00%
Expected Return (ERP) (Weight 1 x Return 1) + (Weight 2 x Return 2) + (Weight 3 x Return
3) + (Weight 4 x Return 4)
Expected Return (ERP) [(0.25) x (0.115)] + [(0.25) x (0.14)] + [(0.25) x (0.18)] + [(0.25) x
(0.099)]
Expected Return (ERP) 0.13350, or 13.350%
Standard Deviation (SD) (σA2wA2) + (σB2wB2) + (2σAσBwAwB rAB) + (2σAσcwAwc rAC) +
(2σBσCwBWC rBC)
Standard Deviation (SD) √[(0.252×0.232) + (0.252×0.432) + (0.252×0.582) +
(2×0.25×0.25×0.23×0.43×0.25) + (2×0.25×0.25×0.23×0.58×0.4) +
(2×0.25×0.25×0.43×0.58×0.15)]
Standard Deviation (SD) √0.0503
Standard Deviation (SD) 0.2243, or 22.43%
vii) Explaining the differences in the risks and the returns between Portfolio 3, 4 and 5:
The overall risk and return components of the portfolio 3, 4 and 5 has mainly altered due
to the different weights that was used in composing the portfolios. From the analysis, it has been
detected that return of portfolio 3 is at 13.02%, while standard deviation is 32.54%. In addition,
the portfolio 4 has return of 14.50% and risk of 29.91%, while portfolio 5 has 13.350% return
and 22.43% risk. Therefore, portfolio 5 has the lowest level of risk while having appropriate
Paraphrase This Document
Need a fresh take? Get an instant paraphrase of this document with our AI Paraphraser

10
CORPORATE FINANCE
returns from investment6. Thus, it has detected that accommodating the risk-free asset would
allow the investors to minimize the level of risk from portfolio.
6 Lean, H. H., & Wong, W. K. (2015). Is gold good for portfolio diversification? A stochastic dominance analysis of
the Paris stock exchange. International Review of Financial Analysis, 42, 98-108.
11
CORPORATE FINANCE
References:
Briere, Marie, Kim Oosterlinck, and Ariane Szafarz. "Virtual currency, tangible return: Portfolio
diversification with bitcoin." Journal of Asset Management 16.6 (2015): 365-373.
GAUDECKER, H. M. V. (2015). How does household portfolio diversification vary with
financial literacy and financial advice?. The Journal of Finance, 70(2), 489-507.
Guesmi, K., Saadi, S., Abid, I., & Ftiti, Z. (2019). Portfolio diversification with virtual currency:
Evidence from bitcoin. International Review of Financial Analysis, 63, 431-437.
Lean, H. H., & Wong, W. K. (2015). Is gold good for portfolio diversification? A stochastic
dominance analysis of the Paris stock exchange. International Review of Financial Analysis, 42,
98-108.
Najeeb, S. F., Bacha, O., & Masih, M. (2015). Does heterogeneity in investment horizons affect
portfolio diversification? Some insights using M-GARCH-DCC and wavelet correlation
analysis. Emerging Markets Finance and Trade, 51(1), 188-208.
Von Gaudecker, H. M. (2015). How does household portfolio diversification vary with financial
literacy and financial advice?. The Journal of Finance, 489-507.
⊘ This is a preview!⊘
Do you want full access?
Subscribe today to unlock all pages.
Trusted by 1+ million students worldwide
1 out of 12
Related Documents


Your All-in-One AI-Powered Toolkit for Academic Success.
+13062052269
info@desklib.com
Available 24*7 on WhatsApp / Email
![[object Object]](/_next/static/media/star-bottom.7253800d.svg)
Unlock your academic potential
Copyright © 2020–2026 A2Z Services. All Rights Reserved. Developed and managed by ZUCOL.