Corporate Finance Report: Wonderpump Investment Analysis for AGT Plc
VerifiedAdded on 2019/12/28
|15
|2408
|206
Report
AI Summary
This report provides a comprehensive analysis of AGT Plc's corporate finance, focusing on the proposed investment in Wonderpump. It begins with a cash flow forecast, detailing the company's financial performance from 2012 to 2021 and calculating the Net Present Value (NPV), Internal Rate of Return (IRR), and Average Rate of Return (ARR) of the investment. The report then critically evaluates various investment appraisal techniques, including Payback Period, ARR, IRR, and NPV, highlighting their strengths and weaknesses. A sensitivity analysis is performed to assess the impact of changes in the cost of capital on the investment's viability. Furthermore, the report discusses the merits of debt and equity financing and assesses the impact of the discount rate on AGT's capital structure. The conclusion summarizes the findings and recommends that AGT Plc proceed with the Wonderpump investment.

Corporate Finance
Paraphrase This Document
Need a fresh take? Get an instant paraphrase of this document with our AI Paraphraser
Table of Contents
INTRODUCTION ..........................................................................................................................3
1. Preparing a cash flow forecast of Wonderpump .....................................................................3
2. Assessing the proposed investment by using the capital budgeting tools ..............................5
3. Critically evaluate the investment appraisal techniques .........................................................6
4. ..................................................................................................................................................8
a. Performing a sensitivity analysis or calculation ......................................................................8
b. Giving comment on Gunther .................................................................................................9
5. Reassessing the Wonderpump investment.............................................................................11
6. ...............................................................................................................................................12
A. Merits of debt and equity financing......................................................................................12
b. Assessing the impact of discount rate on AGT’s structure .................................................12
CONCLUSION .............................................................................................................................13
REFERENCES .............................................................................................................................14
INTRODUCTION
Corporate finance lays more emphasis on increasing value of firm to the shareholders.
This field of finance makes more focus on effective allocation of the financial resources which
aid the growth and success of firm. Besides this, corporate finance also focuses on the
developing highly suitable financial structure that makes contribution in the attainment of
organizational goals and objectives. The present report is based on the case situation of AGT Plc
which is a large sized chemical and engineering business organization. Further, it is also listed on
the recognized stock exchange of London. Hence, the present report will shed light cash position
of the firm. Besides this, it will also provide deeper insight about the extent to which investment
appraisal tools and sensitivity analysis assists in making suitable decision.
1. Preparing a cash flow forecast of Wonderpump
Cash flow statement furnishes information regarding the revenue generated by the firm
during the specified time frame. Besides this, it also provides deeper insight regarding the
amount invested by the firm for performing the business activities and functions (Damodaran,
2016). This in turn provides information to the business unit about net cash flow position or
aspects and thereby assists in making suitable decision.
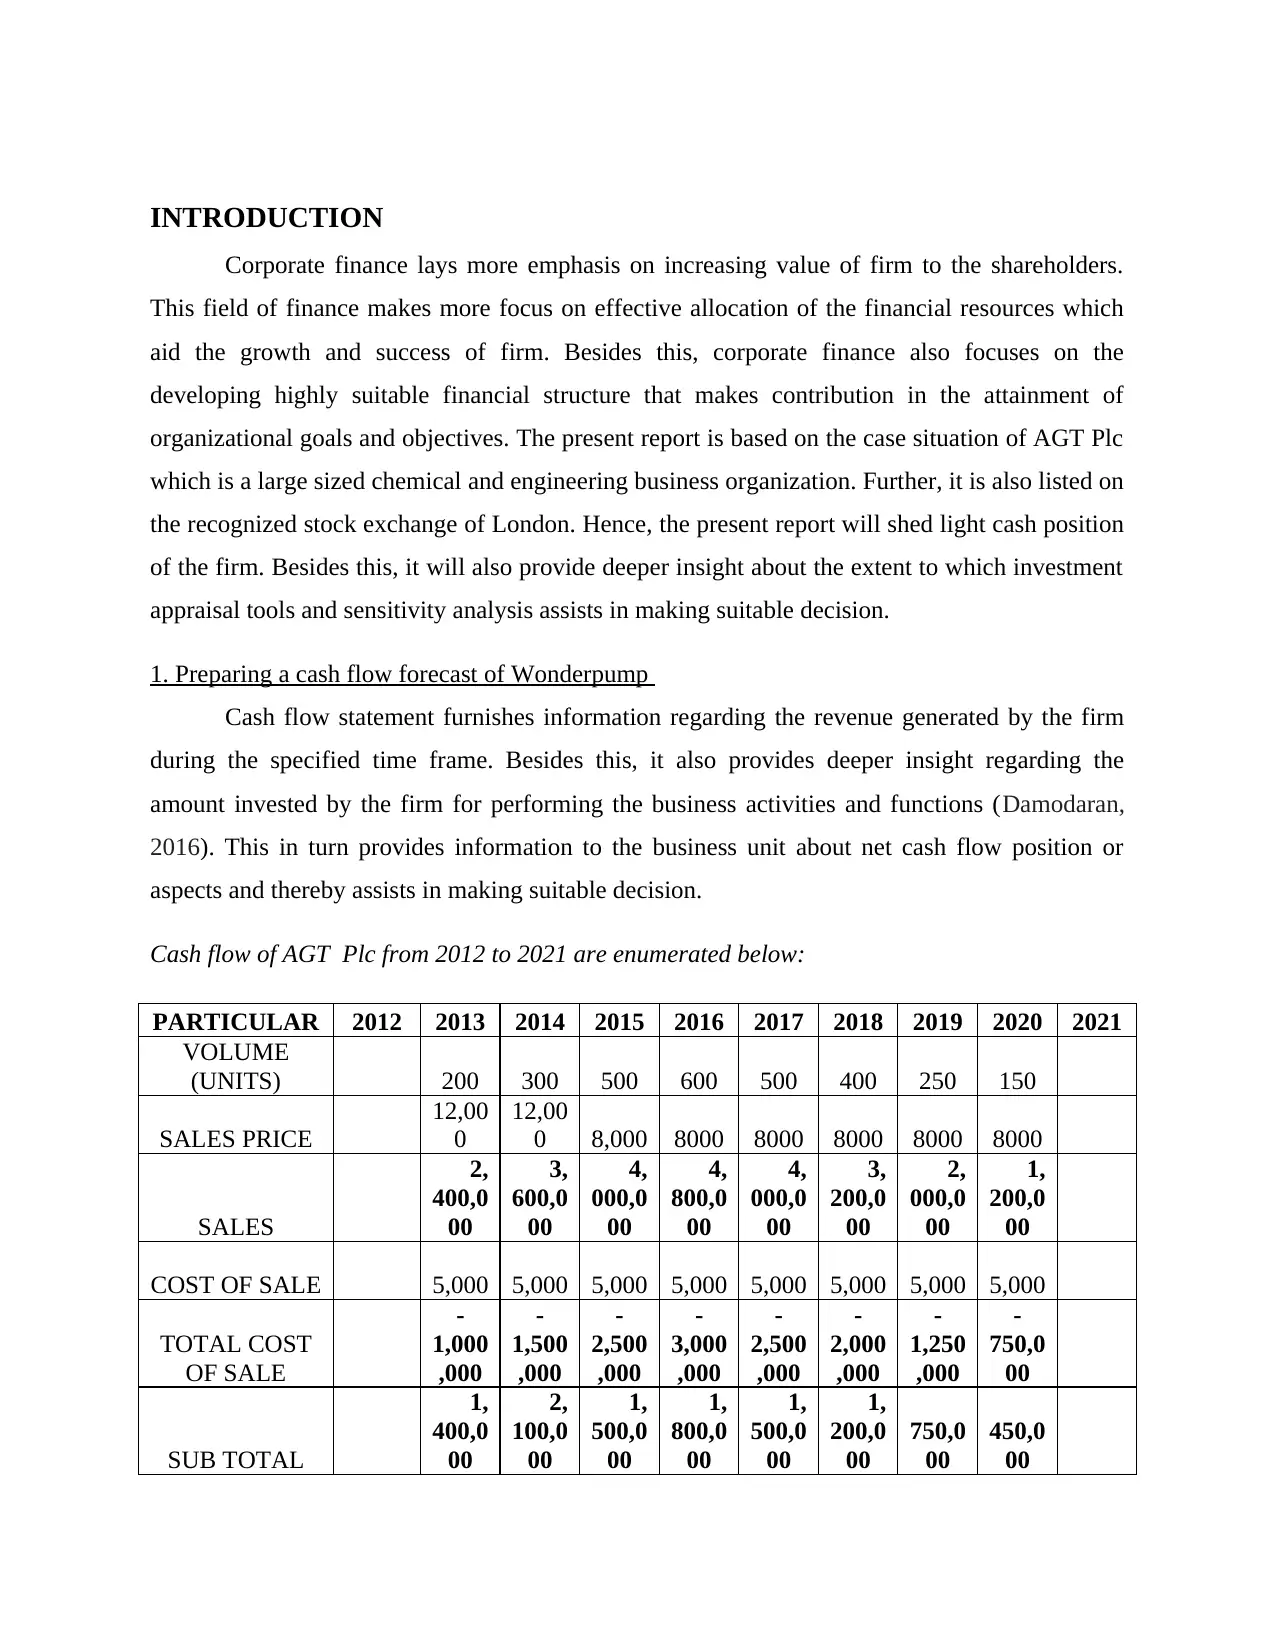
Cash flow of AGT Plc from 2012 to 2021 are enumerated below:
PARTICULAR 2012 2013 2014 2015 2016 2017 2018 2019 2020 2021
VOLUME
(UNITS) 200 300 500 600 500 400 250 150
SALES PRICE
12,00
0
12,00
0 8,000 8000 8000 8000 8000 8000
SALES
2,
400,0
00
3,
600,0
00
4,
000,0
00
4,
800,0
00
4,
000,0
00
3,
200,0
00
2,
000,0
00
1,
200,0
00
COST OF SALE 5,000 5,000 5,000 5,000 5,000 5,000 5,000 5,000
TOTAL COST
OF SALE
-
1,000
,000
-
1,500
,000
-
2,500
,000
-
3,000
,000
-
2,500
,000
-
2,000
,000
-
1,250
,000
-
750,0
00
SUB TOTAL
1,
400,0
00
2,
100,0
00
1,
500,0
00
1,
800,0
00
1,
500,0
00
1,
200,0
00
750,0
00
450,0
00
Corporate finance lays more emphasis on increasing value of firm to the shareholders.
This field of finance makes more focus on effective allocation of the financial resources which
aid the growth and success of firm. Besides this, corporate finance also focuses on the
developing highly suitable financial structure that makes contribution in the attainment of
organizational goals and objectives. The present report is based on the case situation of AGT Plc
which is a large sized chemical and engineering business organization. Further, it is also listed on
the recognized stock exchange of London. Hence, the present report will shed light cash position
of the firm. Besides this, it will also provide deeper insight about the extent to which investment
appraisal tools and sensitivity analysis assists in making suitable decision.
1. Preparing a cash flow forecast of Wonderpump
Cash flow statement furnishes information regarding the revenue generated by the firm
during the specified time frame. Besides this, it also provides deeper insight regarding the
amount invested by the firm for performing the business activities and functions (Damodaran,
2016). This in turn provides information to the business unit about net cash flow position or
aspects and thereby assists in making suitable decision.
Cash flow of AGT Plc from 2012 to 2021 are enumerated below:
PARTICULAR 2012 2013 2014 2015 2016 2017 2018 2019 2020 2021
VOLUME
(UNITS) 200 300 500 600 500 400 250 150
SALES PRICE
12,00
0
12,00
0 8,000 8000 8000 8000 8000 8000
SALES
2,
400,0
00
3,
600,0
00
4,
000,0
00
4,
800,0
00
4,
000,0
00
3,
200,0
00
2,
000,0
00
1,
200,0
00
COST OF SALE 5,000 5,000 5,000 5,000 5,000 5,000 5,000 5,000
TOTAL COST
OF SALE
-
1,000
,000
-
1,500
,000
-
2,500
,000
-
3,000
,000
-
2,500
,000
-
2,000
,000
-
1,250
,000
-
750,0
00
SUB TOTAL
1,
400,0
00
2,
100,0
00
1,
500,0
00
1,
800,0
00
1,
500,0
00
1,
200,0
00
750,0
00
450,0
00
⊘ This is a preview!⊘
Do you want full access?
Subscribe today to unlock all pages.
Trusted by 1+ million students worldwide
SALES
REPRESNTATI
VE
-
250,0
00
-
250,0
00
-
100,0
00
-
100,0
00
-
100,0
00
-
100,0
00
-
100,0
00
-
100,0
00
TECHNICAL
SUPPORT
-
150,0
00
-
150,0
00
-
50,00
0
-
50,00
0
-
50,00
0
-
50,00
0
-
50,00
0
-
50,00
0
TOTAL(B)
1,
000,0
00
1,
700,0
00
1,
350,0
00
1,
650,0
00
1,
350,0
00
1,
050,0
00
600,0
00
300,0
00
TAX
-
300,0
00
-
510,0
00
-
405,0
00
-
495,0
00
-
405,0
00
-
315,0
00
-
180,0
00
-
90,00
0
TOTAL
OPERATING
CASH FLOW
1,
000,0
00
1,
400,0
00
840,0
00
1,
245,0
00
855,0
00
645,0
00
285,0
00
120,0
00
-
90,00
0
INVESTMENT
CASH
INFLOW(CAPE
X)
-
800,0
00
INVENTORIES
(FG)
-
50,00
0
50,00
0
INVENTROIES
RAW
MATERIALS
-
300,0
00
-
450,0
00
-
750,0
00
-
900,0
00
-
750,0
00
-
600,0
00
-
375,0
00
-
225,0
00
change
-
300,0
00
-
150,0
00
-
300,0
00
-
150,0
00
150,0
00
150,0
00
225,0
00
150,0
00
225,0
00
TRADE
RECEIVEABLE
S
-
394,5
21
-
591,7
81
-
657,5
34
-
789,0
41
-
657,5
34
-
526,0
27
-
328,7
67
-
197,2
60
CHANGE
-
394,5
21
-
197,2
60
-
65,75
3
-
131,5
07
131,5
07
131,5
07
197,2
60
131,5
07
197,2
60
TRADE
PAYABLES
49,31
5
73,97
3
123,2
88
147,9
45
123,2
88
98,63
0
61,64
4
36,98
6
CHANGE
49,31
5
24,65
8
49,31
5
24,65
8
-
24,65
8
-
24,65
8
-
36,98
6
-
24,65
8
-
36,98
6
NET CASH
FLOWS
-
1,495,
205
677,3
97
1,
083,5
62
583,1
51
1,
501,8
49
1,
111,8
49
1,
030,2
74
541,8
49
555,2
74
-
90,00
0
From the above cash flow statement it has been assessed that during the period of 10
years cash flow of Gunther’s Wonderpump is showing fluctuating trend. In 2014, 2016, 2017
Paraphrase This Document
Need a fresh take? Get an instant paraphrase of this document with our AI Paraphraser
and 2018 cash position of the business unit is good which is related to such new product.
However, in other years monetary aspect of the firm will not good. Moreover, in the year of 2019
and 2012 cash flow will be £541846 and £555274 which is highly lower as compared to the
before years. Hence, by considering such aspect it can be said that business organization is
required to exert control on spending level. Thus, reduction in the expenditure aspect may result
into to high improvement in the cash flow aspects.
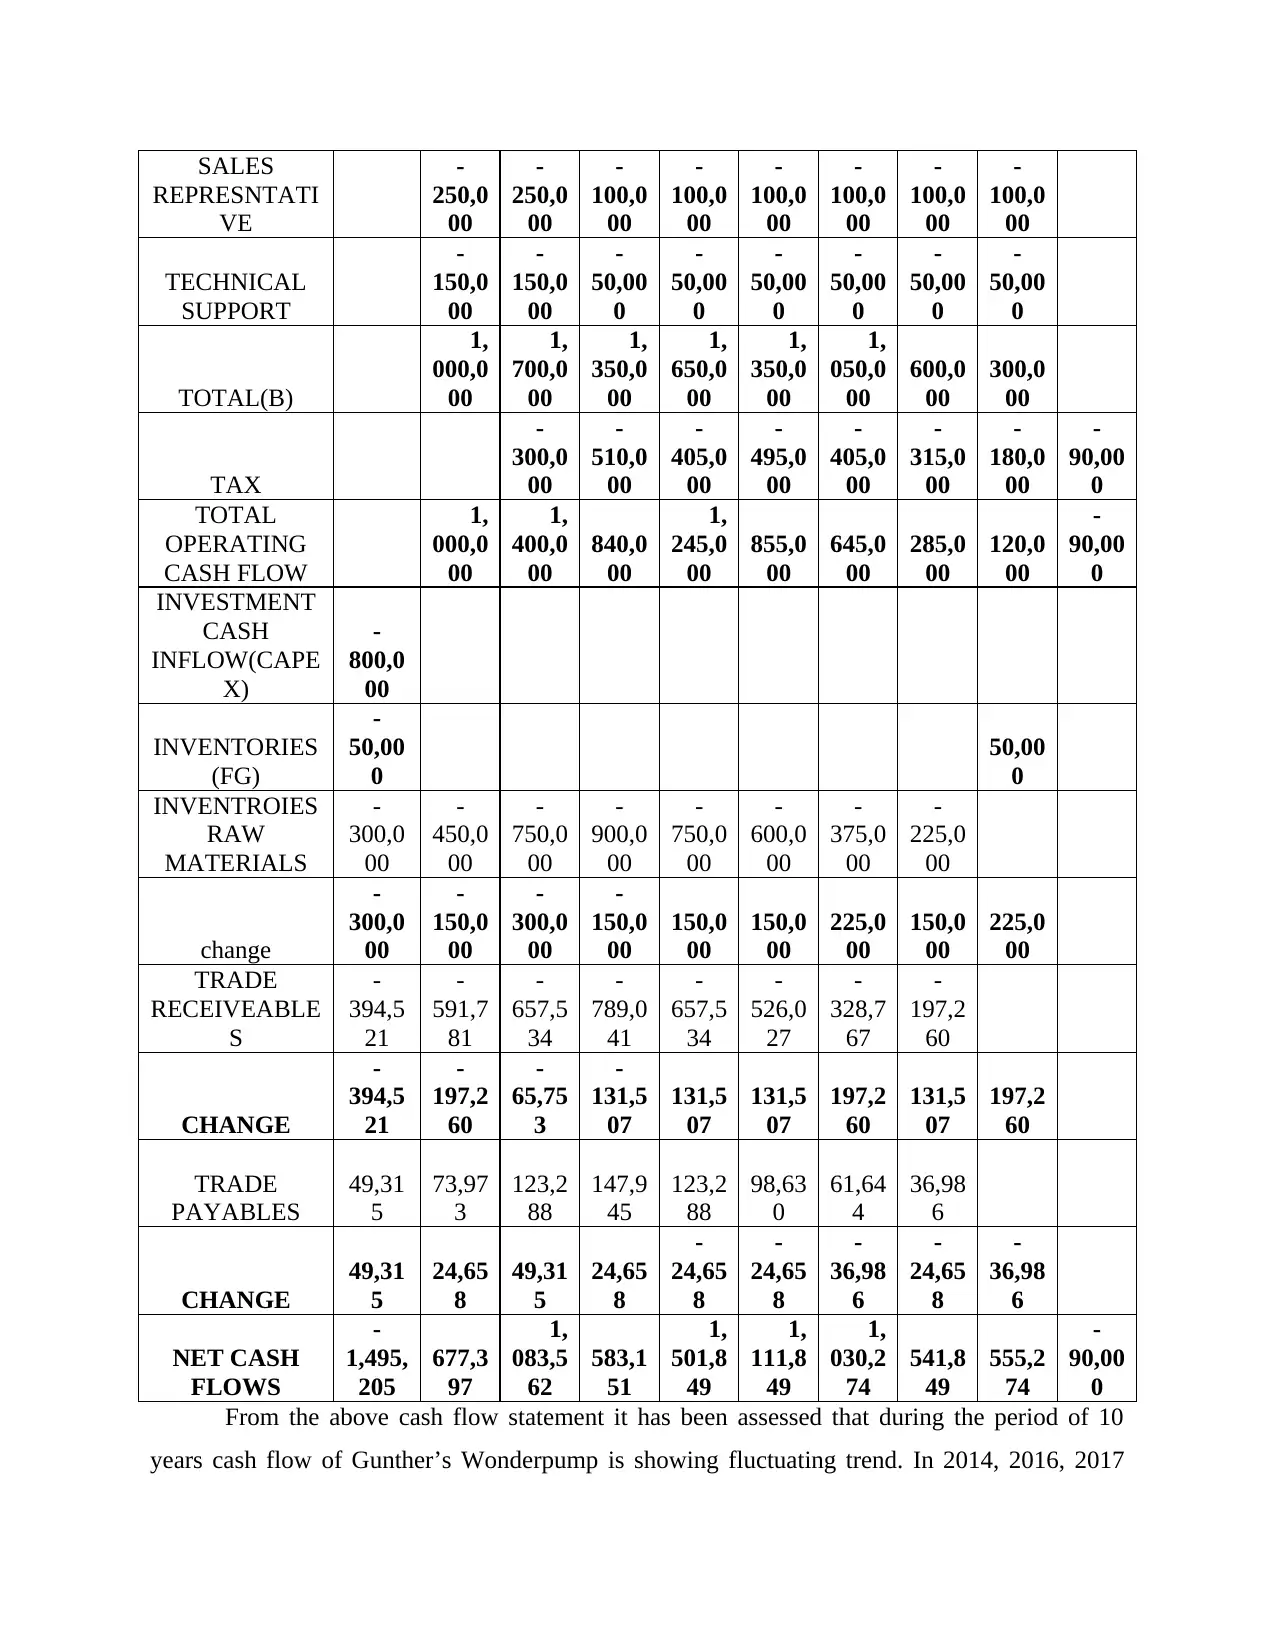
Assumption: It is assumed that 12% cost of capital has been taken into consideration to assess
NPV.
2. Assessing the proposed investment by using the capital budgeting tools
Calculation of payback period
PAYBACK
PERIOD 0 1 2 3 4 5 6 7 8 9
Years 2012 2013 2014
201
5 2016 2017 2018 2019 2020 2021
Net cash
flows
-
1,495,205
677,39
7
1,08
3,56
2
583,
151
1,50
1,84
9
1,11
1,84
9
1,03
0,27
4
541,
849
555,
274
-
90,00
0
Cumulative
cash inflows
-
1,495,205
-
817,80
8
265,
753
848,
904
2,35
0,75
3
3,46
2,60
3
4,49
2,87
7
5,03
4,72
6
5,59
0,00
0
1 year
0.75
Payback
period 1.75
Computation of NP, ARR and IRR
Year Cash inflow PV factor @ 12% Discounted cash
inflow
2012 -1495205 1 -1495205
2013 677397 .893 604819.98
2014 1083562 .797 863808.71
2015 583151 .712 415075.14
2016 1501849 .636 954452.39
2017 1111849 .567 630893.16
2018 1030274 .507 521968.86
2019 541849 .452 245105.11
However, in other years monetary aspect of the firm will not good. Moreover, in the year of 2019
and 2012 cash flow will be £541846 and £555274 which is highly lower as compared to the
before years. Hence, by considering such aspect it can be said that business organization is
required to exert control on spending level. Thus, reduction in the expenditure aspect may result
into to high improvement in the cash flow aspects.
Assumption: It is assumed that 12% cost of capital has been taken into consideration to assess
NPV.
2. Assessing the proposed investment by using the capital budgeting tools
Calculation of payback period
PAYBACK
PERIOD 0 1 2 3 4 5 6 7 8 9
Years 2012 2013 2014
201
5 2016 2017 2018 2019 2020 2021
Net cash
flows
-
1,495,205
677,39
7
1,08
3,56
2
583,
151
1,50
1,84
9
1,11
1,84
9
1,03
0,27
4
541,
849
555,
274
-
90,00
0
Cumulative
cash inflows
-
1,495,205
-
817,80
8
265,
753
848,
904
2,35
0,75
3
3,46
2,60
3
4,49
2,87
7
5,03
4,72
6
5,59
0,00
0
1 year
0.75
Payback
period 1.75
Computation of NP, ARR and IRR
Year Cash inflow PV factor @ 12% Discounted cash
inflow
2012 -1495205 1 -1495205
2013 677397 .893 604819.98
2014 1083562 .797 863808.71
2015 583151 .712 415075.14
2016 1501849 .636 954452.39
2017 1111849 .567 630893.16
2018 1030274 .507 521968.86
2019 541849 .452 245105.11
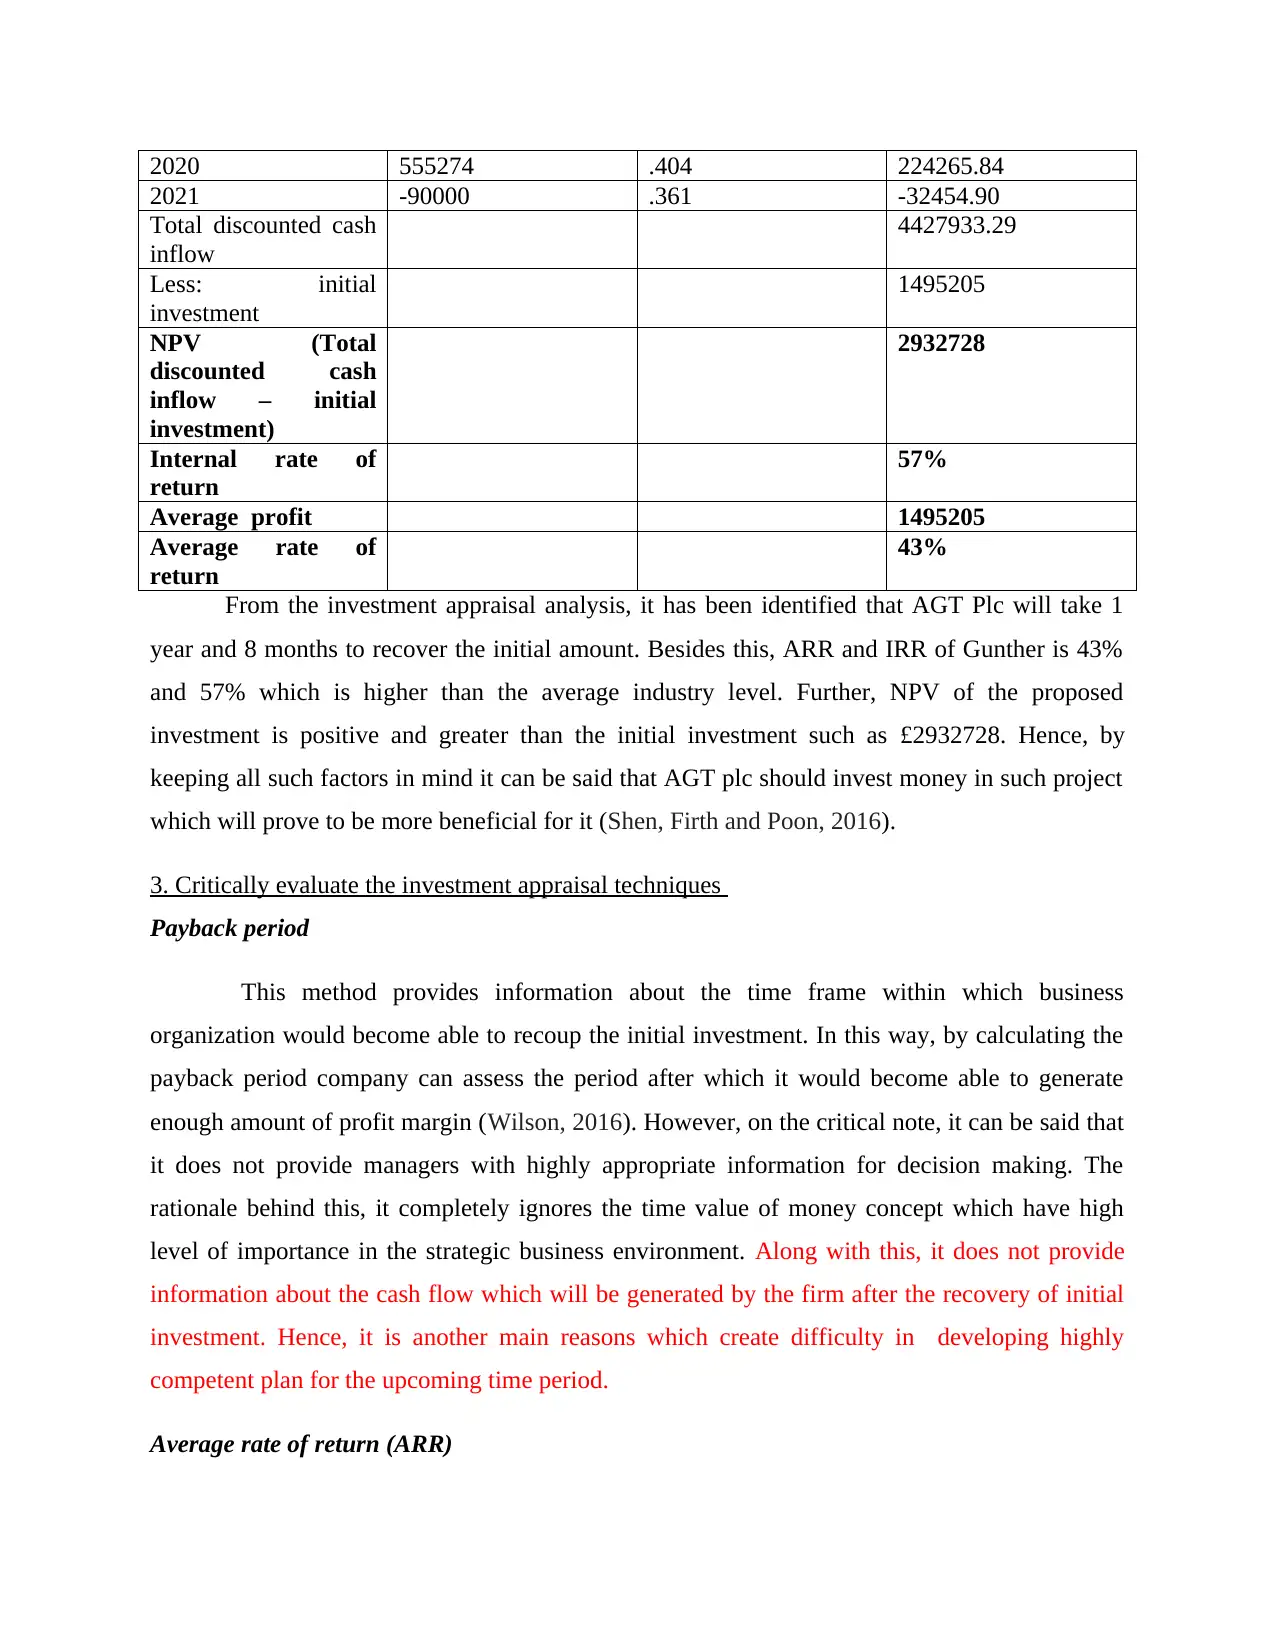
2020 555274 .404 224265.84
2021 -90000 .361 -32454.90
Total discounted cash
inflow
4427933.29
Less: initial
investment
1495205
NPV (Total
discounted cash
inflow – initial
investment)
2932728
Internal rate of
return
57%
Average profit 1495205
Average rate of
return
43%
From the investment appraisal analysis, it has been identified that AGT Plc will take 1
year and 8 months to recover the initial amount. Besides this, ARR and IRR of Gunther is 43%
and 57% which is higher than the average industry level. Further, NPV of the proposed
investment is positive and greater than the initial investment such as £2932728. Hence, by
keeping all such factors in mind it can be said that AGT plc should invest money in such project
which will prove to be more beneficial for it (Shen, Firth and Poon, 2016).
3. Critically evaluate the investment appraisal techniques
Payback period
This method provides information about the time frame within which business
organization would become able to recoup the initial investment. In this way, by calculating the
payback period company can assess the period after which it would become able to generate
enough amount of profit margin (Wilson, 2016). However, on the critical note, it can be said that
it does not provide managers with highly appropriate information for decision making. The
rationale behind this, it completely ignores the time value of money concept which have high
level of importance in the strategic business environment. Along with this, it does not provide
information about the cash flow which will be generated by the firm after the recovery of initial
investment. Hence, it is another main reasons which create difficulty in developing highly
competent plan for the upcoming time period.
Average rate of return (ARR)
⊘ This is a preview!⊘
Do you want full access?
Subscribe today to unlock all pages.
Trusted by 1+ million students worldwide
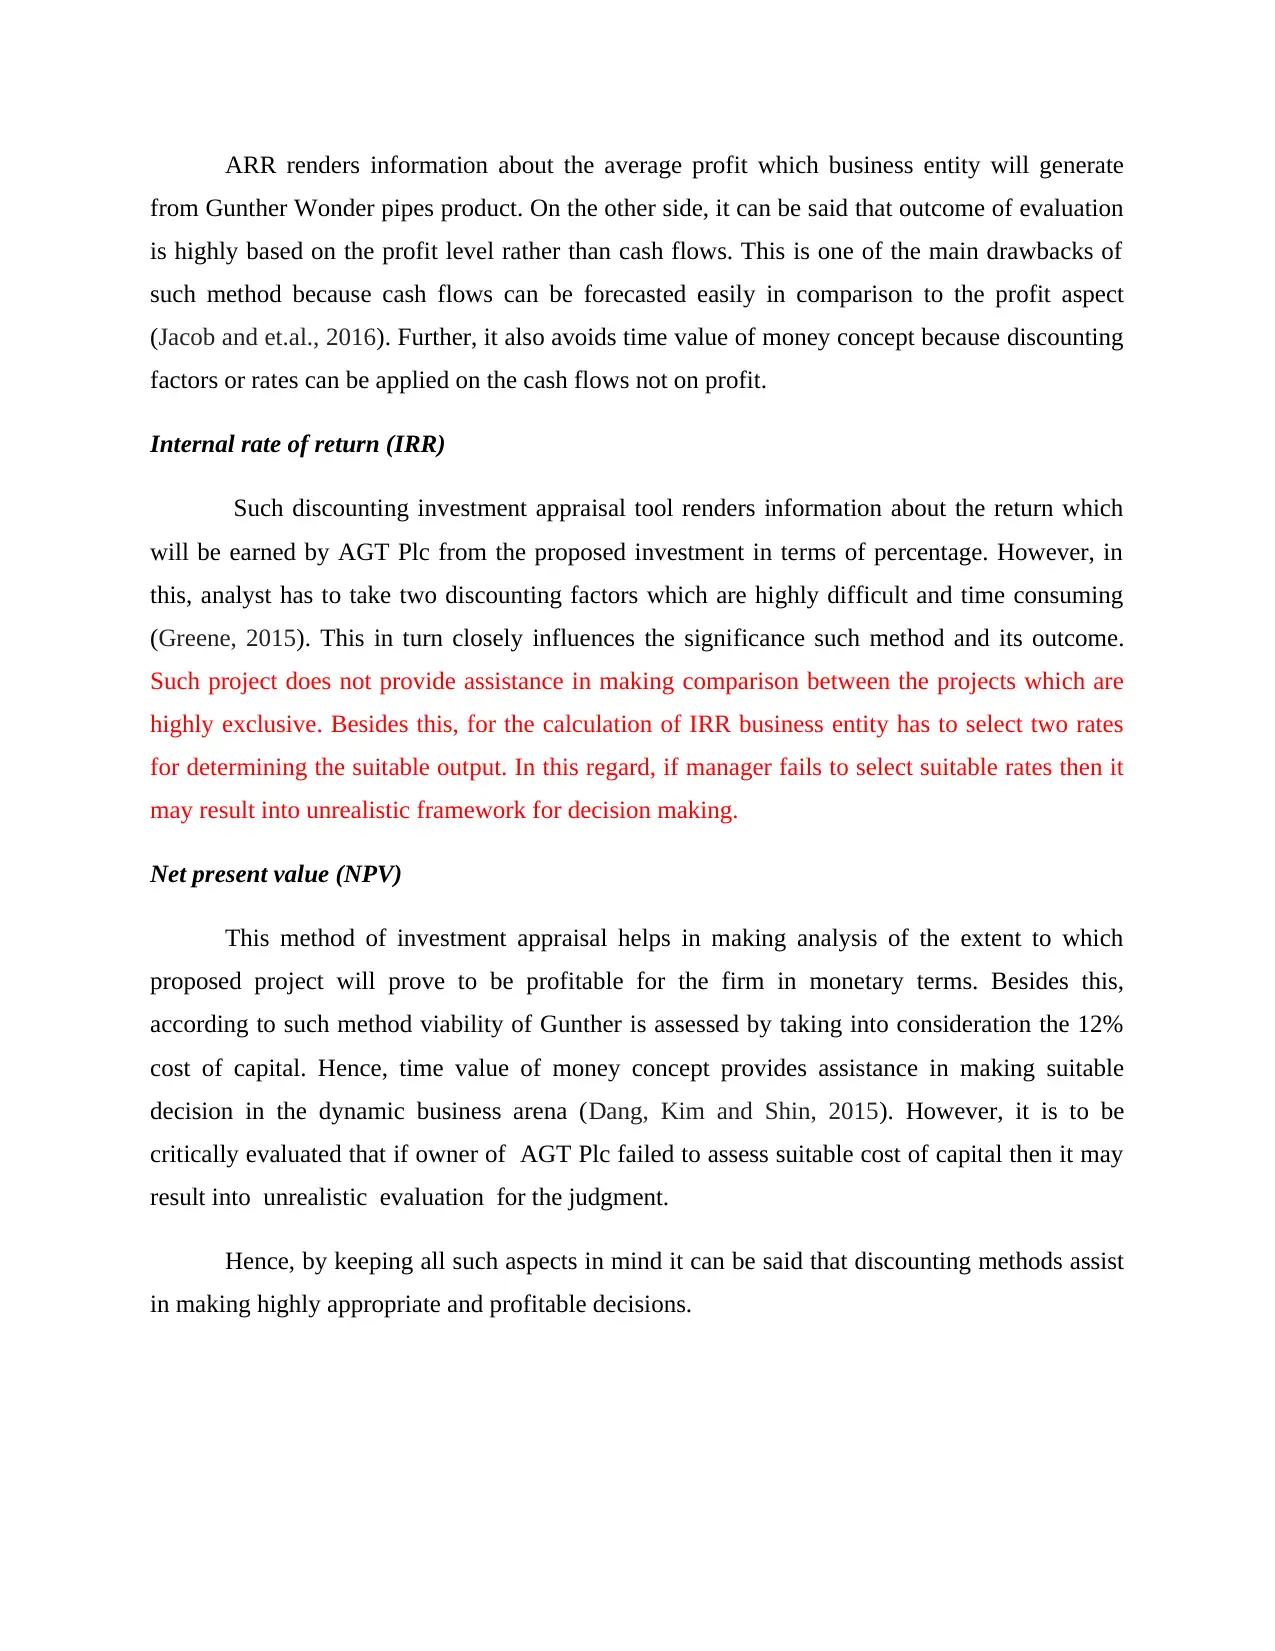
ARR renders information about the average profit which business entity will generate
from Gunther Wonder pipes product. On the other side, it can be said that outcome of evaluation
is highly based on the profit level rather than cash flows. This is one of the main drawbacks of
such method because cash flows can be forecasted easily in comparison to the profit aspect
(Jacob and et.al., 2016). Further, it also avoids time value of money concept because discounting
factors or rates can be applied on the cash flows not on profit.
Internal rate of return (IRR)
Such discounting investment appraisal tool renders information about the return which
will be earned by AGT Plc from the proposed investment in terms of percentage. However, in
this, analyst has to take two discounting factors which are highly difficult and time consuming
(Greene, 2015). This in turn closely influences the significance such method and its outcome.
Such project does not provide assistance in making comparison between the projects which are
highly exclusive. Besides this, for the calculation of IRR business entity has to select two rates
for determining the suitable output. In this regard, if manager fails to select suitable rates then it
may result into unrealistic framework for decision making.
Net present value (NPV)
This method of investment appraisal helps in making analysis of the extent to which
proposed project will prove to be profitable for the firm in monetary terms. Besides this,
according to such method viability of Gunther is assessed by taking into consideration the 12%
cost of capital. Hence, time value of money concept provides assistance in making suitable
decision in the dynamic business arena (Dang, Kim and Shin, 2015). However, it is to be
critically evaluated that if owner of AGT Plc failed to assess suitable cost of capital then it may
result into unrealistic evaluation for the judgment.
Hence, by keeping all such aspects in mind it can be said that discounting methods assist
in making highly appropriate and profitable decisions.
Paraphrase This Document
Need a fresh take? Get an instant paraphrase of this document with our AI Paraphraser
4.
a. Performing a sensitivity analysis or calculation
PARTICULAR 2012 2013 2014 2015 2016 2017 2018 2019 2020 2021
VOLUME
(UNITS) 200 300 500 600 500 400 250 150
SALES PRICE 5,000 5,000 5,000 5,000 5,000 5,000 5,000 5,000
SALES
1,
000,0
00
1,
500,0
00
2,
500,0
00
3,
000,0
00
2,
500,0
00
2,
000,0
00
1,
250,0
00
750,0
00
COST OF
SALE 5,000 5,000 5,000 5,000 5,000 5,000 5,000 5,000
TOTAL COST
OF SALE
-
1,000
,000
-
1,500
,000
-
2,500
,000
-
3,000
,000
-
2,500
,000
-
2,000
,000
-
1,250
,000
-
750,0
00
SUB TOTAL - - - - - - - -
SALES
REPRESNTATI
VE
-
250,0
00
-
250,0
00
-
100,0
00
-
100,0
00
-
100,0
00
-
100,0
00
-
100,0
00
-
100,0
00
TECHNICAL
SUPPORT
-
150,0
00
-
150,0
00
-
50,00
0
-
50,00
0
-
50,00
0
-
50,00
0
-
50,00
0
-
50,00
0
TOTAL(B)
-
400,0
00
-
400,0
00
-
150,0
00
-
150,0
00
-
150,0
00
-
150,0
00
-
150,0
00
-
150,0
00
TAX
120,0
00
120,0
00
45,00
0
45,00
0
45,00
0
45,00
0
45,00
0
45,00
0
TOTAL
OPERATING
CASH FLOW
-
400,0
00
-
280,0
00
-
30,00
0
-
105,0
00
-
105,0
00
-
105,0
00
-
105,0
00
-
105,0
00
45,00
0
INVESTMENT
CASH
INFLOW(CAP
EX)
-
800,0
00
INVENTORIES
(FG)
-
50,00
0
50,00
0
INVENTROIES
RAW
MATERIALS
-
300,0
00
-
450,0
00
-
750,0
00
-
900,0
00
-
750,0
00
-
600,0
00
-
375,0
00
-
225,0
00
change
-
300,0
00
-
150,0
00
-
300,0
00
-
150,0
00
150,0
00
150,0
00
225,0
00
150,0
00
225,0
00
TRADE
RECEIVEABL
ES
-
164,3
84
-
246,5
75
-
410,9
59
-
493,1
51
-
410,9
59
-
328,7
67
-
205,4
79
-
123,2
88
CHANGE -
164,3
84
-
82,19
2
-
164,3
84
-
82,19
2
82,19
2
82,19
2
123,2
88
82,19
2
123,2
88
TRADE
PAYABLES
49,31
5
73,97
3
123,2
88
147,9
45
123,2
88
98,63
0
61,64
4
36,98
6
CHANGE
49,31
5
24,65
8
49,31
5
24,65
8
-
24,65
8
-
24,65
8
-
36,98
6
-
24,65
8
-
36,98
6
NET CASH
FLOWS
-
1,265,
068
-
607,5
34
-
695,0
68
-
237,5
34
102,5
34
102,5
34
206,3
01
102,5
34
256,3
01
45,00
0
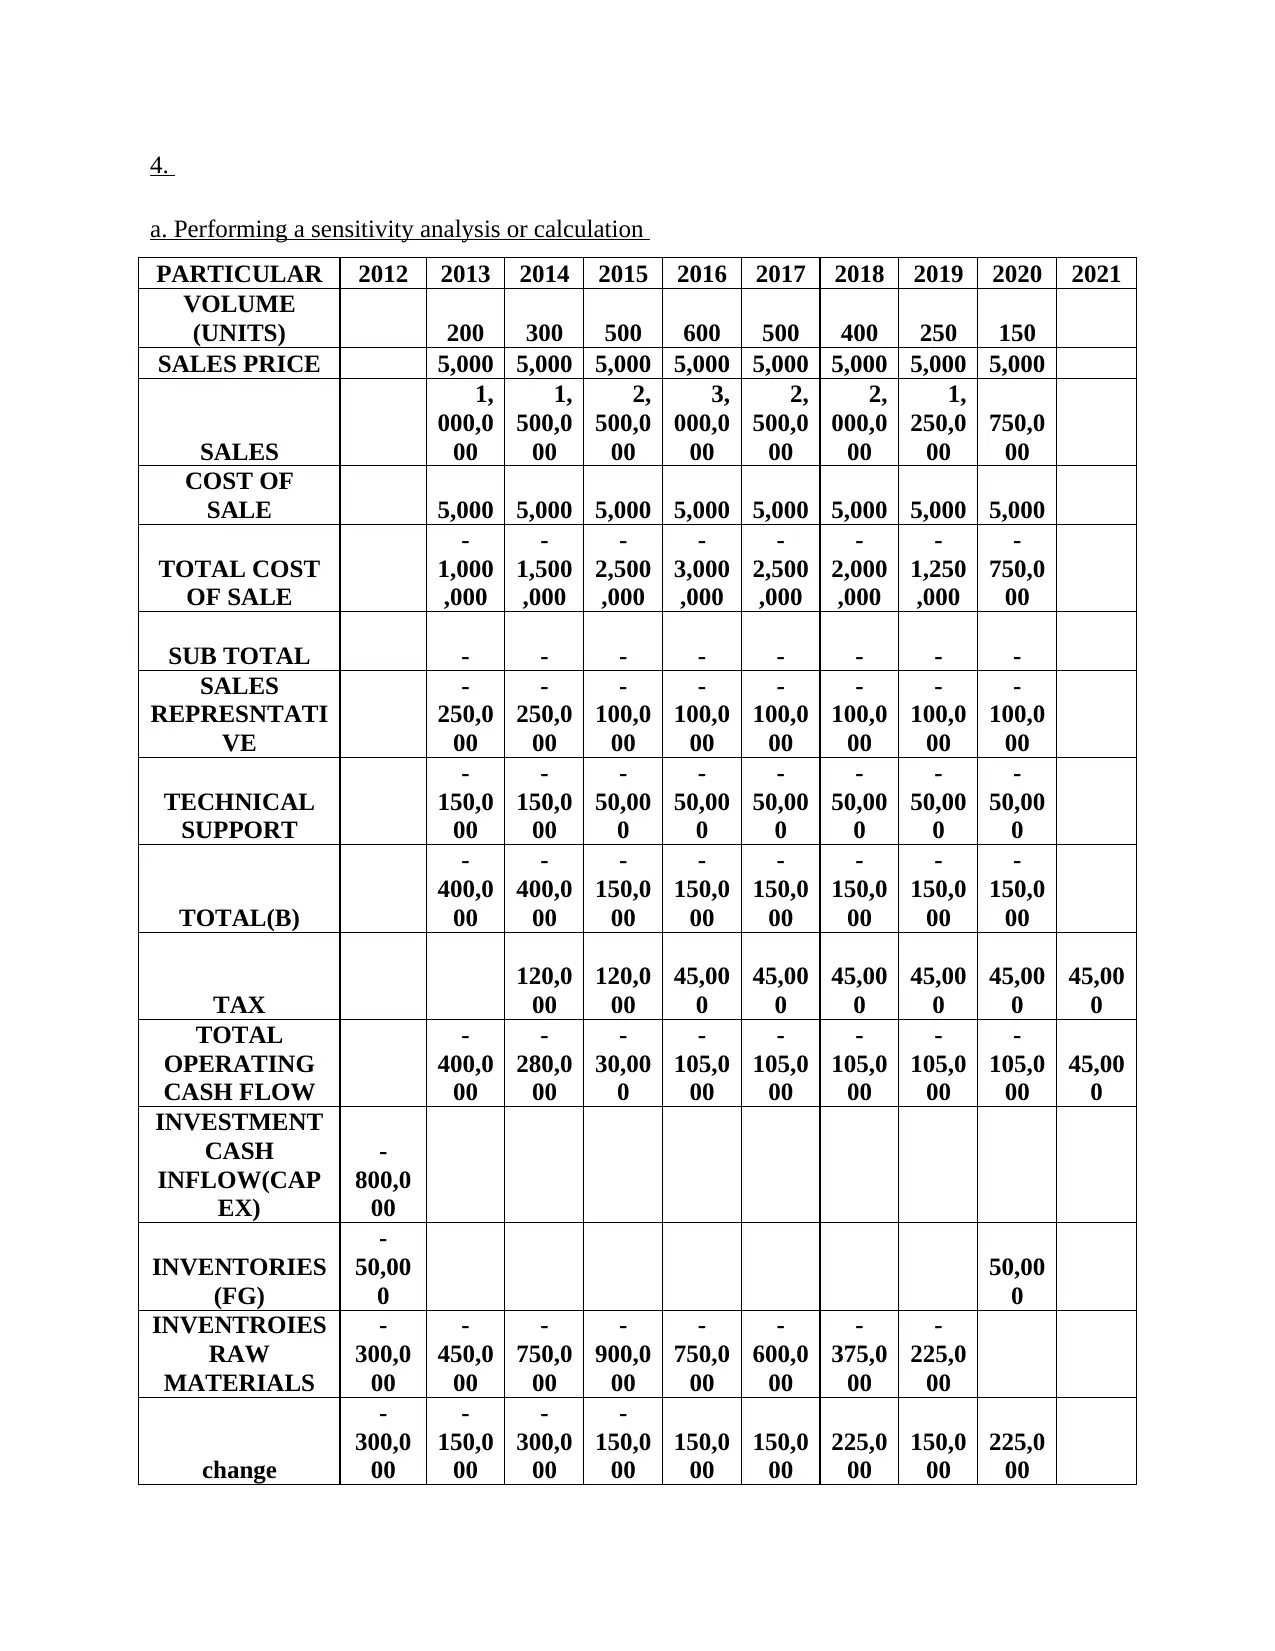
By doing sensitivity analysis, it has been assessed that volume of units sold during the
specified time frame has high level of impact on the sales revenue and cash inflow (Coles,
Lemmon and Meschke, 2012). The above mentioned table clearly presents the fluctuating trend
in the sales revenue and cash inflow due to the difference takes place in the number of unit
offered or provided to the customers (Faff, Gray and Tan, 2016). In this way, it is the major
factors which have high level of impact on the overall cash position of AGT plc.
b. Giving comment on Gunther
Particulars 2012 2013 2014 2015 2016 2017 2018 2019 2020 2021
Volume
(units) 100 150 150 150 150 150 150 150
Sales price
12,00
0
12,00
0 8,000 8000 8000 8000 8000 8000
Sales
1,
200,0
00
1,
800,0
00
1,
200,0
00
1,
200,0
00
1,
200,0
00
1,
200,0
00
1,
200,0
00
1,
200,0
00
Cost of sale 5,000 5,000 5,000 5,000 5,000 5,000 5,000 5,000
Total cost of
sale
-
500,0
00
-
750,0
00
-
750,0
00
-
750,0
00
-
750,0
00
-
750,0
00
-
750,0
00
-
750,0
00
Sub total
700,0
00
1,
050,0
00
450,0
00
450,0
00
450,0
00
450,0
00
450,0
00
450,0
00
Sales
representativ
-
250,0
-
250,0
-
100,0
-
100,0
-
100,0
-
100,0
-
100,0
-
100,0
RECEIVEABL
ES
-
164,3
84
-
246,5
75
-
410,9
59
-
493,1
51
-
410,9
59
-
328,7
67
-
205,4
79
-
123,2
88
CHANGE -
164,3
84
-
82,19
2
-
164,3
84
-
82,19
2
82,19
2
82,19
2
123,2
88
82,19
2
123,2
88
TRADE
PAYABLES
49,31
5
73,97
3
123,2
88
147,9
45
123,2
88
98,63
0
61,64
4
36,98
6
CHANGE
49,31
5
24,65
8
49,31
5
24,65
8
-
24,65
8
-
24,65
8
-
36,98
6
-
24,65
8
-
36,98
6
NET CASH
FLOWS
-
1,265,
068
-
607,5
34
-
695,0
68
-
237,5
34
102,5
34
102,5
34
206,3
01
102,5
34
256,3
01
45,00
0
By doing sensitivity analysis, it has been assessed that volume of units sold during the
specified time frame has high level of impact on the sales revenue and cash inflow (Coles,
Lemmon and Meschke, 2012). The above mentioned table clearly presents the fluctuating trend
in the sales revenue and cash inflow due to the difference takes place in the number of unit
offered or provided to the customers (Faff, Gray and Tan, 2016). In this way, it is the major
factors which have high level of impact on the overall cash position of AGT plc.
b. Giving comment on Gunther
Particulars 2012 2013 2014 2015 2016 2017 2018 2019 2020 2021
Volume
(units) 100 150 150 150 150 150 150 150
Sales price
12,00
0
12,00
0 8,000 8000 8000 8000 8000 8000
Sales
1,
200,0
00
1,
800,0
00
1,
200,0
00
1,
200,0
00
1,
200,0
00
1,
200,0
00
1,
200,0
00
1,
200,0
00
Cost of sale 5,000 5,000 5,000 5,000 5,000 5,000 5,000 5,000
Total cost of
sale
-
500,0
00
-
750,0
00
-
750,0
00
-
750,0
00
-
750,0
00
-
750,0
00
-
750,0
00
-
750,0
00
Sub total
700,0
00
1,
050,0
00
450,0
00
450,0
00
450,0
00
450,0
00
450,0
00
450,0
00
Sales
representativ
-
250,0
-
250,0
-
100,0
-
100,0
-
100,0
-
100,0
-
100,0
-
100,0
⊘ This is a preview!⊘
Do you want full access?
Subscribe today to unlock all pages.
Trusted by 1+ million students worldwide
e 00 00 00 00 00 00 00 00
Technical
support
-
150,0
00
-
150,0
00
-
50,00
0
-
50,00
0
-
50,00
0
-
50,00
0
-
50,00
0
-
50,00
0
Total(b)
300,0
00
650,0
00
300,0
00
300,0
00
300,0
00
300,0
00
300,0
00
300,0
00
Tax
-
90,00
0
-
195,0
00
-
90,00
0
-
90,00
0
-
90,00
0
-
90,00
0
-
90,00
0
-
90,00
0
Total
operating
cash flow
300,0
00
560,0
00
105,0
00
210,0
00
210,0
00
210,0
00
210,0
00
210,0
00
-
90,00
0
Investment
cash
inflow(cape
x)
-
800,00
0
Inventories(f
g)
-
50,000
50,00
0
Inventories
raw
materials
-
150,00
0
-
225,0
00
-
225,0
00
-
225,0
00
-
225,0
00
-
225,0
00
-
225,0
00
-
225,0
00
Change
-
150,00
0
-
75,00
0 0 0 0 0 0 0
225,0
00
Trade
receivables
-
197,26
0
-
295,8
90
-
197,2
60
-
197,2
60
-
197,2
60
-
197,2
60
-
197,2
60
-
197,2
60
Change
-
197,26
0
-
98,63
0
98,63
0 - - - - -
197,2
60
Trade
payables 24,658
36,98
6
36,98
6
36,98
6
36,98
6
36,98
6
36,98
6
36,98
6
Change 24,658
12,32
9 - - - - - -
-
36,98
6
Net cash
flows
-
1,172,
603
138,6
99
658,6
30
105,0
00
210,0
00
210,0
00
210,0
00
210,0
00
645,2
74
-
90,00
0
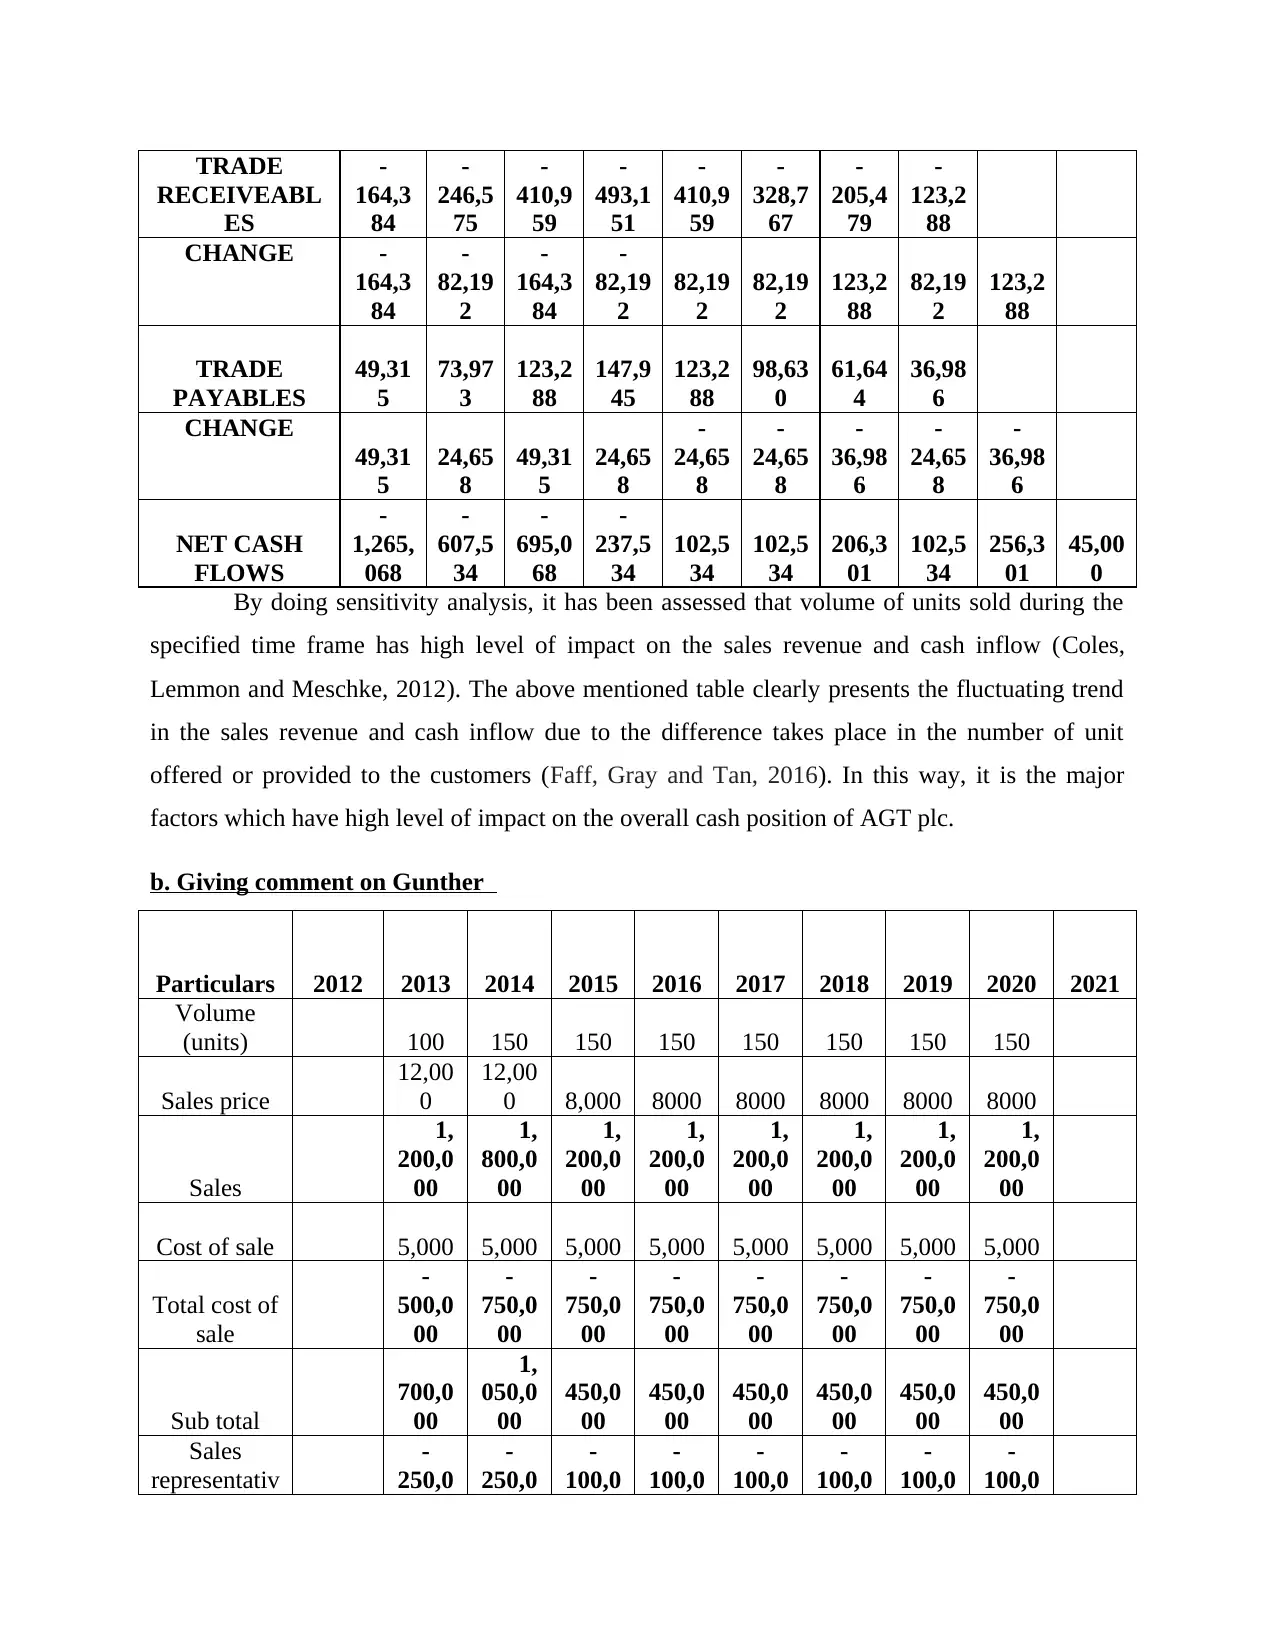
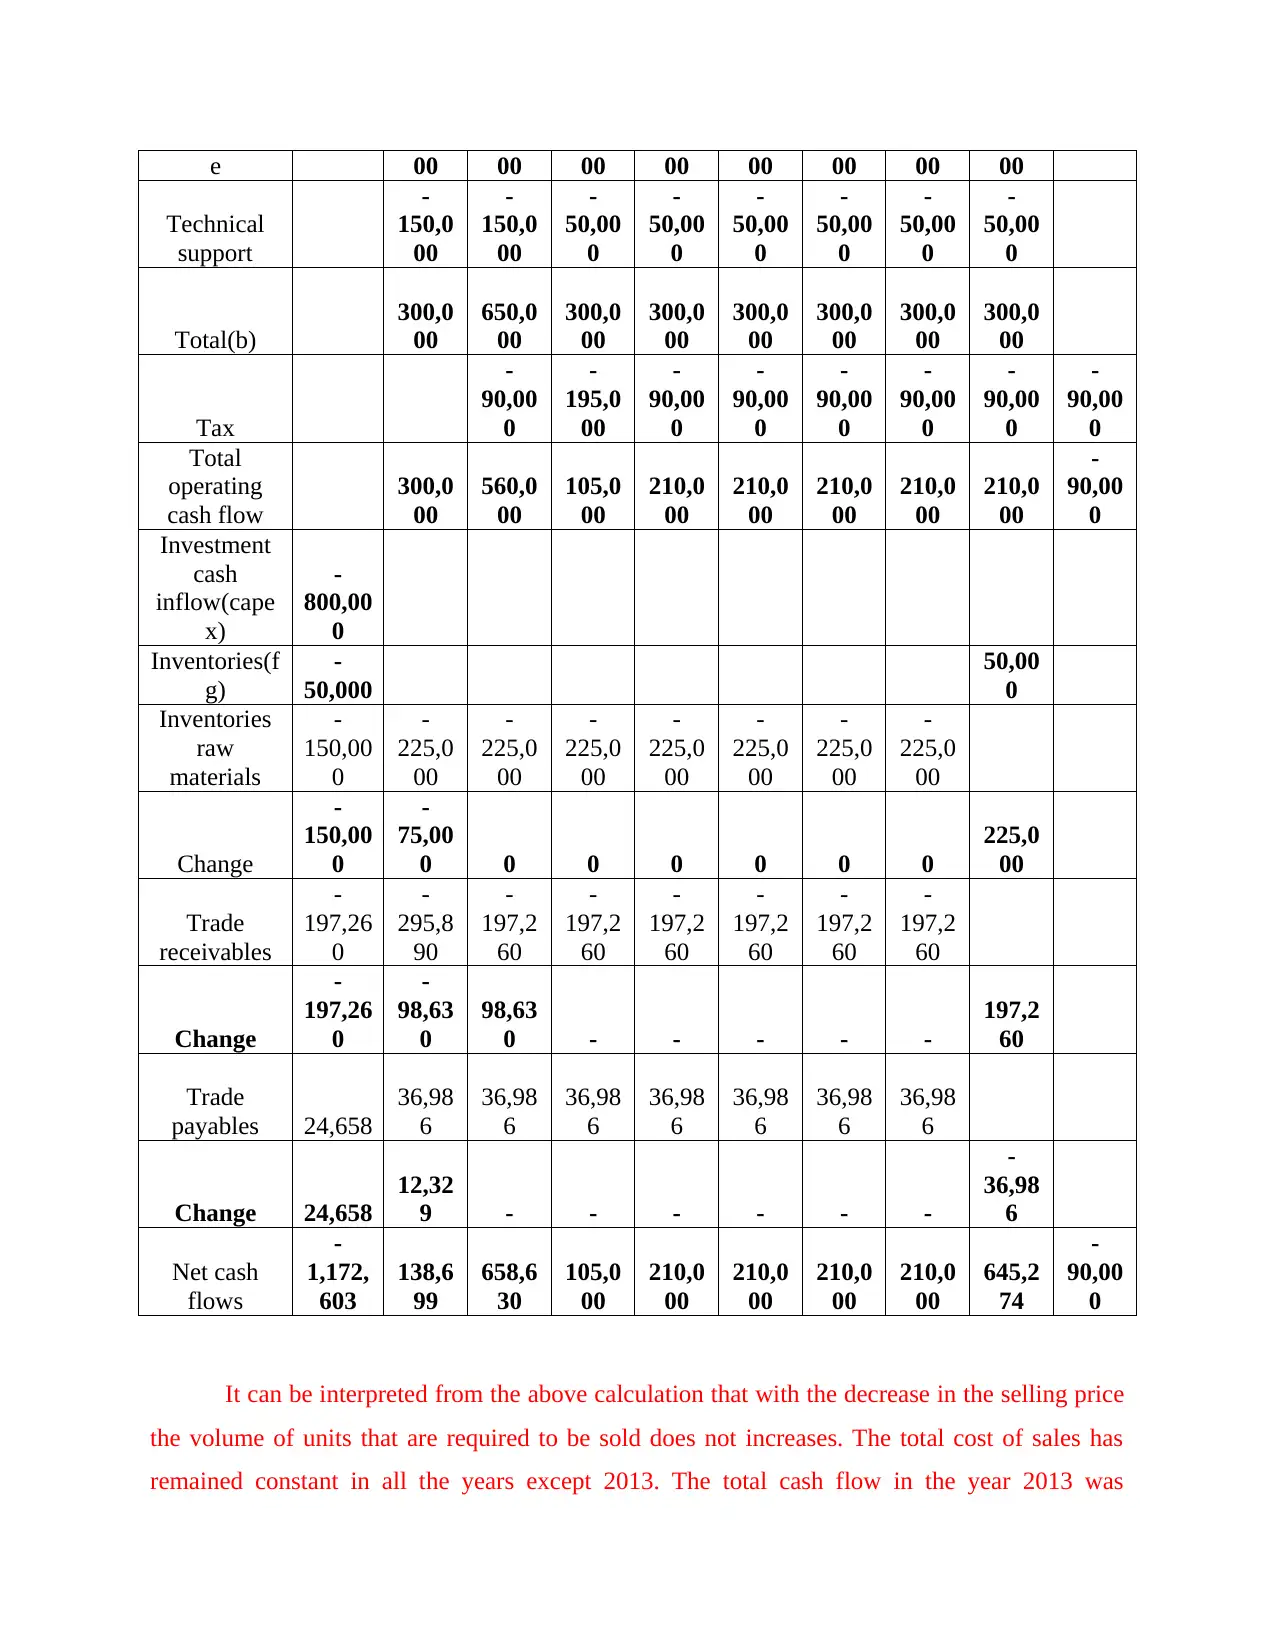
It can be interpreted from the above calculation that with the decrease in the selling price
the volume of units that are required to be sold does not increases. The total cost of sales has
remained constant in all the years except 2013. The total cash flow in the year 2013 was
Technical
support
-
150,0
00
-
150,0
00
-
50,00
0
-
50,00
0
-
50,00
0
-
50,00
0
-
50,00
0
-
50,00
0
Total(b)
300,0
00
650,0
00
300,0
00
300,0
00
300,0
00
300,0
00
300,0
00
300,0
00
Tax
-
90,00
0
-
195,0
00
-
90,00
0
-
90,00
0
-
90,00
0
-
90,00
0
-
90,00
0
-
90,00
0
Total
operating
cash flow
300,0
00
560,0
00
105,0
00
210,0
00
210,0
00
210,0
00
210,0
00
210,0
00
-
90,00
0
Investment
cash
inflow(cape
x)
-
800,00
0
Inventories(f
g)
-
50,000
50,00
0
Inventories
raw
materials
-
150,00
0
-
225,0
00
-
225,0
00
-
225,0
00
-
225,0
00
-
225,0
00
-
225,0
00
-
225,0
00
Change
-
150,00
0
-
75,00
0 0 0 0 0 0 0
225,0
00
Trade
receivables
-
197,26
0
-
295,8
90
-
197,2
60
-
197,2
60
-
197,2
60
-
197,2
60
-
197,2
60
-
197,2
60
Change
-
197,26
0
-
98,63
0
98,63
0 - - - - -
197,2
60
Trade
payables 24,658
36,98
6
36,98
6
36,98
6
36,98
6
36,98
6
36,98
6
36,98
6
Change 24,658
12,32
9 - - - - - -
-
36,98
6
Net cash
flows
-
1,172,
603
138,6
99
658,6
30
105,0
00
210,0
00
210,0
00
210,0
00
210,0
00
645,2
74
-
90,00
0
It can be interpreted from the above calculation that with the decrease in the selling price
the volume of units that are required to be sold does not increases. The total cost of sales has
remained constant in all the years except 2013. The total cash flow in the year 2013 was
Paraphrase This Document
Need a fresh take? Get an instant paraphrase of this document with our AI Paraphraser
1172603. This has decreased in the following year that is 2013. Along with this in the highest net
cash flow is in the year 2014. However this has increasing in the years to come but not to a
greater extent. It has been assessed that trade receivables is higher in comparison with trade
payables. This presents that liability of the business is less as compared with the asset. This
implies that financial position of the company is sound which would enable it in attaining its
targets in an effective manner. The technical support of the company in the initial years was
maximum. This has declined to a significant level. This has been gained that it has remained
constant from the year 2015. The cost of sales representative has decline to a greater extent. This
has greater impact on the overall decline in the cost of the firm.
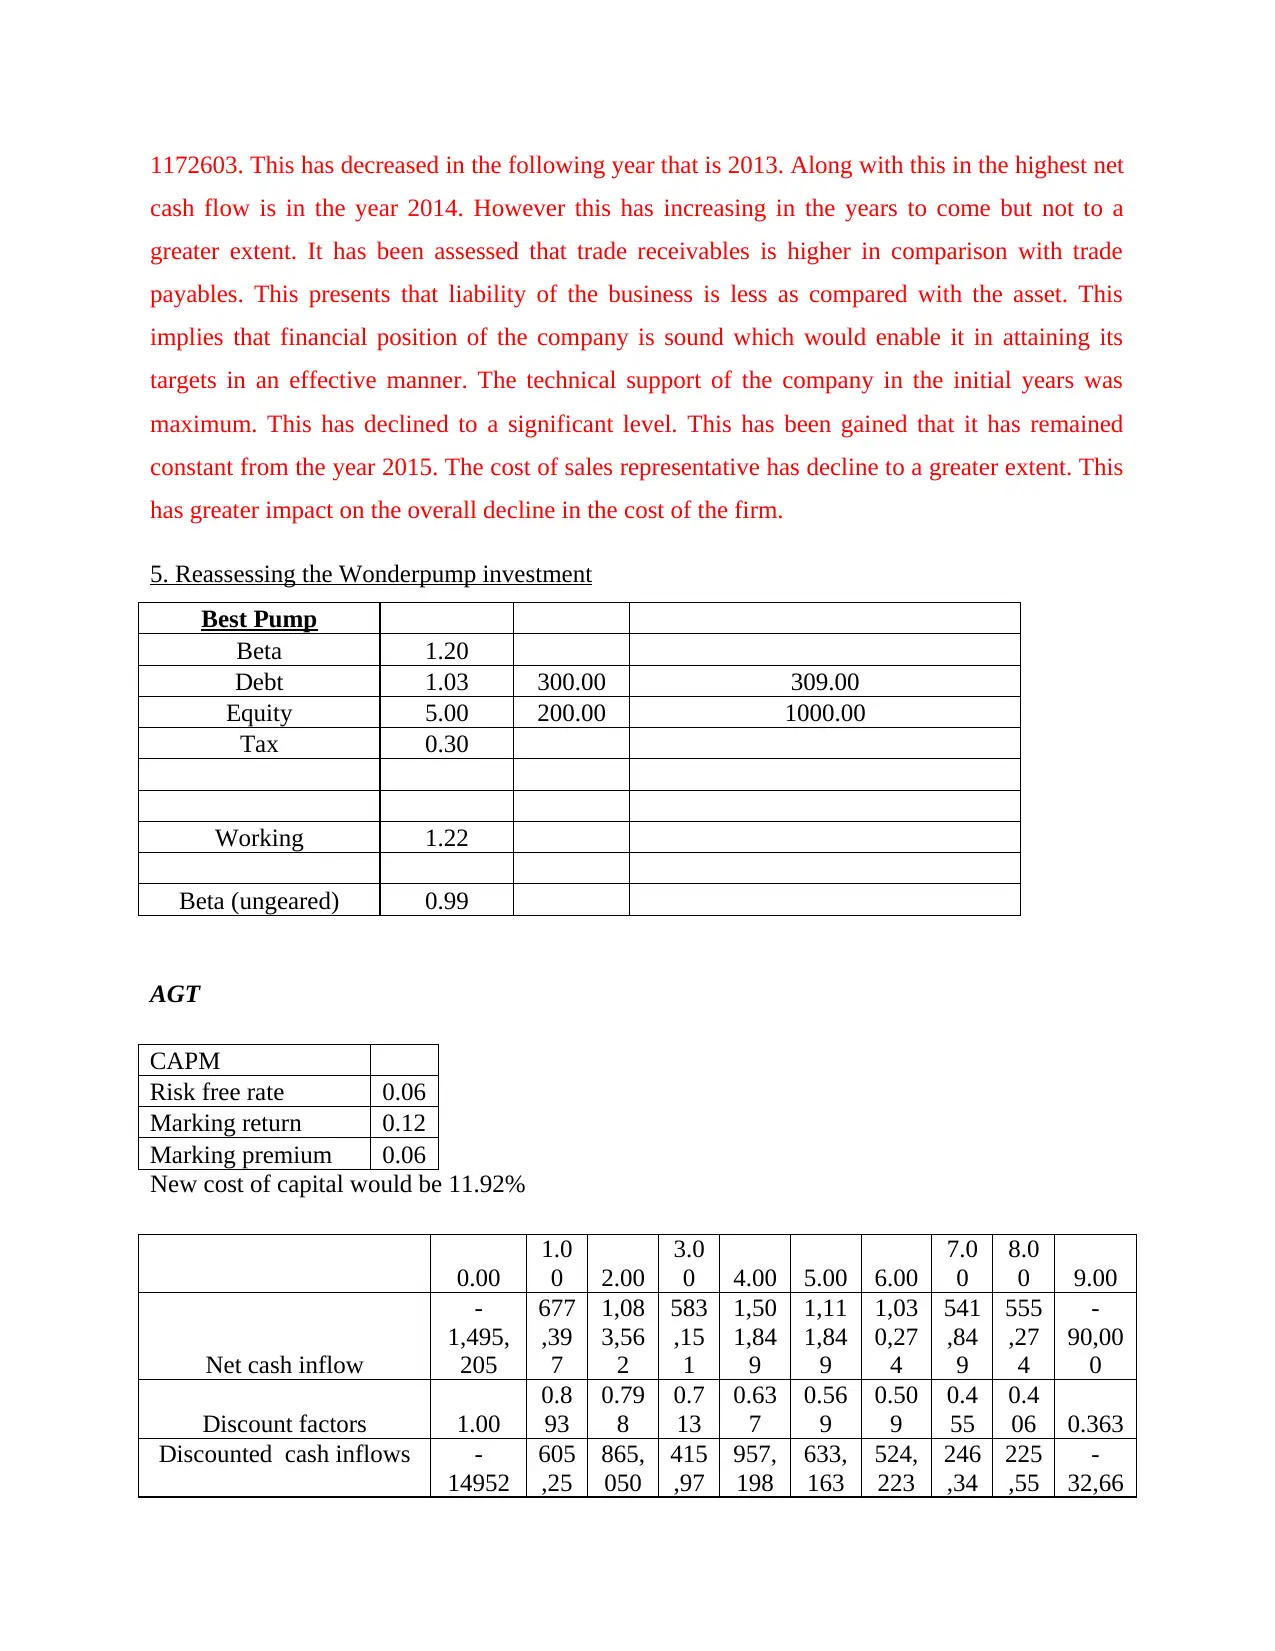
5. Reassessing the Wonderpump investment
Best Pump
Beta 1.20
Debt 1.03 300.00 309.00
Equity 5.00 200.00 1000.00
Tax 0.30
Working 1.22
Beta (ungeared) 0.99
AGT
CAPM
Risk free rate 0.06
Marking return 0.12
Marking premium 0.06
New cost of capital would be 11.92%
0.00
1.0
0 2.00
3.0
0 4.00 5.00 6.00
7.0
0
8.0
0 9.00
Net cash inflow
-
1,495,
205
677
,39
7
1,08
3,56
2
583
,15
1
1,50
1,84
9
1,11
1,84
9
1,03
0,27
4
541
,84
9
555
,27
4
-
90,00
0
Discount factors 1.00
0.8
93
0.79
8
0.7
13
0.63
7
0.56
9
0.50
9
0.4
55
0.4
06 0.363
Discounted cash inflows -
14952
605
,25
865,
050
415
,97
957,
198
633,
163
524,
223
246
,34
225
,55
-
32,66
cash flow is in the year 2014. However this has increasing in the years to come but not to a
greater extent. It has been assessed that trade receivables is higher in comparison with trade
payables. This presents that liability of the business is less as compared with the asset. This
implies that financial position of the company is sound which would enable it in attaining its
targets in an effective manner. The technical support of the company in the initial years was
maximum. This has declined to a significant level. This has been gained that it has remained
constant from the year 2015. The cost of sales representative has decline to a greater extent. This
has greater impact on the overall decline in the cost of the firm.
5. Reassessing the Wonderpump investment
Best Pump
Beta 1.20
Debt 1.03 300.00 309.00
Equity 5.00 200.00 1000.00
Tax 0.30
Working 1.22
Beta (ungeared) 0.99
AGT
CAPM
Risk free rate 0.06
Marking return 0.12
Marking premium 0.06
New cost of capital would be 11.92%
0.00
1.0
0 2.00
3.0
0 4.00 5.00 6.00
7.0
0
8.0
0 9.00
Net cash inflow
-
1,495,
205
677
,39
7
1,08
3,56
2
583
,15
1
1,50
1,84
9
1,11
1,84
9
1,03
0,27
4
541
,84
9
555
,27
4
-
90,00
0
Discount factors 1.00
0.8
93
0.79
8
0.7
13
0.63
7
0.56
9
0.50
9
0.4
55
0.4
06 0.363
Discounted cash inflows -
14952
605
,25
865,
050
415
,97
957,
198
633,
163
524,
223
246
,34
225
,55
-
32,66
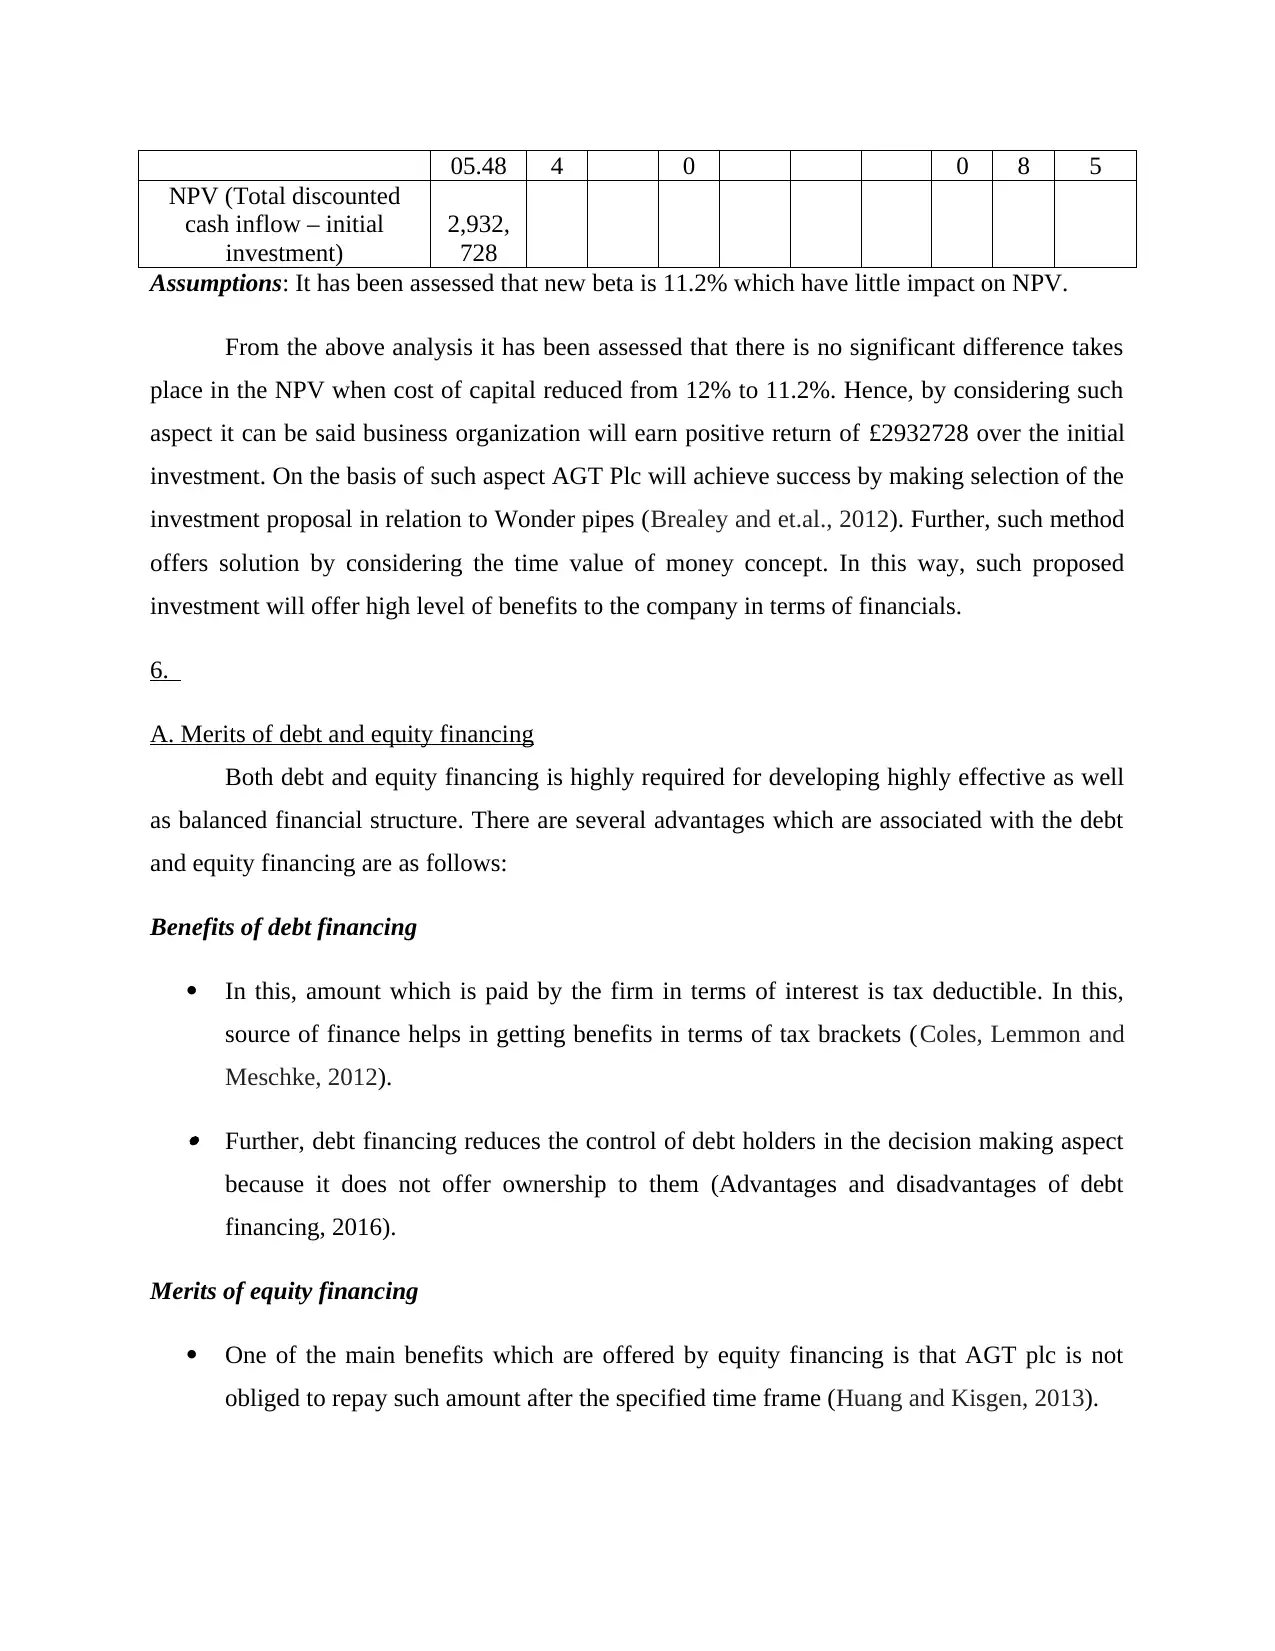
05.48 4 0 0 8 5
NPV (Total discounted
cash inflow – initial
investment)
2,932,
728
Assumptions: It has been assessed that new beta is 11.2% which have little impact on NPV.
From the above analysis it has been assessed that there is no significant difference takes
place in the NPV when cost of capital reduced from 12% to 11.2%. Hence, by considering such
aspect it can be said business organization will earn positive return of £2932728 over the initial
investment. On the basis of such aspect AGT Plc will achieve success by making selection of the
investment proposal in relation to Wonder pipes (Brealey and et.al., 2012). Further, such method
offers solution by considering the time value of money concept. In this way, such proposed
investment will offer high level of benefits to the company in terms of financials.
6.
A. Merits of debt and equity financing
Both debt and equity financing is highly required for developing highly effective as well
as balanced financial structure. There are several advantages which are associated with the debt
and equity financing are as follows:
Benefits of debt financing
In this, amount which is paid by the firm in terms of interest is tax deductible. In this,
source of finance helps in getting benefits in terms of tax brackets (Coles, Lemmon and
Meschke, 2012).
Further, debt financing reduces the control of debt holders in the decision making aspect
because it does not offer ownership to them (Advantages and disadvantages of debt
financing, 2016).
Merits of equity financing
One of the main benefits which are offered by equity financing is that AGT plc is not
obliged to repay such amount after the specified time frame (Huang and Kisgen, 2013).
⊘ This is a preview!⊘
Do you want full access?
Subscribe today to unlock all pages.
Trusted by 1+ million students worldwide
1 out of 15
Related Documents


Your All-in-One AI-Powered Toolkit for Academic Success.
+13062052269
info@desklib.com
Available 24*7 on WhatsApp / Email
![[object Object]](/_next/static/media/star-bottom.7253800d.svg)
Unlock your academic potential
Copyright © 2020–2026 A2Z Services. All Rights Reserved. Developed and managed by ZUCOL.