Corporate Financial Management: Portfolio Analysis and M&A Assessment

Verified

Added on  2020/07/23

|19
|2973
|56
Report
AI Summary
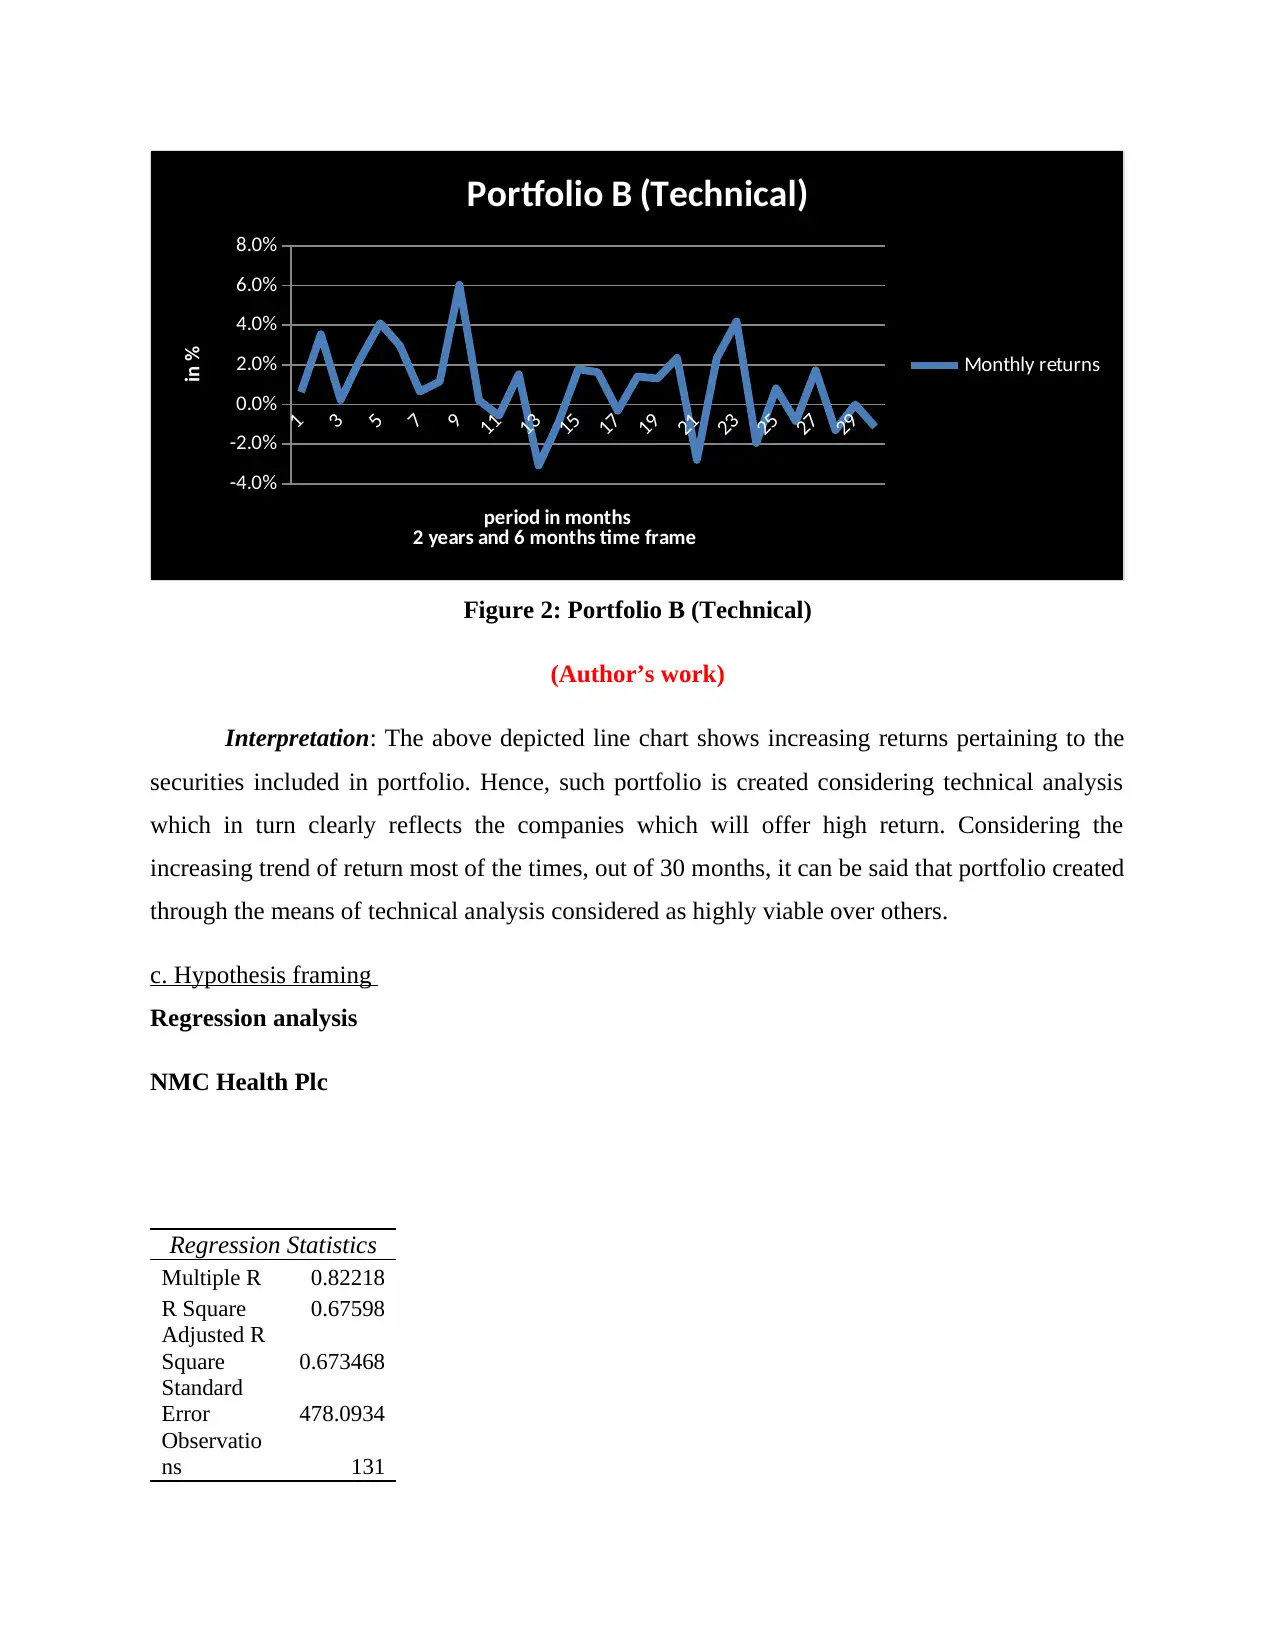
This report provides an in-depth analysis of corporate financial management, focusing on portfolio analysis and a case study on Bayer's acquisition of Monsanto. Part A of the report calculates and compares monthly logarithmic returns of two portfolios: one constructed randomly and the other using technical analysis. Statistical methods, including independent sample t-tests, are employed to assess the significance of the return differences. The findings suggest that portfolios created through technical analysis generally outperform random portfolios. Furthermore, the report critically evaluates the findings in the context of the Weak Form of Market Efficiency (WFME) and random walk theory. Part B assesses the financial implications of Bayer's support for the Monsanto acquisition, considering capital structure, cost of capital, and shareholder wealth maximization. The analysis examines the impact of debt financing on Bayer's financial position and provides recommendations based on financial literature and debt-equity ratios. The report concludes with a discussion on the importance of strategic financial decisions in corporate finance.
Document Page
Corporate Financial Management
tabler-icon-diamond-filled.svg

Paraphrase This Document

Need a fresh take? Get an instant paraphrase of this document with our AI Paraphraser
Document Page
TABLE OF CONTENTS
INTRODUCTION...........................................................................................................................3
PART A...........................................................................................................................................3
a. Calculating monthly logarithmic returns of the portfolio that include equally weighted 5
random companies.......................................................................................................................3
b. Creating an equally weighted portfolio by doing technical analysis and assessing monthly
returns..........................................................................................................................................5
c. Hypothesis framing..................................................................................................................6
d. Testing monthly logarithmic returns of both the portfolios by taking into account
independent sample t- test.........................................................................................................13
e. Discussion of findings derived through statistical evaluation...............................................14
f. Critically evaluating findings in the empirical study on WFME and random walk theory. . .14
PART B.........................................................................................................................................14
Assessing whether Bayer’s should support the deal pertaining to Monsanto’s acquisition......14
CONCLUSION..............................................................................................................................17
REFERENCES..............................................................................................................................18
Document Page
INTRODUCTION
Corporate finance field is highly associated with the measurement of risk and thereby
development as well as execution of competent strategic framework. In the recent times, high
level of emphasis is placed by the investors on the development and management of portfolio.
Hence, with the motive to diversify risk level now investors make focus on investing money in
varied securities rather than any one. Efficiency market hypothesis can be divided into three
parts such as weak, strong and semi-strong. On the basis of weak from efficiency, past
movements do not have significant impact on the price level of stock. In this, the present report
will provide deeper understanding about the random walk theory related to WFMs. Further, it
also depicts the manner in which proposed merger and acquisition plan will impact the wealth of
Bayer’s shareholders.
PART A
a. Calculating monthly logarithmic returns of the portfolio that include equally weighted 5
random companies
Months Portfolio A (Random)
1 0.0018
2 0.009
3 0.015
4 0.007
5 0.017
6 -0.022
7 0.011
8 0.019
9 -0.009
10 0.043
11 0.005
12 0.002
13 -0.024
Document Page
14 -0.006
15 0.001
16 -0.023
17 0.010
18 -0.002
19 0.005
20 0.005
21 -0.006
22 0.005
23 -0.006
24 0.009
25 -0.009
26 0.012
27 0.015
28 -0.008
29 0.010
30 -0.003
8.3%
tabler-icon-diamond-filled.svg

Paraphrase This Document

Need a fresh take? Get an instant paraphrase of this document with our AI Paraphraser
Document Page
1 2 3 4 5 6 7 8 9 10 11 12 13 14 15 16 17 18 19 20 21 22 23 24 25 26 27 28 29 30
-3.0%
-2.0%
-1.0%
0.0%
1.0%
2.0%
3.0%
4.0%
5.0%
Portfolio A (Random)
Monthly returns
Figure 1: Portfolio A (Random)
(Author’s work)
Interpretation: By doing evaluation of random portfolio that includes 5 companies from
FTSE 100 fluctuated trend has assessed. Hence, there is no consistency in the returns which are
offered by random portfolio. In one month, it increased and another one was showing declining
movement in the monthly returns. Hence, referring overall outcome or return such as 8% it can
be depicted that random portfolio will not provide suitable benefits to the investors. Hence,
investors should consider specific framework or policies while making selection of stock for
portfolio.
b. Creating an equally weighted portfolio by doing technical analysis and assessing monthly
returns
Months ((Time frame: 2
years and 6 months so
there is total months) Portfolio B (Technical)
Document Page
1 0.0062
2 0.035
3 0.002
4 0.023
5 0.041
6 0.030
7 0.007
8 0.012
9 0.060
10 0.002
11 -0.006
12 0.015
13 -0.031
14 -0.009
15 0.018
16 0.016
17 -0.003
18 0.014
19 0.013
20 0.024
21 -0.028
22 0.023
23 0.042
24 -0.019
25 0.008
26 -0.008
27 0.017
28 -0.013
29 0.000
30 -0.011
28.0%
Document Page
1
3
5
7
9
11
13
15
17
19
21
23
25
27
29
-4.0%
-2.0%
0.0%
2.0%
4.0%
6.0%
8.0%
Portfolio B (Technical)
Monthly returns
period in months
2 years and 6 months time frame
in %
Figure 2: Portfolio B (Technical)
(Author’s work)
Interpretation: The above depicted line chart shows increasing returns pertaining to the
securities included in portfolio. Hence, such portfolio is created considering technical analysis
which in turn clearly reflects the companies which will offer high return. Considering the
increasing trend of return most of the times, out of 30 months, it can be said that portfolio created
through the means of technical analysis considered as highly viable over others.
c. Hypothesis framing
Regression analysis
NMC Health Plc
Regression Statistics
Multiple R 0.82218
R Square 0.67598
Adjusted R
Square 0.673468
Standard
Error 478.0934
Observatio
ns 131
tabler-icon-diamond-filled.svg

Paraphrase This Document

Need a fresh take? Get an instant paraphrase of this document with our AI Paraphraser
Document Page
ANOVA
df SS MS F
Significan
ce F
Regression 1
6151446
4
6151446
4
269.12
36 2.3E-33
Residual 129
2948595
4
228573.
3
Total 130
9100041
9
Coefficien
ts
Standar
d Error t Stat P-value
Lower
95%
Upper
95%
Lower
95.0%
Upper
95.0%
Intercept -6912.32
532.118
6
-
12.9902
3.44E-
25 -7965.13
-
5859.5073
18
-
7965.1
3
-
5859.5
1
FTSE 1.283058
0.07821
1
16.4049
9
2.3E-
33 1.128315
1.4378017
5
1.1283
15
1.4378
02
0.381679389312978 50 99.618320610687
0
1000
2000
3000
4000
Normal Probability Plot
Series1
Sample Percentile
NMC Health Plc
5500 6000 6500 7000 7500 8000
-1500
-1000
-500
0
500
1000
1500
FTSE Residual Plot
FTSE
Residuals
Document Page
Rentokil Initial plc
Regression Statistics
Multiple R 0.821502
R Square 0.674865
Adjusted
R Square 0.672345
Standard
Error 32.48444
Observatio
ns 131
ANOVA
df SS MS F
Significan
ce F
Regressio
n 1
282549
.6
282549
.6
267.75
88 2.87E-33
Residual 129
136125
.9
1055.2
39
Total 130
418675
.4
Coefficie
nts
Standar
d Error t Stat P-value
Lower
95%
Upper
95%
Lower
95.0%
Upper
95.0%
Intercept -360.211
36.155
23
-
9.9629
1
1.09E-
17 -431.745
-
288.67
7
-
431.74
5
-
288.67
7
FTSE 0.086957
0.0053
14
16.363
34
2.87E-
33 0.076443
0.0974
71
0.0764
43
0.0974
71
0.381679389312978 50 99.618320610687
0
100
200
300
400
Normal Probability Plot
Series1
Sample Percentile
Rentokil Initial plc
Document Page
5500 6000 6500 7000 7500 8000
-100
-50
0
50
100
FTSE Residual Plot
FTSE
Residuals
Intertek Group plc
Regression Statistics
Multiple R 0.789156
R Square 0.622767
Adjusted
R Square 0.619842
Standard
Error 552.5551
Observati
ons 131
ANOVA
df SS MS F
Significan
ce F
Regressio
n 1
650213
85
650213
85
212.96
34 4.35E-29
Residual 129
393859
10
305317.
1
Total 130
1.04E+
08
Coefficie
nts
Standar
d Error t Stat P-value
Lower
95%
Upper
95%
Lower
95.0%
Upper
95.0%
Intercept -5157.66 614.994
5
-
8.38651
7.52E-
14
-6374.44 -
3940.8
-
6374.4
-
3940.8
tabler-icon-diamond-filled.svg

Paraphrase This Document

Need a fresh take? Get an instant paraphrase of this document with our AI Paraphraser
Document Page
8 4 8
FTSE 1.319125
0.09039
3
14.5932
7
4.35E-
29 1.140281
1.4979
69
1.1402
81
1.4979
69
0.381679389312978 50 99.618320610687
0
1000
2000
3000
4000
5000
6000
Normal Probability Plot
Series1
Sample Percentile
Intertek Group plc
5500 6000 6500 7000 7500 8000
-2000
-1500
-1000
-500
0
500
1000
1500
FTSE Residual Plot
FTSE
Residuals
DCC Plc
Regression Statistics
Multiple R
0.6171
37
R Square
0.3808
58
Adjusted R
Square
0.3760
58
Standard
Error
577.67
64
Observation
s 131
Document Page
ANOVA
df SS MS F
Significa
nce F
Regression 1 26480816
26480
816
79.35
277 4.18E-15
Residual 129 43048597
33371
0.1
Total 130 69529413
Coeffici
ents
Standard
Error t Stat
P-
value
Lower
95%
Upper
95%
Lower
95.0%
Upper
95.0%
Intercept
743.19
45 642.9546
1.1559
05
0.249
856 -528.907
2015.2
96
-
528.907
2015.29
6
FTSE
0.8418
28 0.094502
8.9080
17
4.18E
-15 0.654853
1.0288
03
0.65485
3
1.02880
3
0
0.2
0.4
0.6
0.8
1
1.2
Normal Probability Plot
Series1
Sample Percentile
DCC
5500 6000 6500 7000 7500 8000
0
5
10
15
FTSE Residual Plot
FTSE
Residuals
Fresnillo Plc
chevron_up_icon
1 out of 19
circle_padding
hide_on_mobile
zoom_out_icon
[object Object]