Corporate Accounting: Financial Performance Analysis of Two ASX Firms
VerifiedAdded on 2020/12/10
|19
|5194
|233
Report
AI Summary
This comprehensive corporate accounting report evaluates the financial performance of Bapcor Limited and Beacon Lighting Group Limited, two ASX-listed firms, over a three-year period. The analysis encompasses a detailed examination of their cash flow statements, income statements, and balance sheets, assessing profitability, liquidity, and efficiency. The report delves into owner's equity, comparative capital structures, and the components of cash flow activities, including operating, investing, and financing activities. It also addresses other comprehensive income, accounting for corporate income tax, and the implications of deferred tax assets and liabilities. The study provides a comparative analysis of the two companies, highlighting key financial metrics and offering insights into their respective financial health and performance.

CORPORATE ACCOUNTING
Paraphrase This Document
Need a fresh take? Get an instant paraphrase of this document with our AI Paraphraser
Executive Summary
Finance is required in the corporate world in order to attain operational activities. The
financial health of two ASX listed firms that is Bapcor Limited and Beacon Lighting Group
Limited is evaluated for last three years with regards to annual reports. The cash flow statements,
income statements and balance sheet are assessed from various perspectives and results are
accomplished thereof. Financial health of two companies are compared for assessing
profitability, liquidity and efficiency position.
TABLE OF CONTENTS
INTRODUCTION...........................................................................................................................1
OWNER'S EQUITY........................................................................................................................2
1. Representing each item of equity with its changes over past year of both organizations.......2
2. Representing comparative analysis of capital structure of both organization ........................3
CASH FLOWS STATEMENT.......................................................................................................5
3. List out each item reported in cash flows statement and discussing reasons for change in
past years.....................................................................................................................................5
4. Comparative analysis of cash flow activities over past years.................................................6
5. Providing comparative analysis of two listed organisations...................................................8
OTHER COMPREHENSIVE INCOME STATEMENT................................................................9
6. Items reported in other comprehensive income statement for both companies......................9
7. Stating reasons for not including items of Other Comprehensive Income in Profit and loss
statements....................................................................................................................................9
8. Providing comparative analysis of organisations of items in other comprehensive
income statement and discussing any change if it were included in income statement.............9
9. Other comprehensive income must be considered for process of performance evaluation or
not?............................................................................................................................................11
ACCOUNTING FOR CORPORATE INCOME TAX..................................................................12
10. Representing the latest tax expense of both organizations..................................................12
11. Representing effective tax rate of both companies.............................................................12
12. Comment on deferred tax asset and liability stated in statement of financial position.......12
13. Representing change in deferred tax asset and liability (DTA and DTL) reported through
each organization .....................................................................................................................13
14. Representing Cash tax amount............................................................................................14
15. Representing Cash tax rate..................................................................................................14
16. Why cash tax rate is different from book tax rate...............................................................15
CONCLUSION..............................................................................................................................15
REFERENCES..............................................................................................................................16
⊘ This is a preview!⊘
Do you want full access?
Subscribe today to unlock all pages.
Trusted by 1+ million students worldwide
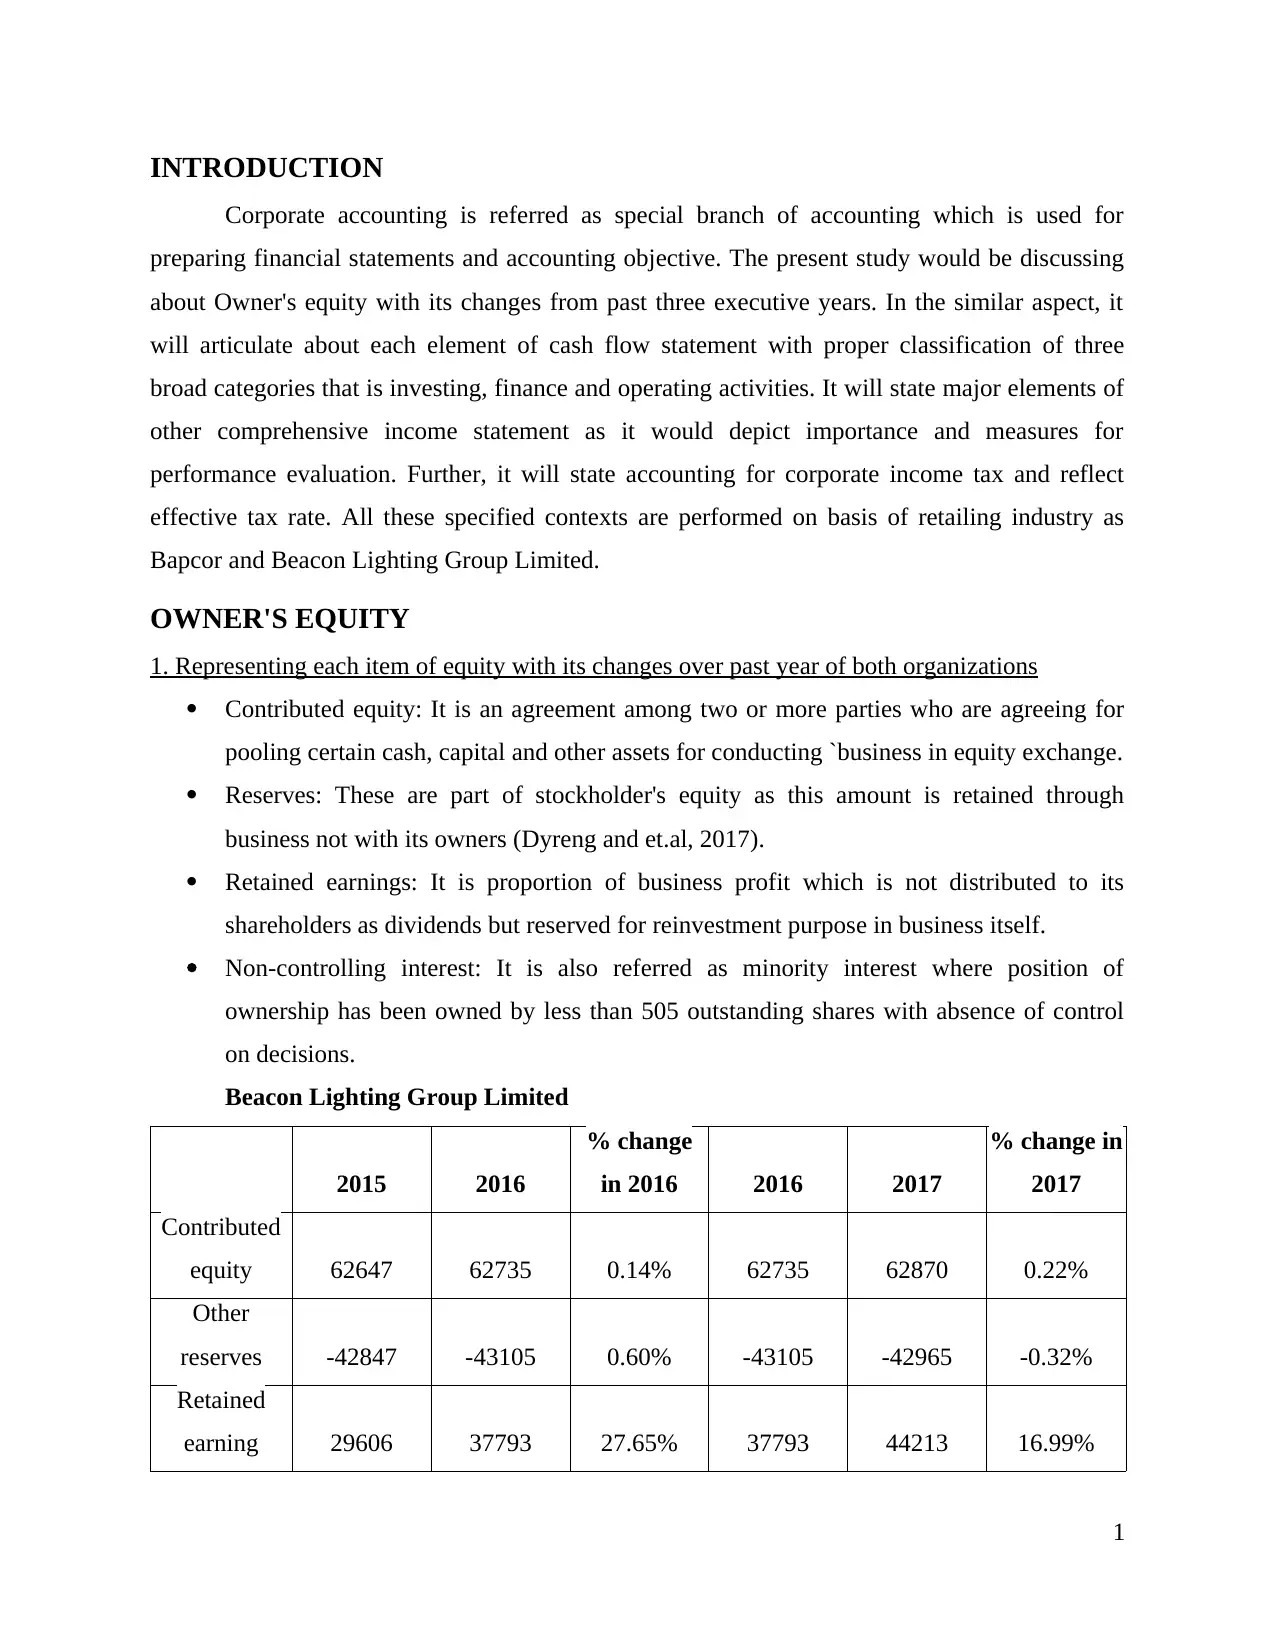
INTRODUCTION
Corporate accounting is referred as special branch of accounting which is used for
preparing financial statements and accounting objective. The present study would be discussing
about Owner's equity with its changes from past three executive years. In the similar aspect, it
will articulate about each element of cash flow statement with proper classification of three
broad categories that is investing, finance and operating activities. It will state major elements of
other comprehensive income statement as it would depict importance and measures for
performance evaluation. Further, it will state accounting for corporate income tax and reflect
effective tax rate. All these specified contexts are performed on basis of retailing industry as
Bapcor and Beacon Lighting Group Limited.
OWNER'S EQUITY
1. Representing each item of equity with its changes over past year of both organizations
Contributed equity: It is an agreement among two or more parties who are agreeing for
pooling certain cash, capital and other assets for conducting `business in equity exchange.
Reserves: These are part of stockholder's equity as this amount is retained through
business not with its owners (Dyreng and et.al, 2017).
Retained earnings: It is proportion of business profit which is not distributed to its
shareholders as dividends but reserved for reinvestment purpose in business itself.
Non-controlling interest: It is also referred as minority interest where position of
ownership has been owned by less than 505 outstanding shares with absence of control
on decisions.
Beacon Lighting Group Limited
2015 2016
% change
in 2016 2016 2017
% change in
2017
Contributed
equity 62647 62735 0.14% 62735 62870 0.22%
Other
reserves -42847 -43105 0.60% -43105 -42965 -0.32%
Retained
earning 29606 37793 27.65% 37793 44213 16.99%
1
Paraphrase This Document
Need a fresh take? Get an instant paraphrase of this document with our AI Paraphraser
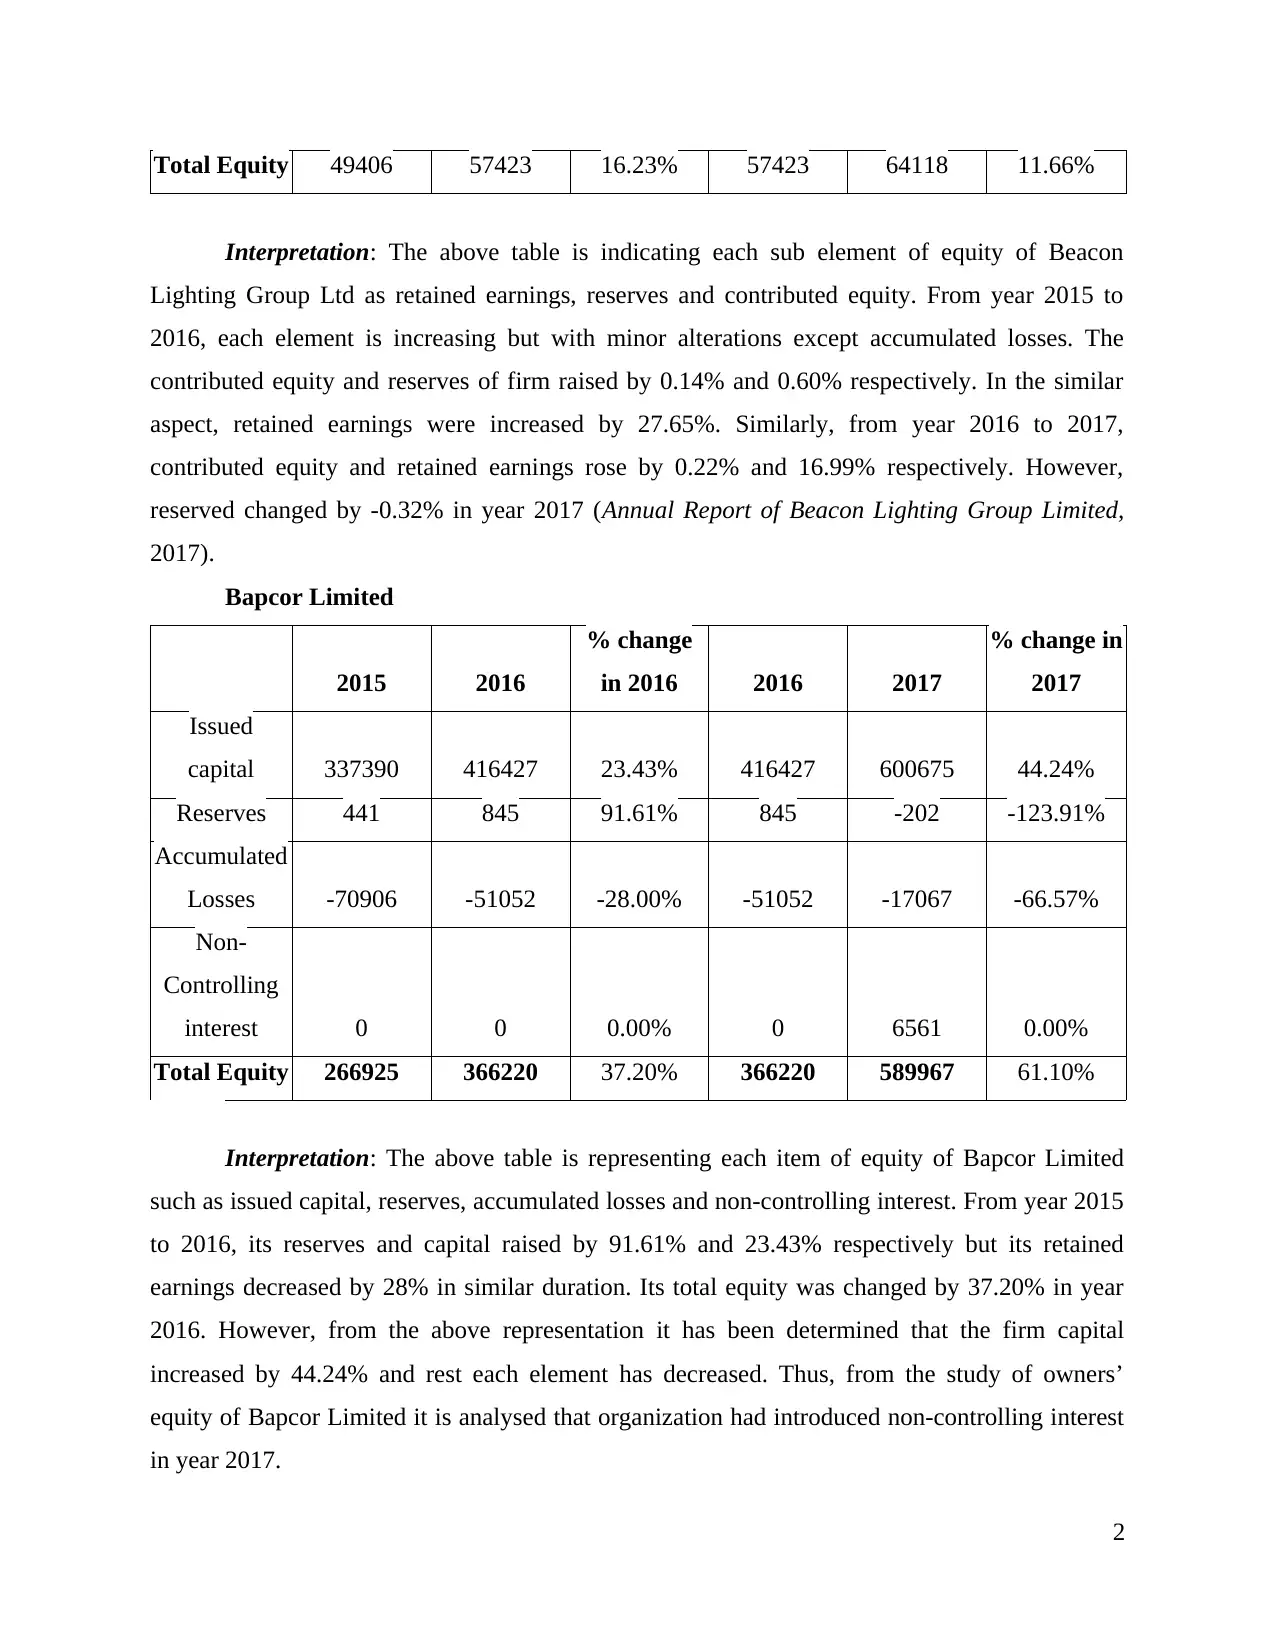
Total Equity 49406 57423 16.23% 57423 64118 11.66%
Interpretation: The above table is indicating each sub element of equity of Beacon
Lighting Group Ltd as retained earnings, reserves and contributed equity. From year 2015 to
2016, each element is increasing but with minor alterations except accumulated losses. The
contributed equity and reserves of firm raised by 0.14% and 0.60% respectively. In the similar
aspect, retained earnings were increased by 27.65%. Similarly, from year 2016 to 2017,
contributed equity and retained earnings rose by 0.22% and 16.99% respectively. However,
reserved changed by -0.32% in year 2017 (Annual Report of Beacon Lighting Group Limited,
2017).
Bapcor Limited
2015 2016
% change
in 2016 2016 2017
% change in
2017
Issued
capital 337390 416427 23.43% 416427 600675 44.24%
Reserves 441 845 91.61% 845 -202 -123.91%
Accumulated
Losses -70906 -51052 -28.00% -51052 -17067 -66.57%
Non-
Controlling
interest 0 0 0.00% 0 6561 0.00%
Total Equity 266925 366220 37.20% 366220 589967 61.10%
Interpretation: The above table is representing each item of equity of Bapcor Limited
such as issued capital, reserves, accumulated losses and non-controlling interest. From year 2015
to 2016, its reserves and capital raised by 91.61% and 23.43% respectively but its retained
earnings decreased by 28% in similar duration. Its total equity was changed by 37.20% in year
2016. However, from the above representation it has been determined that the firm capital
increased by 44.24% and rest each element has decreased. Thus, from the study of owners’
equity of Bapcor Limited it is analysed that organization had introduced non-controlling interest
in year 2017.
2
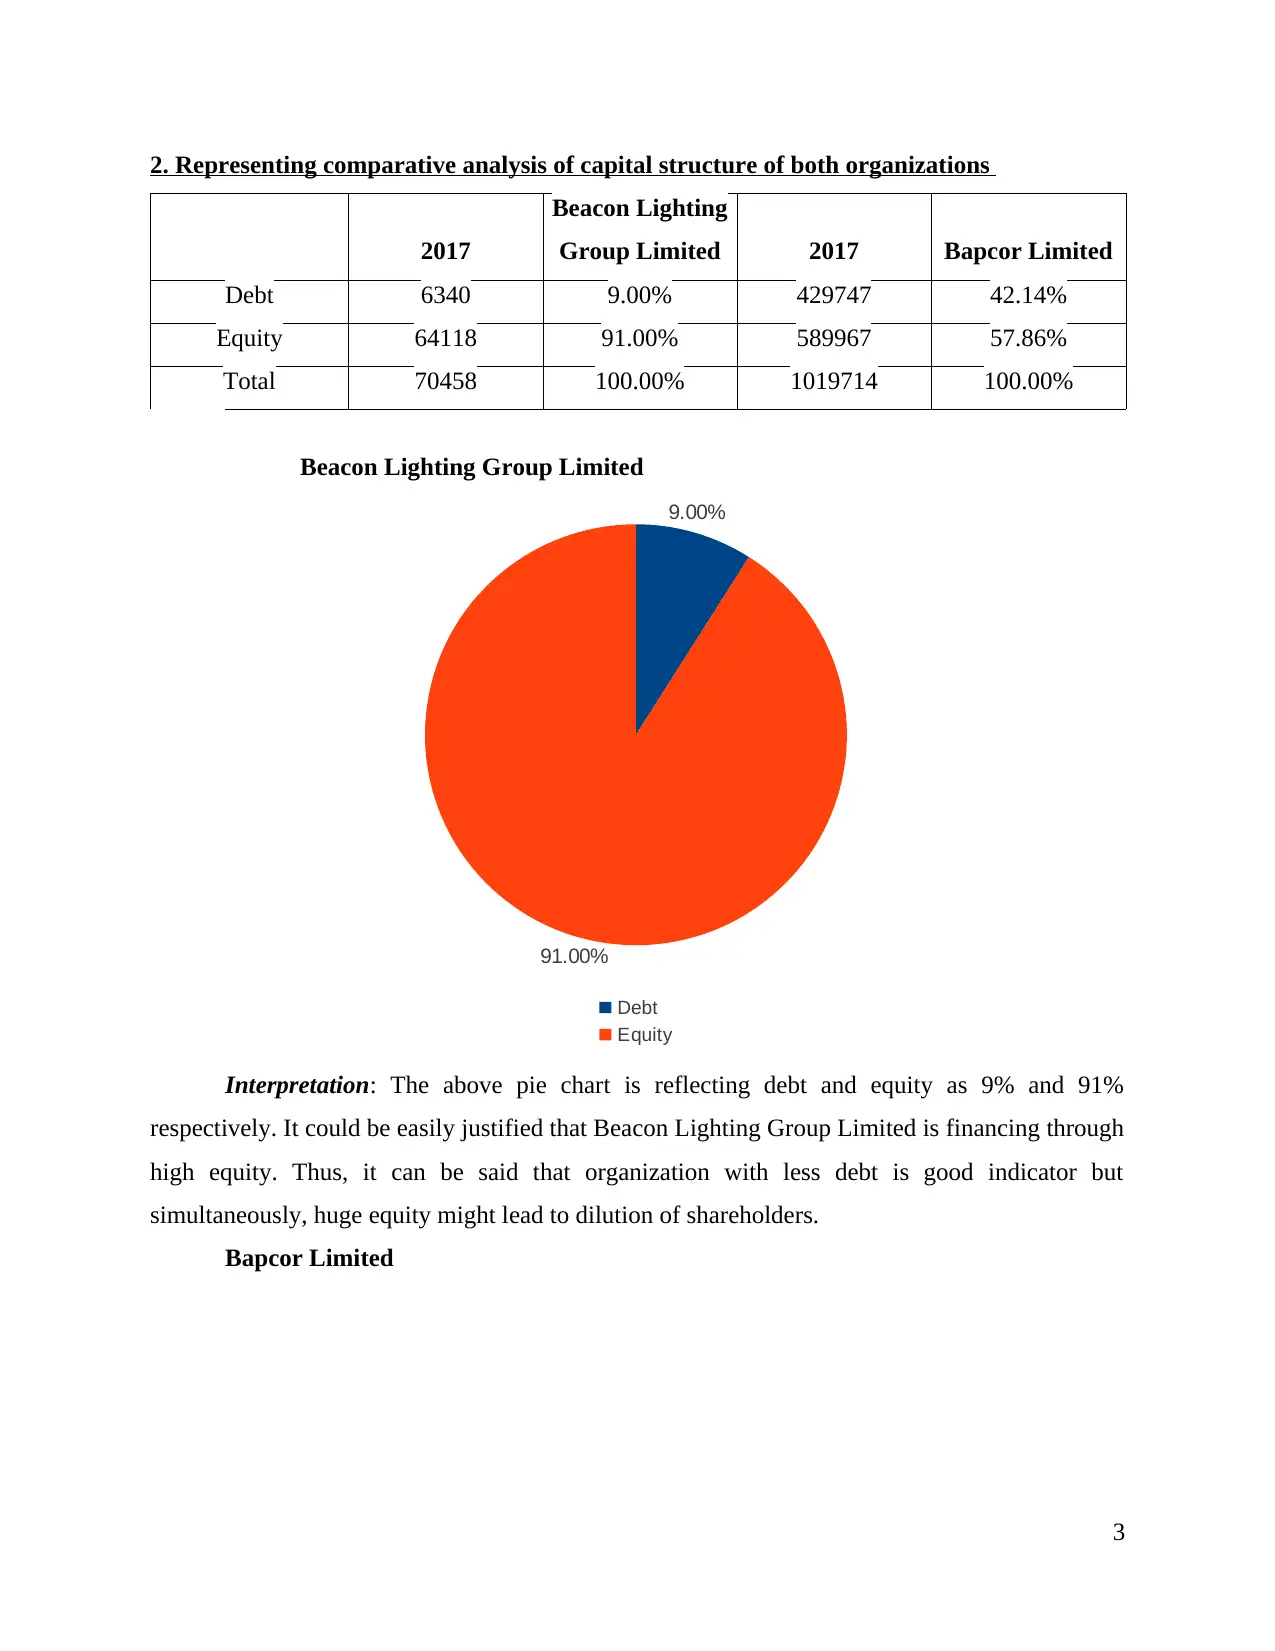
2. Representing comparative analysis of capital structure of both organizations
2017
Beacon Lighting
Group Limited 2017 Bapcor Limited
Debt 6340 9.00% 429747 42.14%
Equity 64118 91.00% 589967 57.86%
Total 70458 100.00% 1019714 100.00%
Beacon Lighting Group Limited
9.00%
91.00%
Debt
Equity
Interpretation: The above pie chart is reflecting debt and equity as 9% and 91%
respectively. It could be easily justified that Beacon Lighting Group Limited is financing through
high equity. Thus, it can be said that organization with less debt is good indicator but
simultaneously, huge equity might lead to dilution of shareholders.
Bapcor Limited
3
⊘ This is a preview!⊘
Do you want full access?
Subscribe today to unlock all pages.
Trusted by 1+ million students worldwide
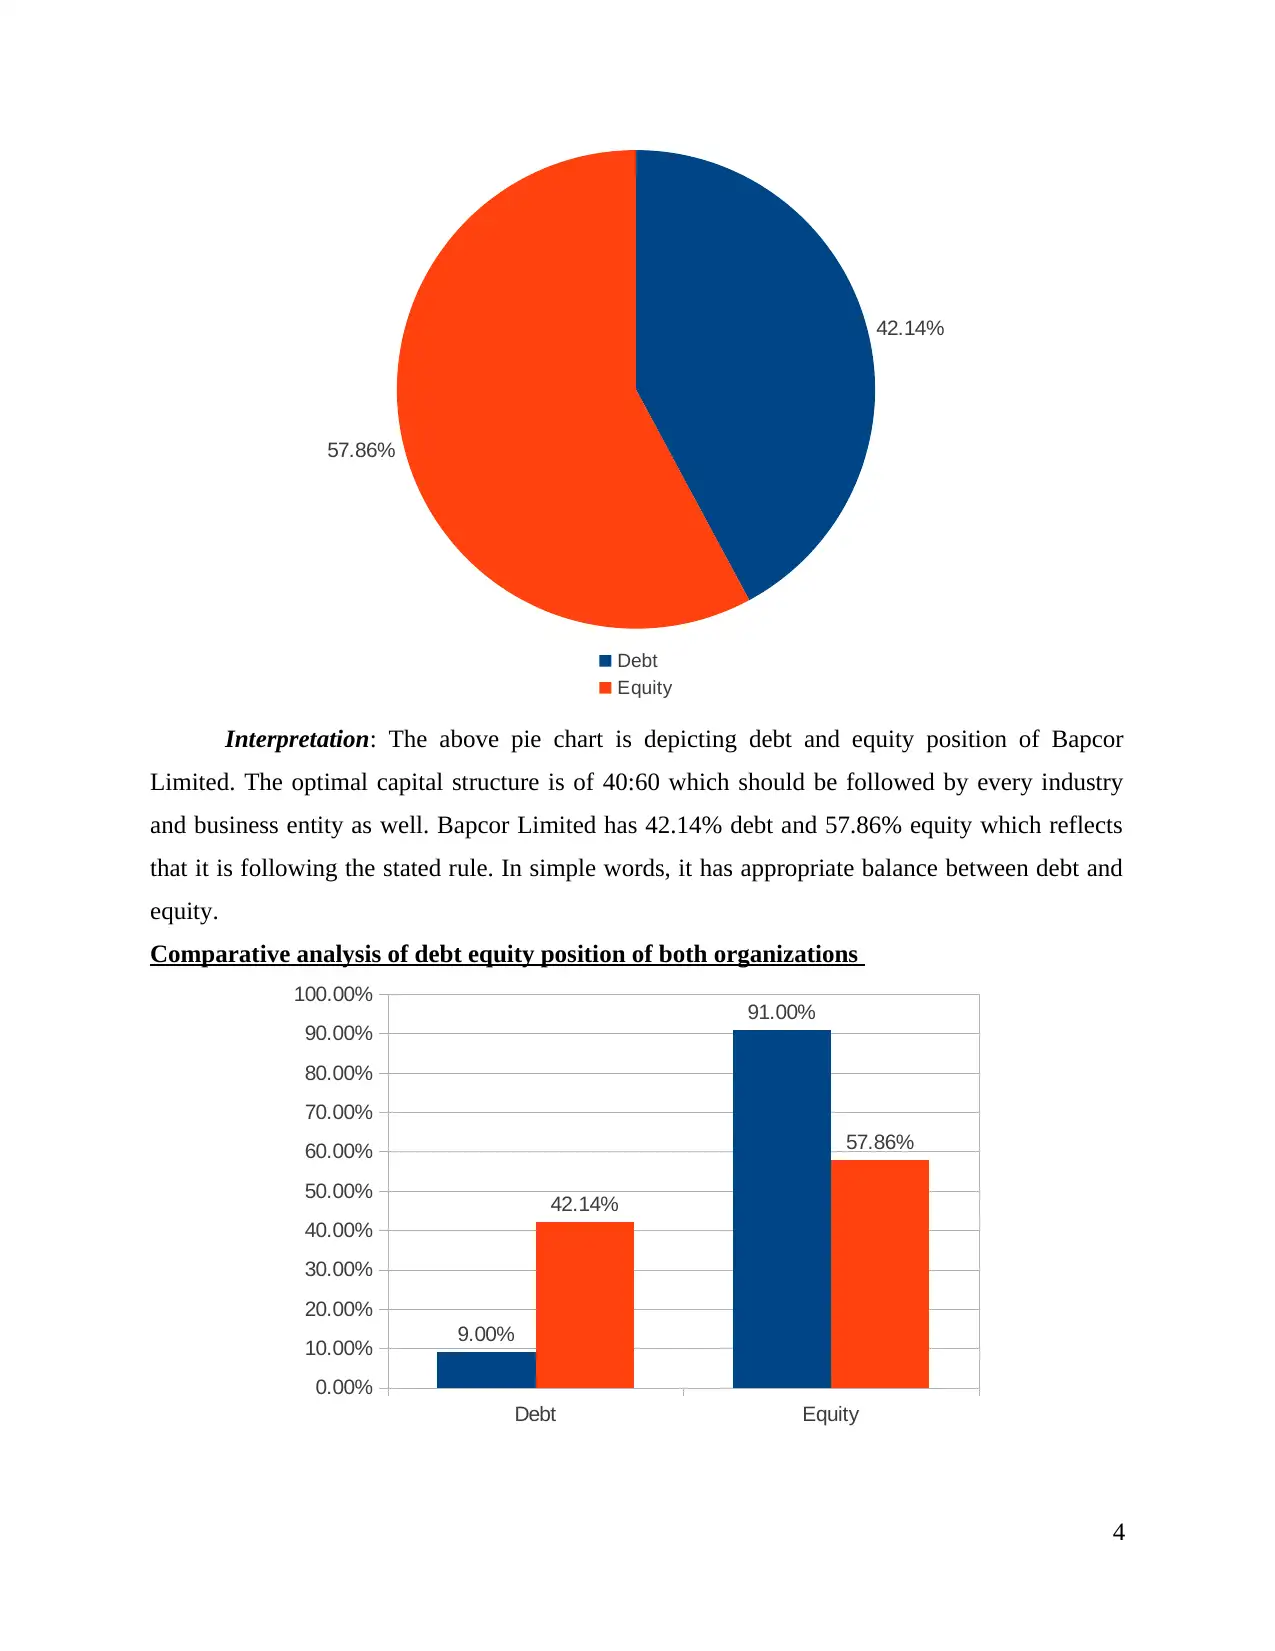
42.14%
57.86%
Debt
Equity
Interpretation: The above pie chart is depicting debt and equity position of Bapcor
Limited. The optimal capital structure is of 40:60 which should be followed by every industry
and business entity as well. Bapcor Limited has 42.14% debt and 57.86% equity which reflects
that it is following the stated rule. In simple words, it has appropriate balance between debt and
equity.
Comparative analysis of debt equity position of both organizations
Debt Equity
0.00%
10.00%
20.00%
30.00%
40.00%
50.00%
60.00%
70.00%
80.00%
90.00%
100.00%
9.00%
91.00%
42.14%
57.86%
4
57.86%
Debt
Equity
Interpretation: The above pie chart is depicting debt and equity position of Bapcor
Limited. The optimal capital structure is of 40:60 which should be followed by every industry
and business entity as well. Bapcor Limited has 42.14% debt and 57.86% equity which reflects
that it is following the stated rule. In simple words, it has appropriate balance between debt and
equity.
Comparative analysis of debt equity position of both organizations
Debt Equity
0.00%
10.00%
20.00%
30.00%
40.00%
50.00%
60.00%
70.00%
80.00%
90.00%
100.00%
9.00%
91.00%
42.14%
57.86%
4
Paraphrase This Document
Need a fresh take? Get an instant paraphrase of this document with our AI Paraphraser
Beacon Lights
Bapcor
Interpretation: The above graph is reflecting comparative analysis of capital structure of
both Bapcor and Beacon Lighting Group Limited. Generally, capital is combination of debt and
equity. It had been observed that Bapcor Limited has optimal capital structure as compared to
Beacon Lighting Group Ltd. Thus, by performing comparative analysis it is clear that Bapcor Ltd
has high debt and less equity.
CASH FLOWS STATEMENT
3. List out each item reported in cash flows statement and discussing reasons for change in past
years
The operating activities have increased of Bapcor Limited particularly operating activity
item which receipts from customers which were 411,768 in 2015, reached to 771,029 in next
year and increased to 1,114,521. Payments to suppliers and employees were made. Borrowing
costs were 3225 in 2015 and increased to 3957 and further increased to 9288. This means that
borrowings have increased. Transaction costs relating to acquisition of business were -1029 in
2016 and increased to 8482 in 2017. Income taxes were 18004 in 2016 and reached 30002 which
clarifies that income in recent year has maximised. Payments for new store inventory purchases
were -6150 in 2016 and reached 11532 in 2017. Investing activities are changed in over the years
and as such, changes are prevailing. Major found is purchase of business which was -289012 in
2016 and reached to -373238 in 2017.
Deferred settlements were -6511 in 2017. Payments for PPE were 12020 in 2016 and
reached 15096 in 2017. Intangibles and proceeds from disposing have also increased. Cash flow
from financing activities were found of which net proceeds from borrowings were 148,800 in
2016 and increased to 283,429 in 2017. Proceeds from issue of shares have increased
highlighting that equity financing is used in more quantum. Share issue transaction costs were -
1068 in 2016 and reached 4596 in 2017. Purchase of treasury shares and repayment of acquired
loans were made in 2017. Dividends paid and borrowings costs are also increased.
The operating activities of Beacon Lighting Group Limited were receipts from customers
which were 208300 in 2016 and increased to 238846 in 2017. While, major change was found in
payments made to suppliers amounting to -187815 in 2016 and -209,926 in 2017. Investing and
financing activities were also undergone changes over the past years. Interest received was
5
decreased and borrowings costs have maximised. Investing activities were payment from
acquisitions which were -1425 in 2016 and increased to -6025 in 2017. Payments for PPE and
proceeds from sale have increased in 2017. From financing activities, net proceeds from
borrowings were 2791 in 2016 and maximised to 8109 in 2017. Moreover, dividends paid were -
10111 in 2016 and increased to -10224 in 2017.
4. Comparative analysis of cash flow activities over past years
Bapcor
Limited
2015 (taken
as base
year)
2016 % change 2016 (taken
as base
year)
2017 % change
Cash from
operating
activities
34424 39263 14.06% 39263 61,904 57.66%
Cash from
investing
activities
-12,595 -302,710 2303.41% -302,710 -394991 30.48%
Cash from
financing
activities
75,204 177,943 136.61% 177,943 351,353 97.45%
Beacon
Lighting
Group
Limited
2015 (taken
as base
year)
2016 % change 2016 (taken
as base
year)
2017 % change
6
⊘ This is a preview!⊘
Do you want full access?
Subscribe today to unlock all pages.
Trusted by 1+ million students worldwide
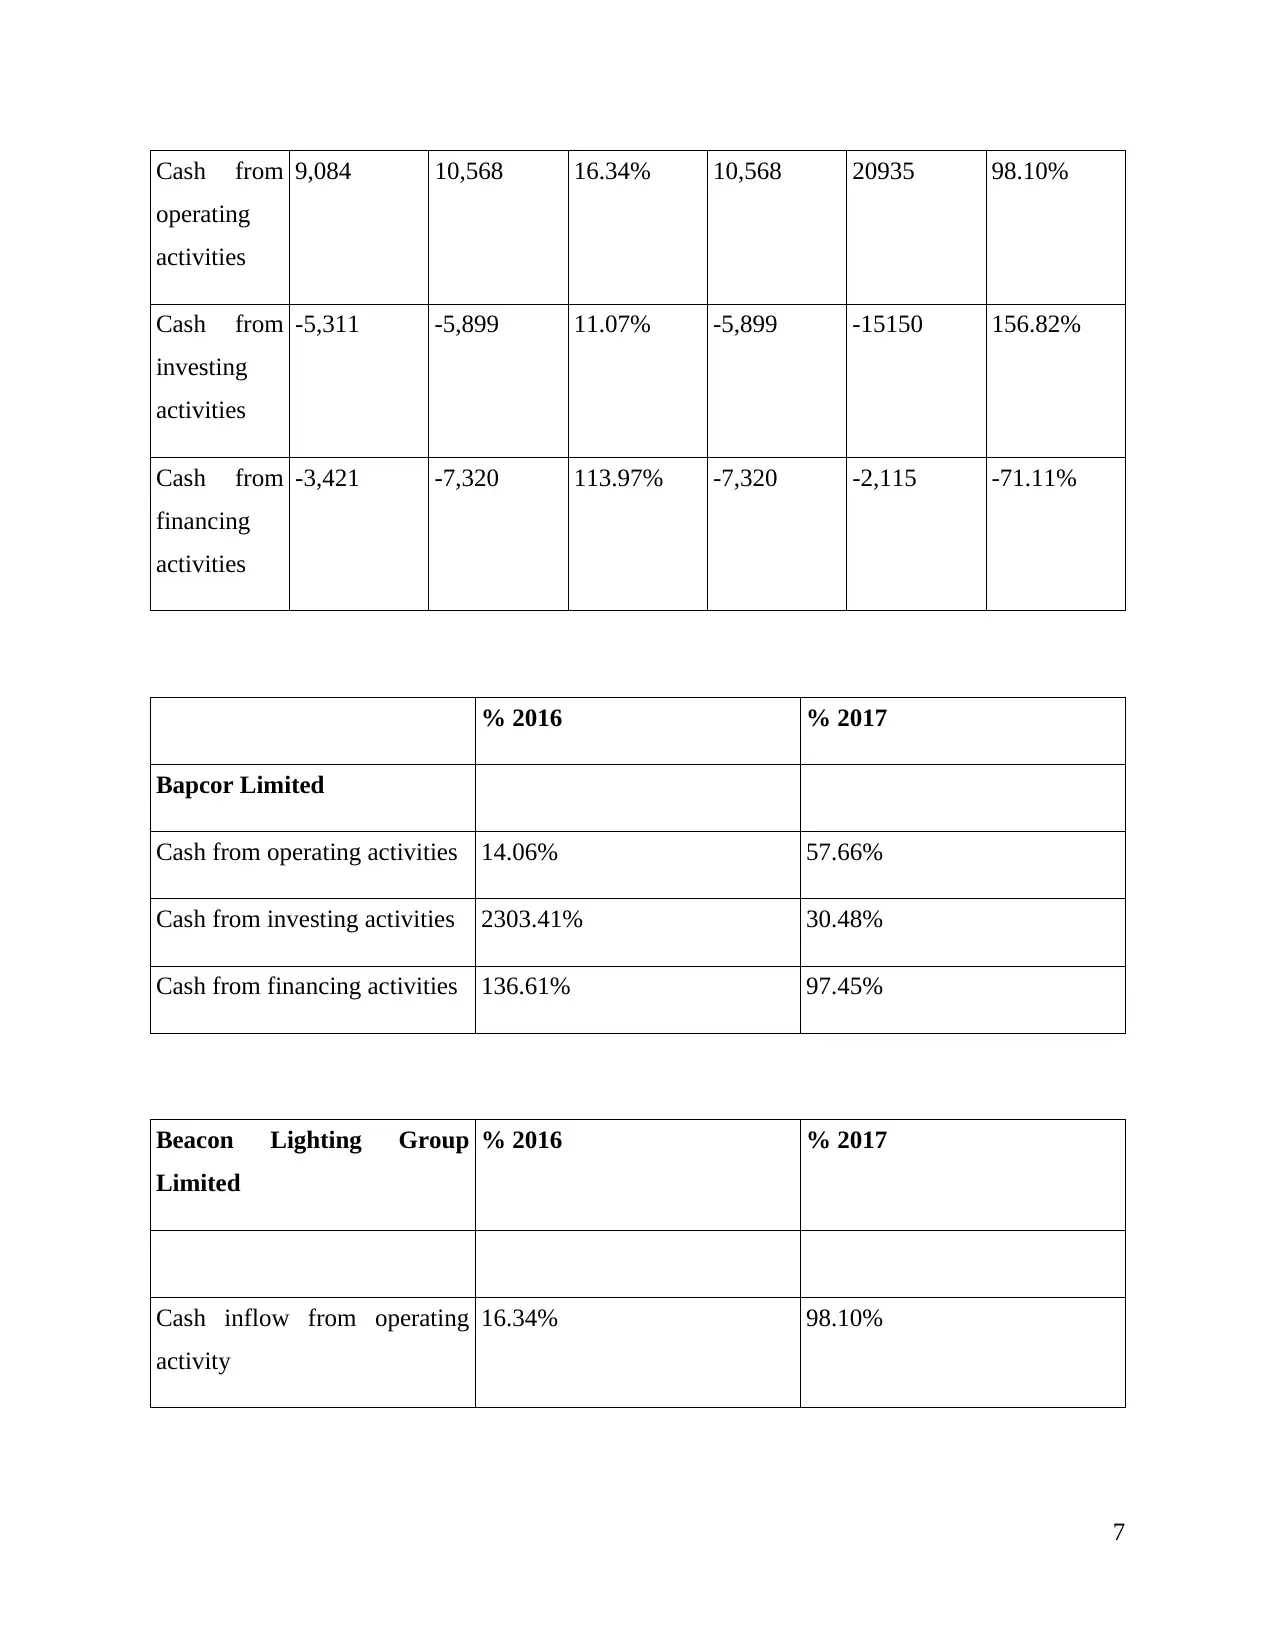
Cash from
operating
activities
9,084 10,568 16.34% 10,568 20935 98.10%
Cash from
investing
activities
-5,311 -5,899 11.07% -5,899 -15150 156.82%
Cash from
financing
activities
-3,421 -7,320 113.97% -7,320 -2,115 -71.11%
% 2016 % 2017
Bapcor Limited
Cash from operating activities 14.06% 57.66%
Cash from investing activities 2303.41% 30.48%
Cash from financing activities 136.61% 97.45%
Beacon Lighting Group
Limited
% 2016 % 2017
Cash inflow from operating
activity
16.34% 98.10%
7
Paraphrase This Document
Need a fresh take? Get an instant paraphrase of this document with our AI Paraphraser
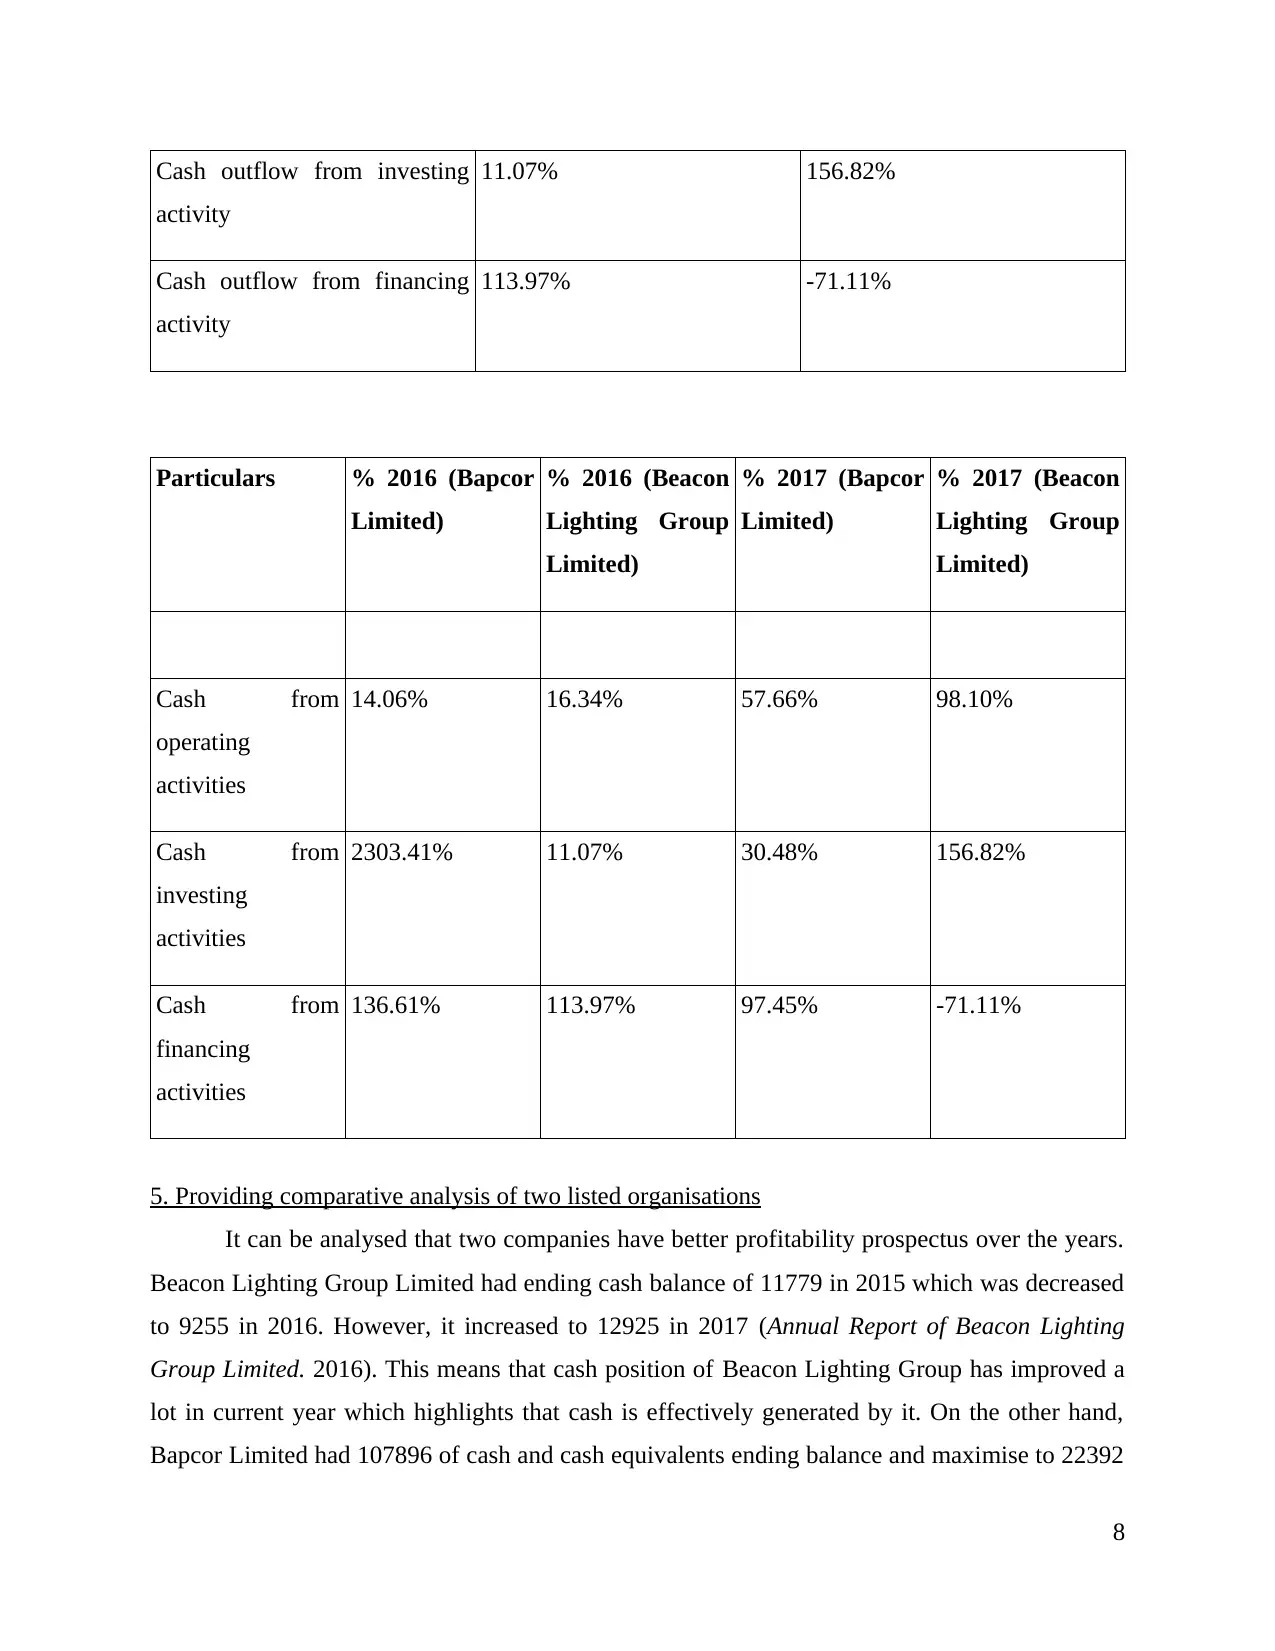
Cash outflow from investing
activity
11.07% 156.82%
Cash outflow from financing
activity
113.97% -71.11%
Particulars % 2016 (Bapcor
Limited)
% 2016 (Beacon
Lighting Group
Limited)
% 2017 (Bapcor
Limited)
% 2017 (Beacon
Lighting Group
Limited)
Cash from
operating
activities
14.06% 16.34% 57.66% 98.10%
Cash from
investing
activities
2303.41% 11.07% 30.48% 156.82%
Cash from
financing
activities
136.61% 113.97% 97.45% -71.11%
5. Providing comparative analysis of two listed organisations
It can be analysed that two companies have better profitability prospectus over the years.
Beacon Lighting Group Limited had ending cash balance of 11779 in 2015 which was decreased
to 9255 in 2016. However, it increased to 12925 in 2017 (Annual Report of Beacon Lighting
Group Limited. 2016). This means that cash position of Beacon Lighting Group has improved a
lot in current year which highlights that cash is effectively generated by it. On the other hand,
Bapcor Limited had 107896 of cash and cash equivalents ending balance and maximise to 22392
8
activity
11.07% 156.82%
Cash outflow from financing
activity
113.97% -71.11%
Particulars % 2016 (Bapcor
Limited)
% 2016 (Beacon
Lighting Group
Limited)
% 2017 (Bapcor
Limited)
% 2017 (Beacon
Lighting Group
Limited)
Cash from
operating
activities
14.06% 16.34% 57.66% 98.10%
Cash from
investing
activities
2303.41% 11.07% 30.48% 156.82%
Cash from
financing
activities
136.61% 113.97% 97.45% -71.11%
5. Providing comparative analysis of two listed organisations
It can be analysed that two companies have better profitability prospectus over the years.
Beacon Lighting Group Limited had ending cash balance of 11779 in 2015 which was decreased
to 9255 in 2016. However, it increased to 12925 in 2017 (Annual Report of Beacon Lighting
Group Limited. 2016). This means that cash position of Beacon Lighting Group has improved a
lot in current year which highlights that cash is effectively generated by it. On the other hand,
Bapcor Limited had 107896 of cash and cash equivalents ending balance and maximise to 22392
8
in 2016 and maximised to 39755 in 2017 which shows that cash health of Bapcor Limited is
good in comparison to peer organisation. Cash from operating activities were 14.06 % in 2016
and increased to 57.66 % in 2017 of Bapcor Limited. While, from investing activities, figure was
2303.41 % in 2016 and 30.48 % change was found in next year.
Cash from financing activities were 75204 in 2015, reached to 177943 and increased to
351353 having 136.61 % change in 2016 and of 97.45 % in 2017. Beacon Lighting Group
Limited had 9084 from cash of operating activities, increased to 10568 in 2016 having change of
16.34 % which further maximised to 20935 in 2017 with change of 98.10 %. Investing activities
were -5311 in 2015, reached to -5899 in 2016 having change amounting to 11.07 %. Moreover,
in 2017, figure reached to -15150, thereby change of 156.82 % were found. The same was found
in cash from financing activities of Beacon Lighting Group Limited which were -3421 in 2015
and increased to -7320 in 2016, total % change was 113.97 %. This was decreased to -2115 in
2017 having -71.11 % change. Overall, it shows that Bapcor Limited has good cash position.
OTHER COMPREHENSIVE INCOME STATEMENT
6. Items reported in other comprehensive income statement for both companies
The other comprehensive income statement has been made for both companies. There are
various items which are not recorded in it. Bapcor Limited has items which are being recorded in
this statement such as fair value of hedges, changes in foreign currency translation. On the other
side, Beacon Lighting Group Limited had items such as changes found in derivatives value,
income tax on items etc.
7. Stating reasons for not including items of Other Comprehensive Income in Profit and loss
statements
OCI consists of revenues, gains, expenses, losses and revenue which are excluded from
net income with context of income statement. These are stated as other comprehensive income
which are not yet realised. It has been specified with context of accounting standards that OCI
could not be contributed in net income of organization. The numbers are stated in accumulated
form of OCI with context to balance sheet of organization as shareholder's equity. In this
statement only unrealized items are directly claimed as income. It should be deducted from
balance sheet of organization and are considered in realized loss or gain in profit and loss
statement.
9
⊘ This is a preview!⊘
Do you want full access?
Subscribe today to unlock all pages.
Trusted by 1+ million students worldwide
1 out of 19
Related Documents


Your All-in-One AI-Powered Toolkit for Academic Success.
+13062052269
info@desklib.com
Available 24*7 on WhatsApp / Email
![[object Object]](/_next/static/media/star-bottom.7253800d.svg)
Unlock your academic potential
Copyright © 2020–2026 A2Z Services. All Rights Reserved. Developed and managed by ZUCOL.