Corporate Finance Report: Project Investment Decisions
VerifiedAdded on 2022/08/24
|14
|2949
|11
Report
AI Summary
This report provides a comprehensive analysis of corporate finance concepts, focusing on project evaluation and investment decisions. It examines the marginal cost of capital (MCC) and the weighted average cost of capital (WACC) to determine the best investment opportunities. The analysis includes a comparison of mutually exclusive projects, calculating Net Present Value (NPV) and Internal Rate of Return (IRR) to identify the most suitable projects. The report also discusses the cost of debt, equity, retained earnings, and preferred stock, and their impact on the WACC. Furthermore, it explores the concept of breakpoints in the MCC curve and how dividend policy can affect capital investment decisions, offering recommendations from an upper-level management perspective. The report concludes with a ranking of projects based on financial metrics and a discussion of funding strategies.

Running head: CORPORATE FINANCE
CORPORATE FINANCE
Name of the Student
Name of the University
Author Note:
CORPORATE FINANCE
Name of the Student
Name of the University
Author Note:
Paraphrase This Document
Need a fresh take? Get an instant paraphrase of this document with our AI Paraphraser
1
CORPORATE FINANCE
Table of Contents
Introduction......................................................................................................................................2
Discussion........................................................................................................................................2
Cost of Debt.....................................................................................................................................3
Cost of Equity..................................................................................................................................4
Cost of Retained Earning.................................................................................................................5
Cost of Preferred Stock....................................................................................................................6
Weighted Average Cost of Capital..................................................................................................6
Comparing Mutually Exclusive Project...........................................................................................7
Comparing Projects.........................................................................................................................9
Breaks in the MCC Curve:..............................................................................................................9
Conclusion.....................................................................................................................................11
Reference.......................................................................................................................................12
2
CORPORATE FINANCE
Introduction
In financial term, investment is regarded as an asset acquired with the goal of the
objective of generating income. In an economic sense, investment is purchasing goods with the
objective to create wealth in future by sacrificing its consumption or use in the present.
Nowadays, investment in the real state, stocks and bonds is where the funds are put to use since
they have a tendency of providing higher returns. Similarly, in this report, we consider which is
the best project to invest from among different projects. The purpose is to find which project will
yield better returns during a given period of time and with minimum investment (Chandra, 2017)
The paper has been structured in a way showing various cost that will be incurred at the time of
issuing various stocks and debts and how will it impact in the decision making process of an
individual. Analysis of the data has been made based on the marginal cost of capital by
calculating the net present value (NPV), the weighted average cost of capital (WACC) and
internal rate of return (IRR) to identify the suitable project that will yield a higher rate of return.
Discussion
Marginal Cost of Capital (MCC) is the combined total cost of debt, equity stock and
preference stock taking into account their respective weights of the total capital of the company.
An investor seeks it as the rate of return available from the securities of the company. The
marginal cost of capital is the cost that is incurred to raise additional capital from each of the
sources defined above (Bauer & Zanjani, 2016). It is the least rate of return that an investor
expects to gain for the capital provided to the company. The investment will be worth if the
expected return on capital will be greater than the cost of capital (Frank & Shen, 2016). The
weighted average cost of capital is the most ordinary measure used while calculating the cost of
capital, and which is primarily used in the business valuation and capital budgeting (Vartiainen
⊘ This is a preview!⊘
Do you want full access?
Subscribe today to unlock all pages.
Trusted by 1+ million students worldwide
3
CORPORATE FINANCE
et al., 2019). In the following scenario, an evaluation has been made on the two mutually
exclusive projects (Project A and Project B) to identify the most suitable and beneficial project to
invest on and thereafter comparing the beneficial project with Project B. Mutually exclusive
project are those project which cannot occur at the same time i.e. acceptance of one project will
automatically lead to rejection of the other one (Minken, 2016). The project deals with supplying
equipment. The benefits available, if the company uses the marginal cost of capital technique
(Negasa, 2016):
It changes the overall cost of capital if additional capital is raised.
It provides a base for deciding as to whether raising further funds for business expansion
or on a new project will be beneficial or not.
It also helps in deciding what type of fund is required to be raised and in which
proportion.
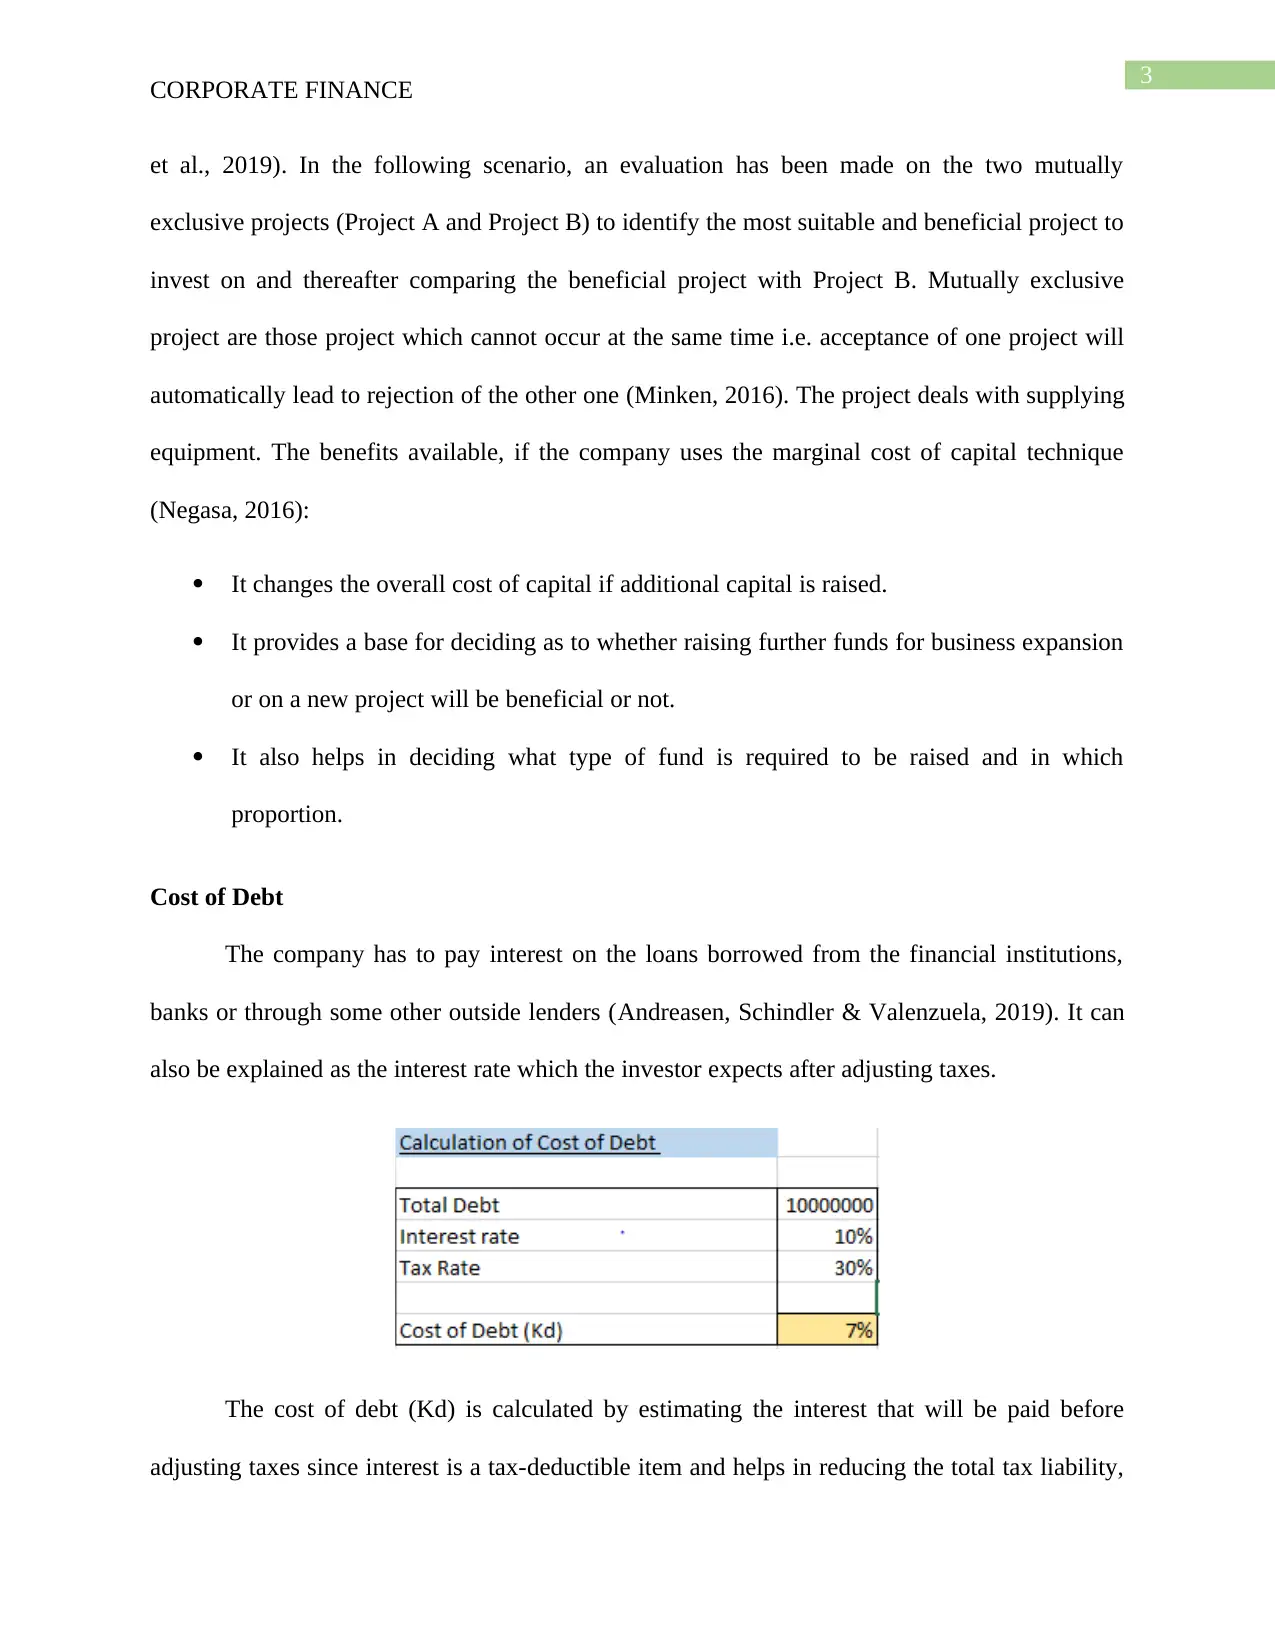
Cost of Debt
The company has to pay interest on the loans borrowed from the financial institutions,
banks or through some other outside lenders (Andreasen, Schindler & Valenzuela, 2019). It can
also be explained as the interest rate which the investor expects after adjusting taxes.
The cost of debt (Kd) is calculated by estimating the interest that will be paid before
adjusting taxes since interest is a tax-deductible item and helps in reducing the total tax liability,
CORPORATE FINANCE
et al., 2019). In the following scenario, an evaluation has been made on the two mutually
exclusive projects (Project A and Project B) to identify the most suitable and beneficial project to
invest on and thereafter comparing the beneficial project with Project B. Mutually exclusive
project are those project which cannot occur at the same time i.e. acceptance of one project will
automatically lead to rejection of the other one (Minken, 2016). The project deals with supplying
equipment. The benefits available, if the company uses the marginal cost of capital technique
(Negasa, 2016):
It changes the overall cost of capital if additional capital is raised.
It provides a base for deciding as to whether raising further funds for business expansion
or on a new project will be beneficial or not.
It also helps in deciding what type of fund is required to be raised and in which
proportion.
Cost of Debt
The company has to pay interest on the loans borrowed from the financial institutions,
banks or through some other outside lenders (Andreasen, Schindler & Valenzuela, 2019). It can
also be explained as the interest rate which the investor expects after adjusting taxes.
The cost of debt (Kd) is calculated by estimating the interest that will be paid before
adjusting taxes since interest is a tax-deductible item and helps in reducing the total tax liability,
Paraphrase This Document
Need a fresh take? Get an instant paraphrase of this document with our AI Paraphraser
4
CORPORATE FINANCE
it will also reduce the cost of issuing the debt instrument. The cost of debt is calculated by
multiplying the interest, that is required to be paid, by (1-Tax rate) and dividing the numerator
with the total amount of debt raised (Osma, Gomez-Conde & de las Heras, 2018). The cost of
capital is similar for both the mutually exclusive project. The cost of debt in both the mutually
exclusive project will be the same because of similar interest rates and tax rates even though the
amount of debt differs. The rates will be identical in the case of Project B because of similar
interest rates and tax rate.
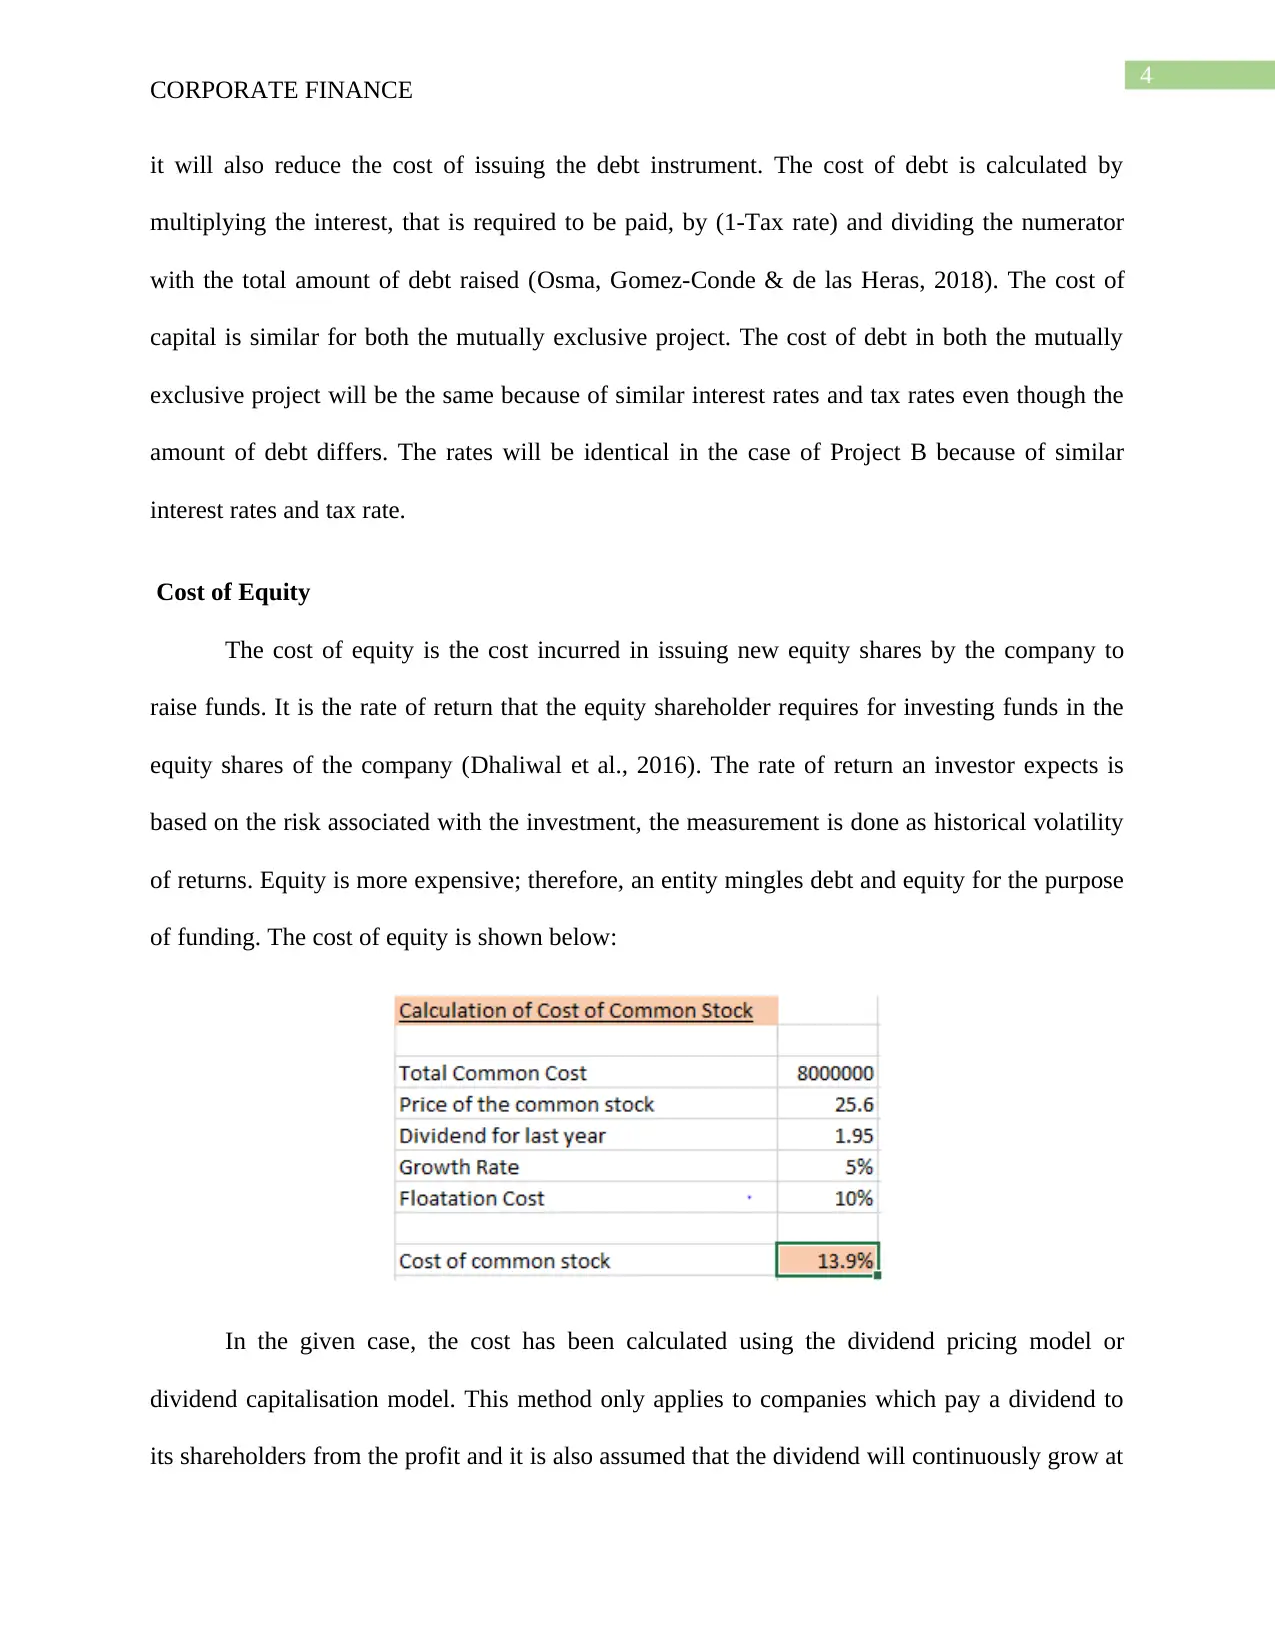
Cost of Equity
The cost of equity is the cost incurred in issuing new equity shares by the company to
raise funds. It is the rate of return that the equity shareholder requires for investing funds in the
equity shares of the company (Dhaliwal et al., 2016). The rate of return an investor expects is
based on the risk associated with the investment, the measurement is done as historical volatility
of returns. Equity is more expensive; therefore, an entity mingles debt and equity for the purpose
of funding. The cost of equity is shown below:
In the given case, the cost has been calculated using the dividend pricing model or
dividend capitalisation model. This method only applies to companies which pay a dividend to
its shareholders from the profit and it is also assumed that the dividend will continuously grow at
CORPORATE FINANCE
it will also reduce the cost of issuing the debt instrument. The cost of debt is calculated by
multiplying the interest, that is required to be paid, by (1-Tax rate) and dividing the numerator
with the total amount of debt raised (Osma, Gomez-Conde & de las Heras, 2018). The cost of
capital is similar for both the mutually exclusive project. The cost of debt in both the mutually
exclusive project will be the same because of similar interest rates and tax rates even though the
amount of debt differs. The rates will be identical in the case of Project B because of similar
interest rates and tax rate.
Cost of Equity
The cost of equity is the cost incurred in issuing new equity shares by the company to
raise funds. It is the rate of return that the equity shareholder requires for investing funds in the
equity shares of the company (Dhaliwal et al., 2016). The rate of return an investor expects is
based on the risk associated with the investment, the measurement is done as historical volatility
of returns. Equity is more expensive; therefore, an entity mingles debt and equity for the purpose
of funding. The cost of equity is shown below:
In the given case, the cost has been calculated using the dividend pricing model or
dividend capitalisation model. This method only applies to companies which pay a dividend to
its shareholders from the profit and it is also assumed that the dividend will continuously grow at
5
CORPORATE FINANCE
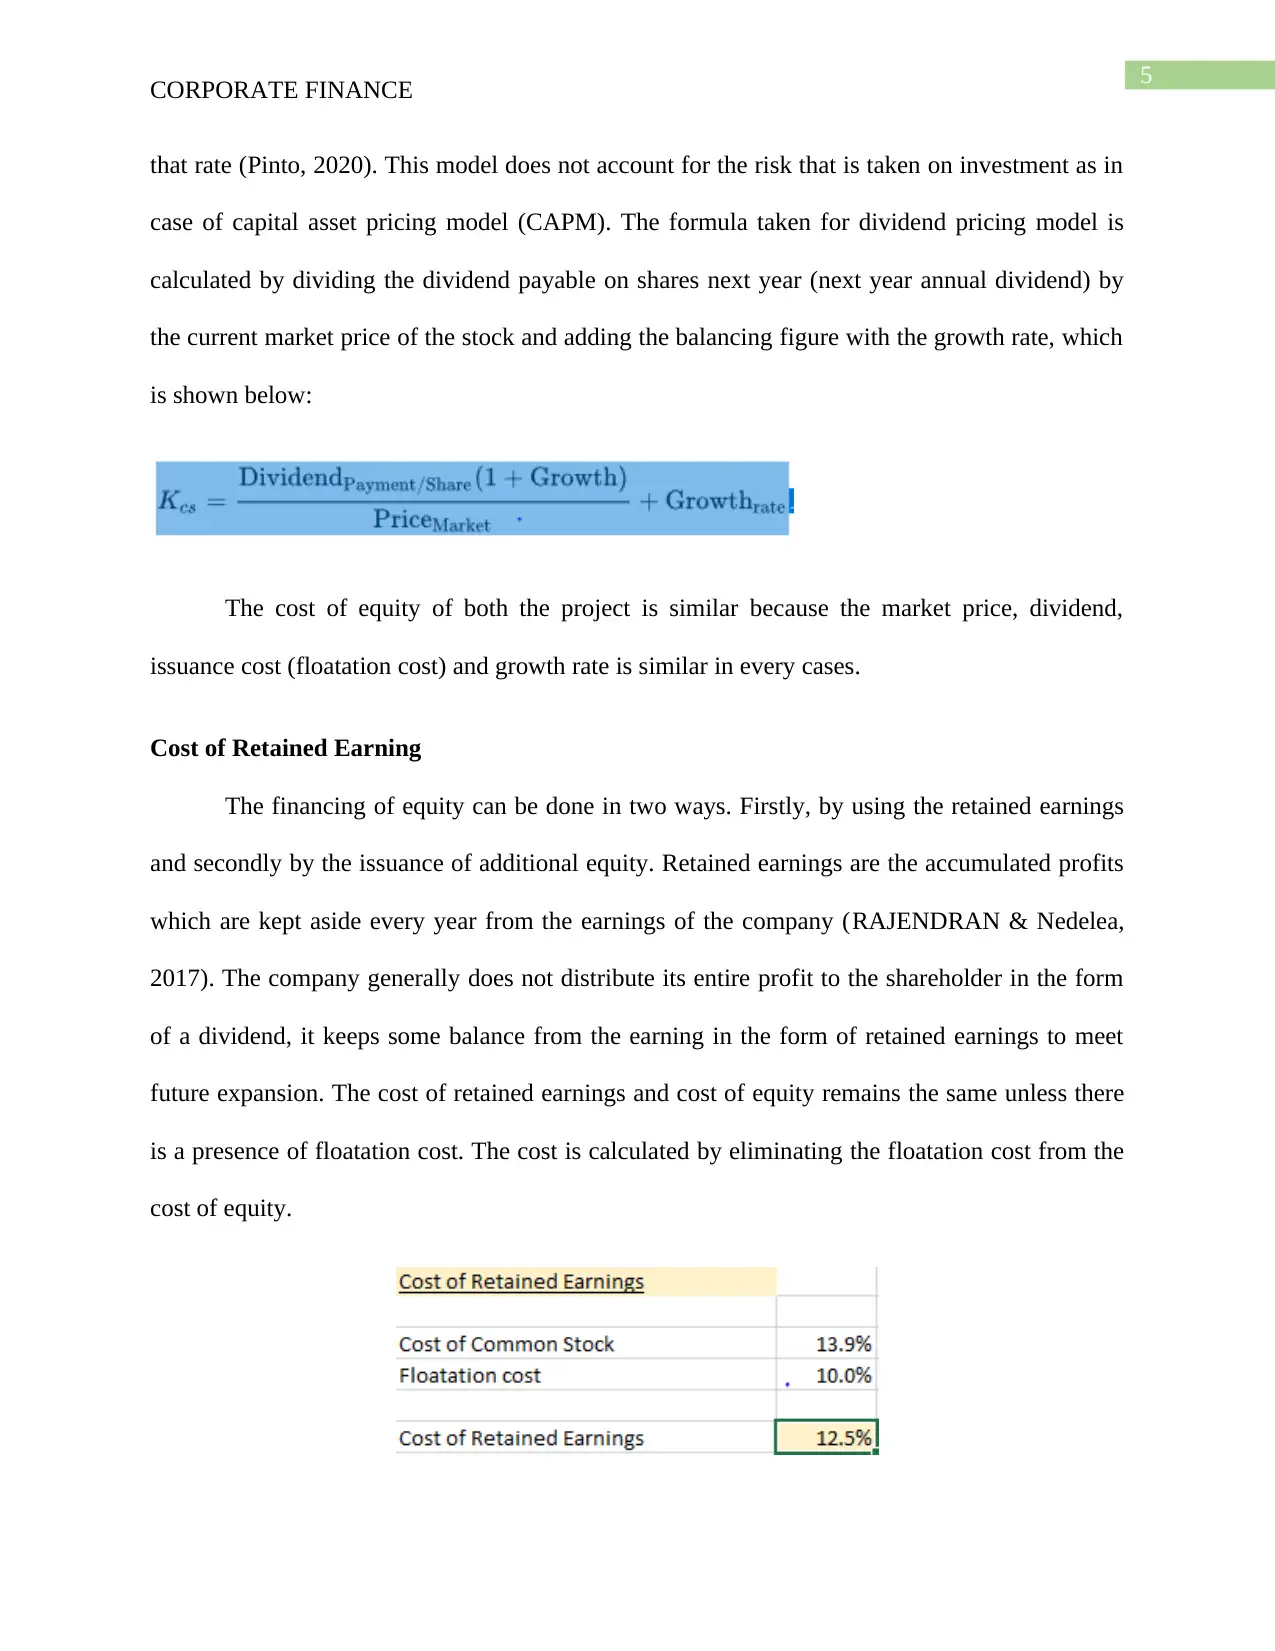
that rate (Pinto, 2020). This model does not account for the risk that is taken on investment as in
case of capital asset pricing model (CAPM). The formula taken for dividend pricing model is
calculated by dividing the dividend payable on shares next year (next year annual dividend) by
the current market price of the stock and adding the balancing figure with the growth rate, which
is shown below:
The cost of equity of both the project is similar because the market price, dividend,
issuance cost (floatation cost) and growth rate is similar in every cases.
Cost of Retained Earning
The financing of equity can be done in two ways. Firstly, by using the retained earnings
and secondly by the issuance of additional equity. Retained earnings are the accumulated profits
which are kept aside every year from the earnings of the company (RAJENDRAN & Nedelea,
2017). The company generally does not distribute its entire profit to the shareholder in the form
of a dividend, it keeps some balance from the earning in the form of retained earnings to meet
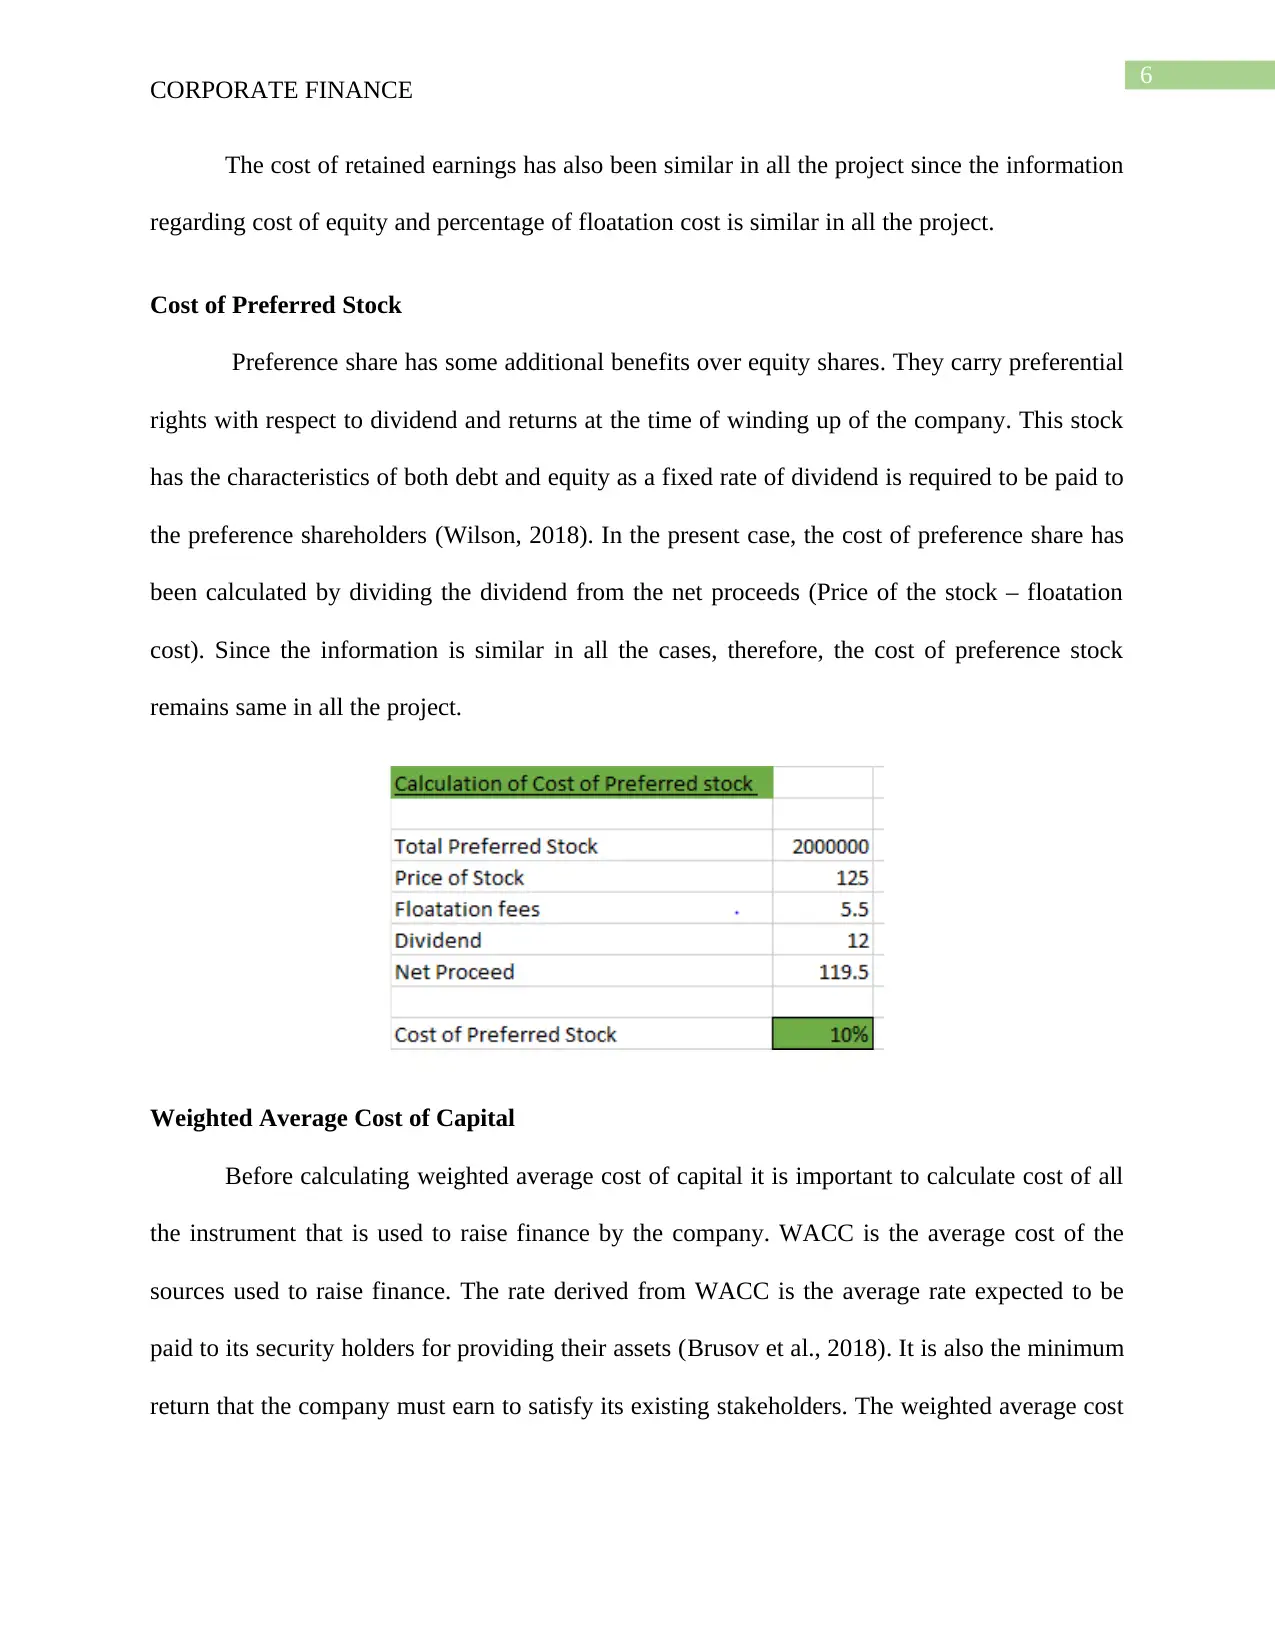
future expansion. The cost of retained earnings and cost of equity remains the same unless there
is a presence of floatation cost. The cost is calculated by eliminating the floatation cost from the
cost of equity.
CORPORATE FINANCE
that rate (Pinto, 2020). This model does not account for the risk that is taken on investment as in
case of capital asset pricing model (CAPM). The formula taken for dividend pricing model is
calculated by dividing the dividend payable on shares next year (next year annual dividend) by
the current market price of the stock and adding the balancing figure with the growth rate, which
is shown below:
The cost of equity of both the project is similar because the market price, dividend,
issuance cost (floatation cost) and growth rate is similar in every cases.
Cost of Retained Earning
The financing of equity can be done in two ways. Firstly, by using the retained earnings
and secondly by the issuance of additional equity. Retained earnings are the accumulated profits
which are kept aside every year from the earnings of the company (RAJENDRAN & Nedelea,
2017). The company generally does not distribute its entire profit to the shareholder in the form
of a dividend, it keeps some balance from the earning in the form of retained earnings to meet
future expansion. The cost of retained earnings and cost of equity remains the same unless there
is a presence of floatation cost. The cost is calculated by eliminating the floatation cost from the
cost of equity.
⊘ This is a preview!⊘
Do you want full access?
Subscribe today to unlock all pages.
Trusted by 1+ million students worldwide
6
CORPORATE FINANCE
The cost of retained earnings has also been similar in all the project since the information
regarding cost of equity and percentage of floatation cost is similar in all the project.
Cost of Preferred Stock
Preference share has some additional benefits over equity shares. They carry preferential
rights with respect to dividend and returns at the time of winding up of the company. This stock
has the characteristics of both debt and equity as a fixed rate of dividend is required to be paid to
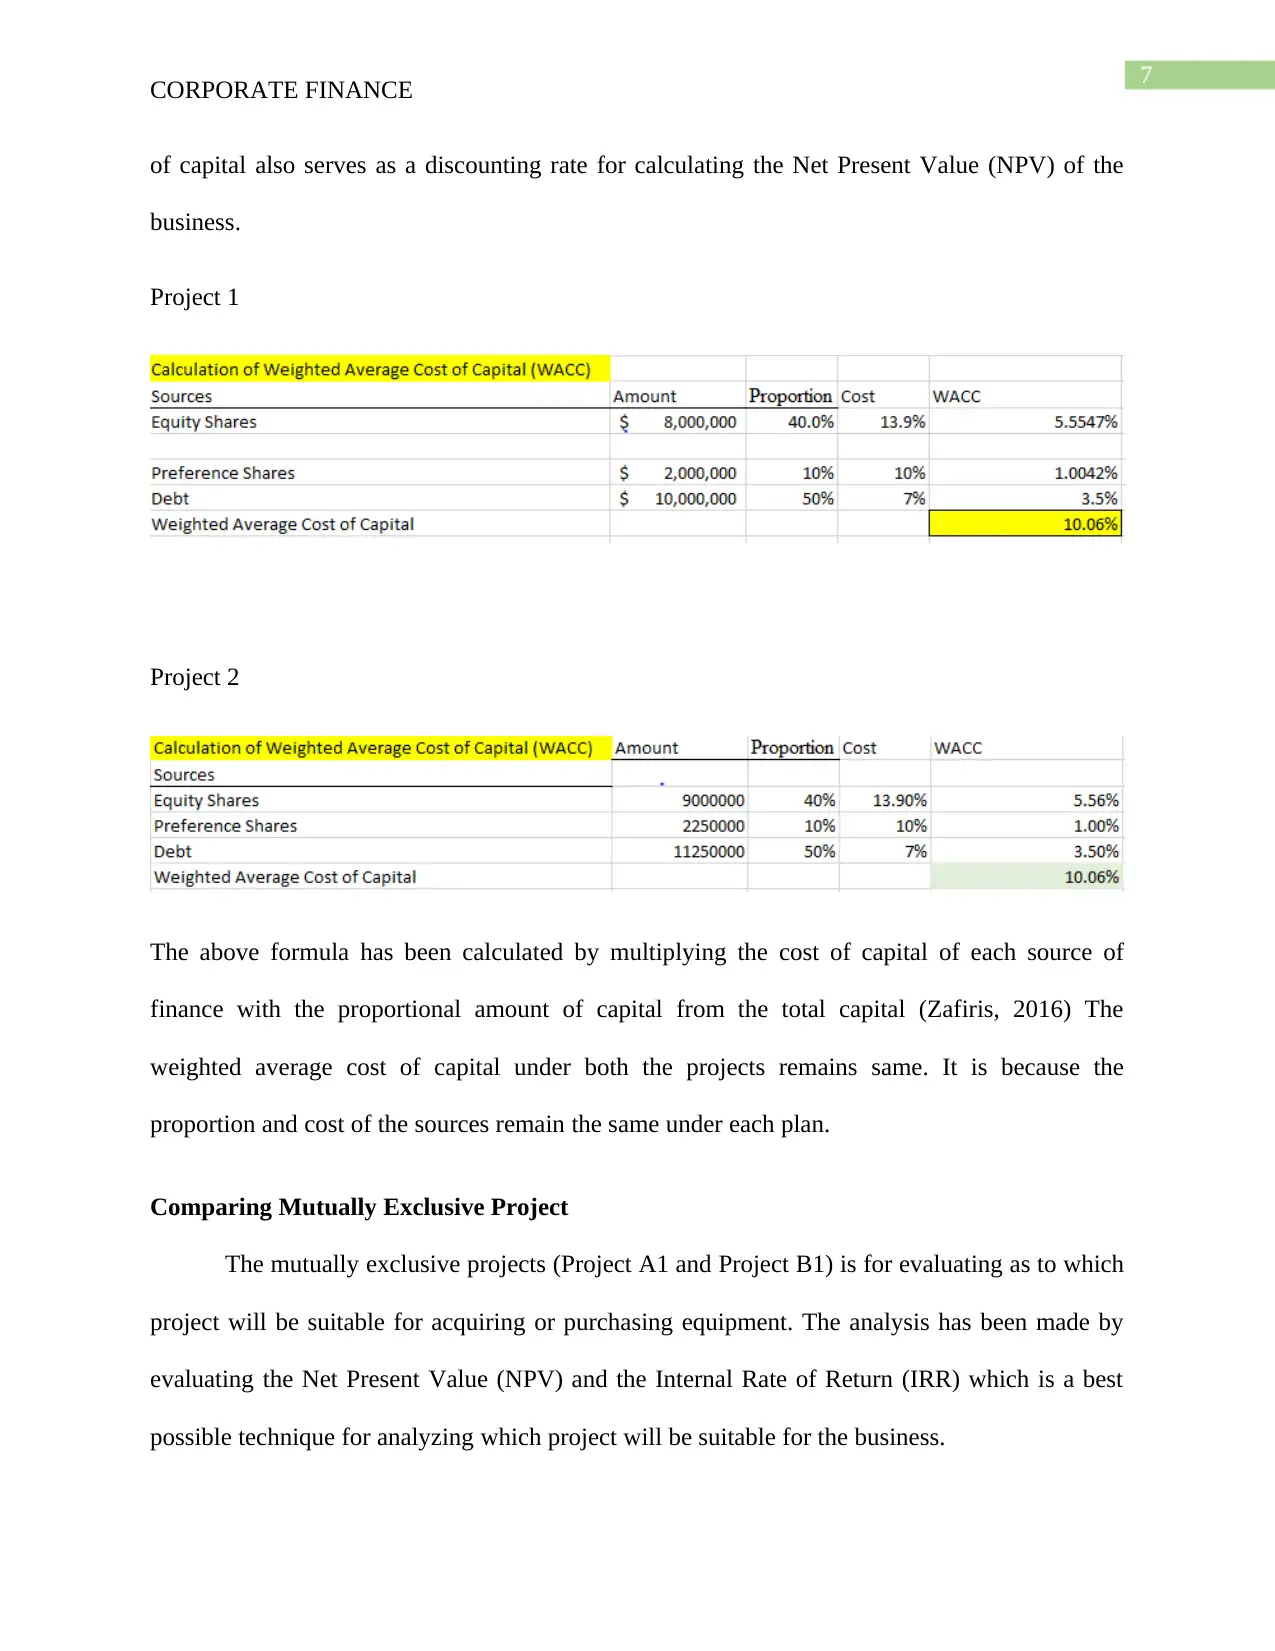
the preference shareholders (Wilson, 2018). In the present case, the cost of preference share has
been calculated by dividing the dividend from the net proceeds (Price of the stock – floatation
cost). Since the information is similar in all the cases, therefore, the cost of preference stock
remains same in all the project.
Weighted Average Cost of Capital
Before calculating weighted average cost of capital it is important to calculate cost of all
the instrument that is used to raise finance by the company. WACC is the average cost of the
sources used to raise finance. The rate derived from WACC is the average rate expected to be
paid to its security holders for providing their assets (Brusov et al., 2018). It is also the minimum
return that the company must earn to satisfy its existing stakeholders. The weighted average cost
CORPORATE FINANCE
The cost of retained earnings has also been similar in all the project since the information
regarding cost of equity and percentage of floatation cost is similar in all the project.
Cost of Preferred Stock
Preference share has some additional benefits over equity shares. They carry preferential
rights with respect to dividend and returns at the time of winding up of the company. This stock
has the characteristics of both debt and equity as a fixed rate of dividend is required to be paid to
the preference shareholders (Wilson, 2018). In the present case, the cost of preference share has
been calculated by dividing the dividend from the net proceeds (Price of the stock – floatation
cost). Since the information is similar in all the cases, therefore, the cost of preference stock
remains same in all the project.
Weighted Average Cost of Capital
Before calculating weighted average cost of capital it is important to calculate cost of all
the instrument that is used to raise finance by the company. WACC is the average cost of the
sources used to raise finance. The rate derived from WACC is the average rate expected to be
paid to its security holders for providing their assets (Brusov et al., 2018). It is also the minimum
return that the company must earn to satisfy its existing stakeholders. The weighted average cost
Paraphrase This Document
Need a fresh take? Get an instant paraphrase of this document with our AI Paraphraser
7
CORPORATE FINANCE
of capital also serves as a discounting rate for calculating the Net Present Value (NPV) of the
business.
Project 1
Project 2
The above formula has been calculated by multiplying the cost of capital of each source of
finance with the proportional amount of capital from the total capital (Zafiris, 2016) The
weighted average cost of capital under both the projects remains same. It is because the
proportion and cost of the sources remain the same under each plan.
Comparing Mutually Exclusive Project
The mutually exclusive projects (Project A1 and Project B1) is for evaluating as to which
project will be suitable for acquiring or purchasing equipment. The analysis has been made by
evaluating the Net Present Value (NPV) and the Internal Rate of Return (IRR) which is a best
possible technique for analyzing which project will be suitable for the business.
8
CORPORATE FINANCE
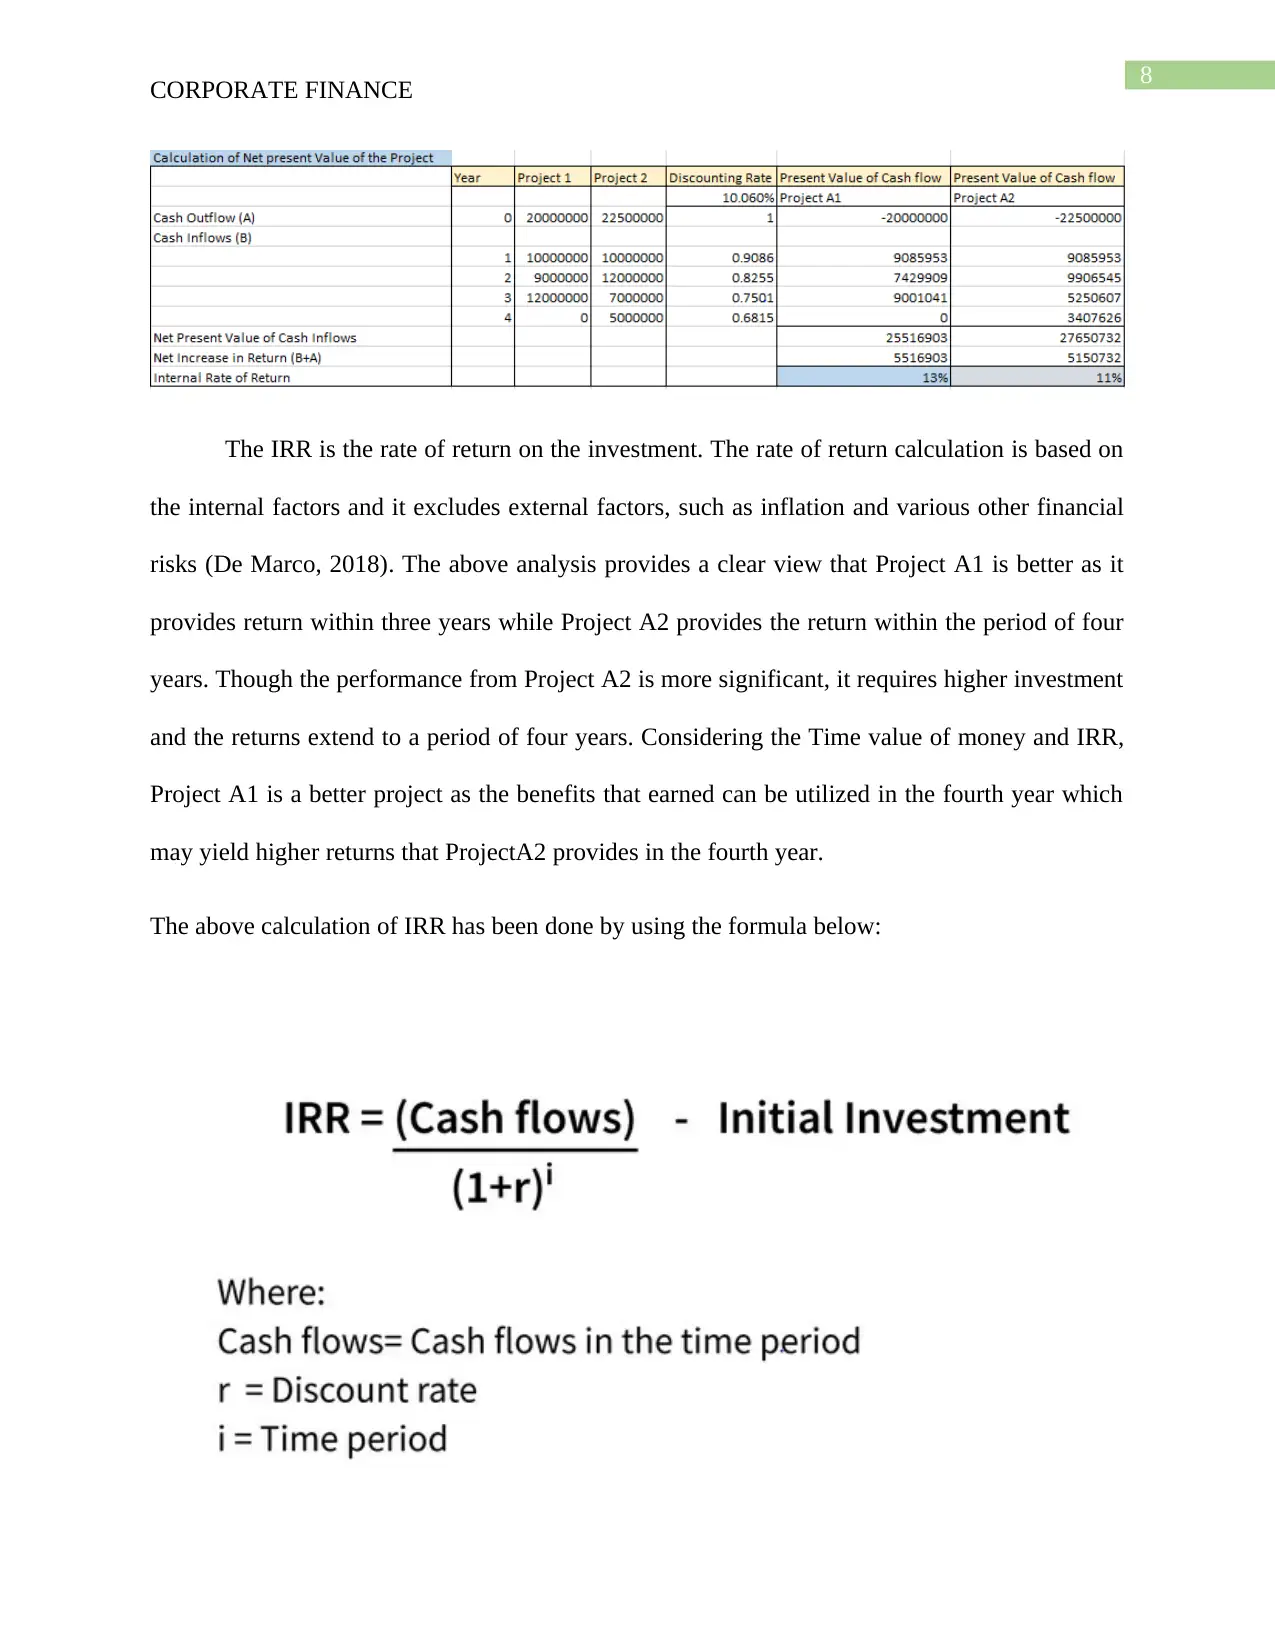
The IRR is the rate of return on the investment. The rate of return calculation is based on
the internal factors and it excludes external factors, such as inflation and various other financial
risks (De Marco, 2018). The above analysis provides a clear view that Project A1 is better as it
provides return within three years while Project A2 provides the return within the period of four
years. Though the performance from Project A2 is more significant, it requires higher investment
and the returns extend to a period of four years. Considering the Time value of money and IRR,
Project A1 is a better project as the benefits that earned can be utilized in the fourth year which
may yield higher returns that ProjectA2 provides in the fourth year.
The above calculation of IRR has been done by using the formula below:
CORPORATE FINANCE
The IRR is the rate of return on the investment. The rate of return calculation is based on
the internal factors and it excludes external factors, such as inflation and various other financial
risks (De Marco, 2018). The above analysis provides a clear view that Project A1 is better as it
provides return within three years while Project A2 provides the return within the period of four
years. Though the performance from Project A2 is more significant, it requires higher investment
and the returns extend to a period of four years. Considering the Time value of money and IRR,
Project A1 is a better project as the benefits that earned can be utilized in the fourth year which
may yield higher returns that ProjectA2 provides in the fourth year.
The above calculation of IRR has been done by using the formula below:
⊘ This is a preview!⊘
Do you want full access?
Subscribe today to unlock all pages.
Trusted by 1+ million students worldwide
9
CORPORATE FINANCE
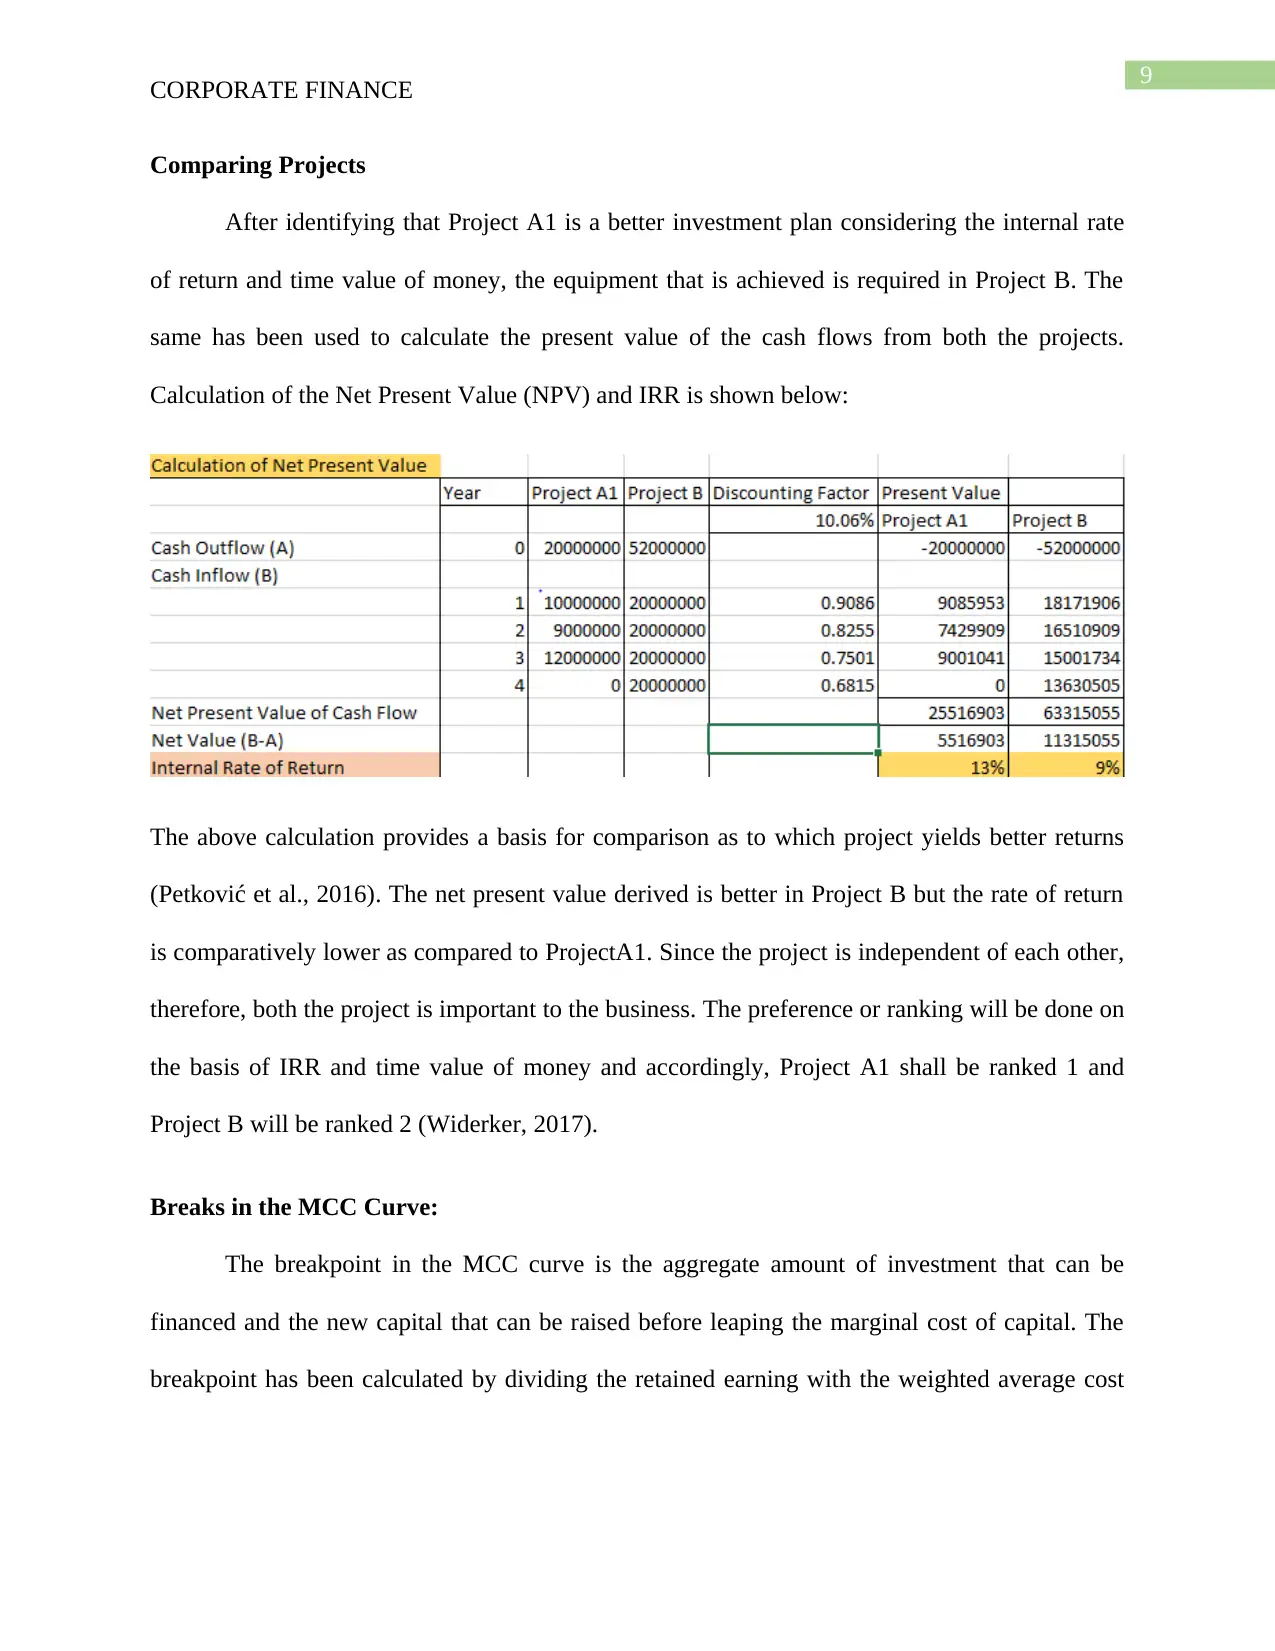
Comparing Projects
After identifying that Project A1 is a better investment plan considering the internal rate
of return and time value of money, the equipment that is achieved is required in Project B. The
same has been used to calculate the present value of the cash flows from both the projects.
Calculation of the Net Present Value (NPV) and IRR is shown below:
The above calculation provides a basis for comparison as to which project yields better returns
(Petković et al., 2016). The net present value derived is better in Project B but the rate of return
is comparatively lower as compared to ProjectA1. Since the project is independent of each other,
therefore, both the project is important to the business. The preference or ranking will be done on
the basis of IRR and time value of money and accordingly, Project A1 shall be ranked 1 and
Project B will be ranked 2 (Widerker, 2017).
Breaks in the MCC Curve:
The breakpoint in the MCC curve is the aggregate amount of investment that can be
financed and the new capital that can be raised before leaping the marginal cost of capital. The
breakpoint has been calculated by dividing the retained earning with the weighted average cost
CORPORATE FINANCE
Comparing Projects
After identifying that Project A1 is a better investment plan considering the internal rate
of return and time value of money, the equipment that is achieved is required in Project B. The
same has been used to calculate the present value of the cash flows from both the projects.
Calculation of the Net Present Value (NPV) and IRR is shown below:
The above calculation provides a basis for comparison as to which project yields better returns
(Petković et al., 2016). The net present value derived is better in Project B but the rate of return
is comparatively lower as compared to ProjectA1. Since the project is independent of each other,
therefore, both the project is important to the business. The preference or ranking will be done on
the basis of IRR and time value of money and accordingly, Project A1 shall be ranked 1 and
Project B will be ranked 2 (Widerker, 2017).
Breaks in the MCC Curve:
The breakpoint in the MCC curve is the aggregate amount of investment that can be
financed and the new capital that can be raised before leaping the marginal cost of capital. The
breakpoint has been calculated by dividing the retained earning with the weighted average cost
Paraphrase This Document
Need a fresh take? Get an instant paraphrase of this document with our AI Paraphraser
10
CORPORATE FINANCE
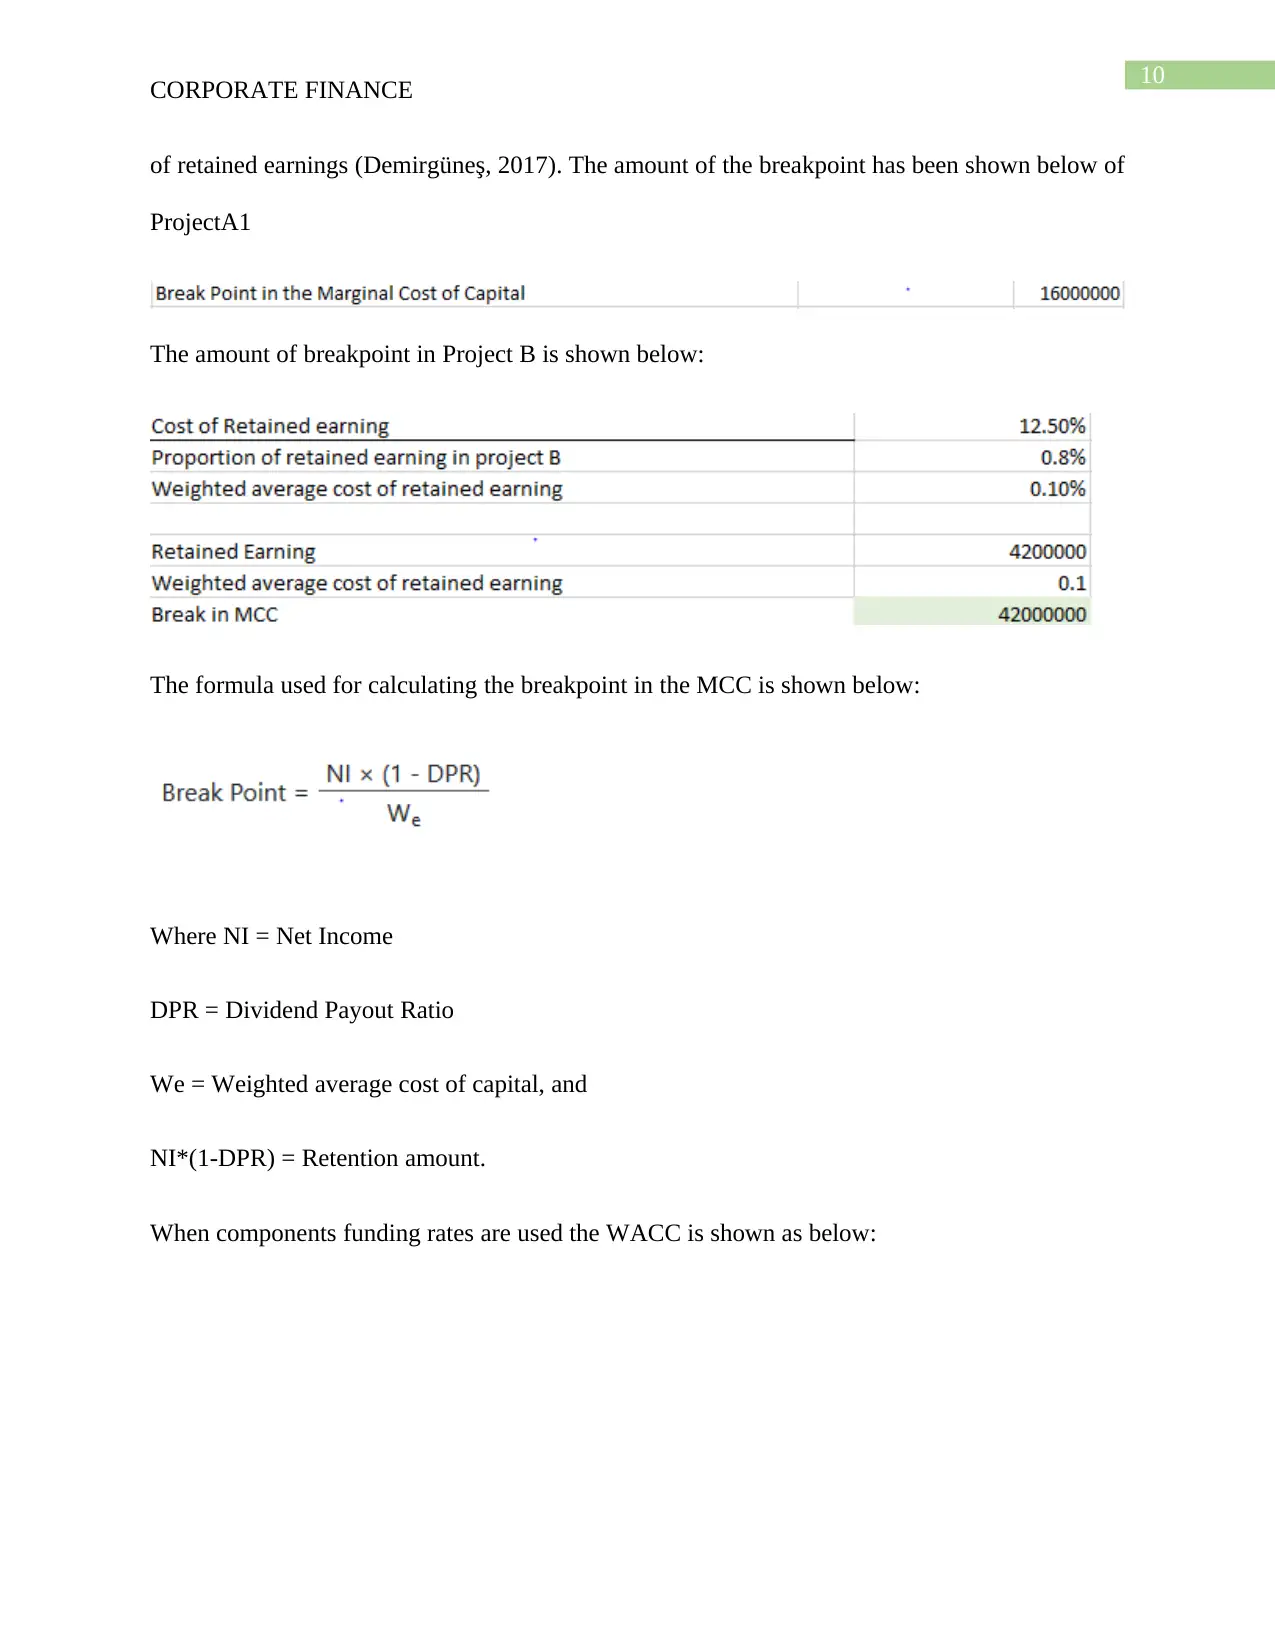
of retained earnings (Demirgüneş, 2017). The amount of the breakpoint has been shown below of
ProjectA1
The amount of breakpoint in Project B is shown below:
The formula used for calculating the breakpoint in the MCC is shown below:
Where NI = Net Income
DPR = Dividend Payout Ratio
We = Weighted average cost of capital, and
NI*(1-DPR) = Retention amount.
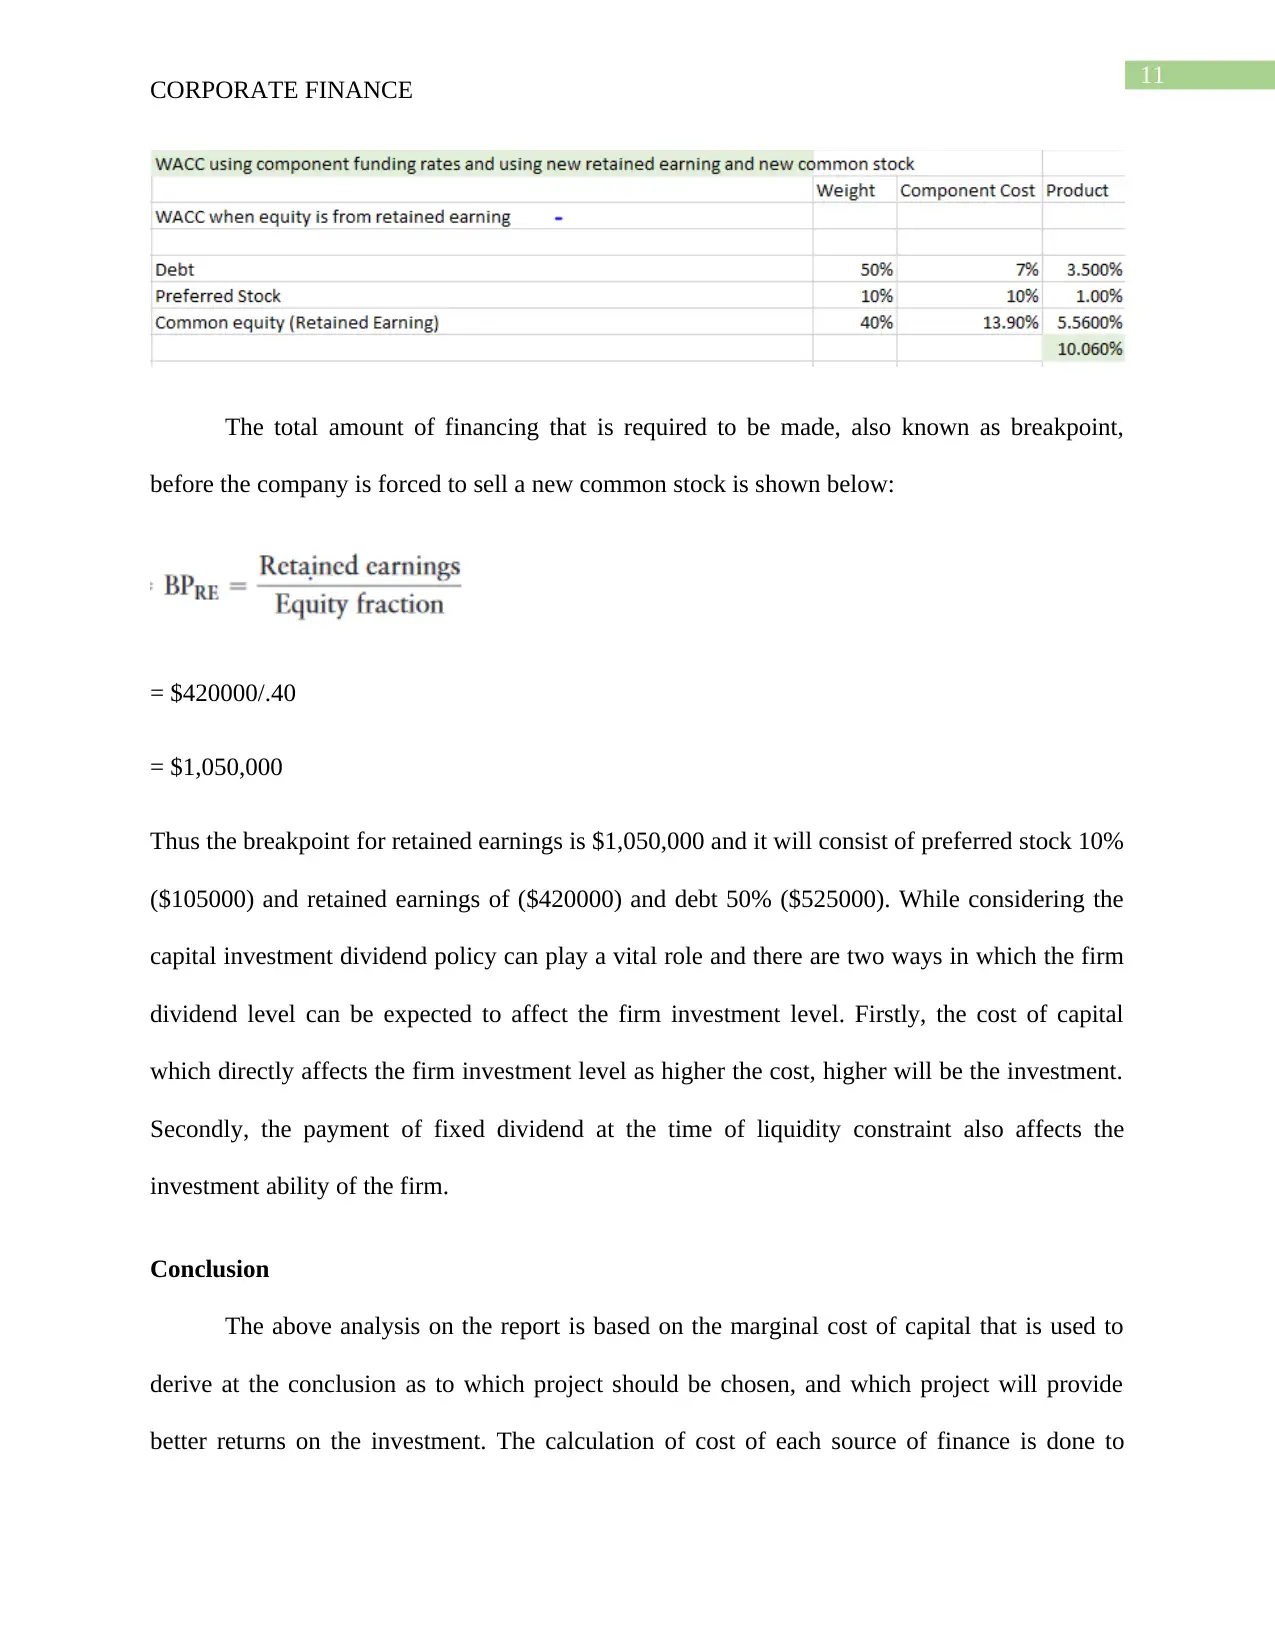
When components funding rates are used the WACC is shown as below:
CORPORATE FINANCE
of retained earnings (Demirgüneş, 2017). The amount of the breakpoint has been shown below of
ProjectA1
The amount of breakpoint in Project B is shown below:
The formula used for calculating the breakpoint in the MCC is shown below:
Where NI = Net Income
DPR = Dividend Payout Ratio
We = Weighted average cost of capital, and
NI*(1-DPR) = Retention amount.
When components funding rates are used the WACC is shown as below:
11
CORPORATE FINANCE
The total amount of financing that is required to be made, also known as breakpoint,
before the company is forced to sell a new common stock is shown below:
= $420000/.40
= $1,050,000
Thus the breakpoint for retained earnings is $1,050,000 and it will consist of preferred stock 10%
($105000) and retained earnings of ($420000) and debt 50% ($525000). While considering the
capital investment dividend policy can play a vital role and there are two ways in which the firm
dividend level can be expected to affect the firm investment level. Firstly, the cost of capital
which directly affects the firm investment level as higher the cost, higher will be the investment.
Secondly, the payment of fixed dividend at the time of liquidity constraint also affects the
investment ability of the firm.
Conclusion
The above analysis on the report is based on the marginal cost of capital that is used to
derive at the conclusion as to which project should be chosen, and which project will provide
better returns on the investment. The calculation of cost of each source of finance is done to
⊘ This is a preview!⊘
Do you want full access?
Subscribe today to unlock all pages.
Trusted by 1+ million students worldwide
1 out of 14
Related Documents


Your All-in-One AI-Powered Toolkit for Academic Success.
+13062052269
info@desklib.com
Available 24*7 on WhatsApp / Email
![[object Object]](/_next/static/media/star-bottom.7253800d.svg)
Unlock your academic potential
Copyright © 2020–2026 A2Z Services. All Rights Reserved. Developed and managed by ZUCOL.