Corporate Finance Report: Capital Structure Analysis and WACC
VerifiedAdded on 2020/01/07
|16
|4795
|198
Report
AI Summary
This report delves into corporate finance, specifically examining capital structure and its impact on a firm's cost of capital. It explores various capital structure theories and their practical application, highlighting the importance of a balanced approach between debt and equity. The report analyzes the debt-equity ratios of AO world plc and G4S plc, comparing their capital structure strategies and the implications for their financial stakeholders. It assesses the financial distress risks faced by these companies through ratio analysis, including gross profit, net profit, current ratio, and return on shareholder equity. Furthermore, the report estimates the weighted average cost of capital (WACC) for both companies, providing insights into their average financing costs. The analysis considers the role of beta in measuring risk and emphasizes the importance of evaluating the business environment. The report concludes with recommendations based on the financial analysis, emphasizing the need for firms to compute WACC to assess their average finance cost.
CORPORATE FINANCE
Paraphrase This Document
Need a fresh take? Get an instant paraphrase of this document with our AI Paraphraser
EXECUTIVE SUMMARY
This report is prepared on corporate finance and it is find out that capital structure play a
very important role in helping firm in controlling its cost of capital. There are many theories
related to capital structure and same are applied on the firms. It is find out on study that
complete dependency on debt and equity create problems for the firm. Hence, there must be
balanced capital structure of the firm. Beta helps in measuring risk and it is find out that
investors must also analyze business environment in which firm is operating in order to access
risk in better way. At end of study, it is identified that WACC must be computed by the firms to
access average finance cost of the firm.
TABLE OF CONTENTS
EXECUTIVE SUMMARY.............................................................................................................1
INTRODUCTION...........................................................................................................................3
(1) Comparing and contrasting capitals structure of the firms....................................................3
AO world plc...............................................................................................................................3
(2) Evidence that financial stakeholders in company A and B are concerned about the firm
may face financial distress in future ...........................................................................................5
(3) Equity and company risk of company A and B.....................................................................7
(4) Estimating weighted average cost of capital for company A and B .....................................8
RECOMENDATION AND CONCLUSION..................................................................................9
APPENDIX....................................................................................................................................10
INDEX OF TABLES
Table 1: Ratio analysis of AO world.............................................................................................13
Table 2: Ratio analysis of G4S......................................................................................................13
Table 3: Cost of equity for AO world ltd.......................................................................................14
Table 4: Enterprise value of AO world..........................................................................................14
Table 5: WACC of AO world........................................................................................................14
Table 6: Cost of equity for G4S.....................................................................................................14
Table 7: Enterprise value of G4S...................................................................................................14
Table 8: WACC of G4S.................................................................................................................15
⊘ This is a preview!⊘
Do you want full access?
Subscribe today to unlock all pages.
Trusted by 1+ million students worldwide
INTRODUCTION
Corporate finance is one of the important branch of financial management. In this report
detail discussion is carried out on capital structure of the firms. Theories of capital structure that
applies on these firms are identified and discussed in detail in this report. The reasons due to
which changes comes in the firm capital structure are also identified. In the middle part of the
report, ratio analysis is done and ratio of both firms are interpreted for last five years and
comments are done on same. Risk related to investment is measured by using values of beta and
analysis of business environment. On this basis risk related to investment in the firm is accessed.
In end part of the report, weighted average cost of capital for the firm by using specific steps and
used formula are mentioned clearly.
(1) Comparing and contrasting capitals structure of the firms
Capital structure refers to the combination of debt and equity in the firm. In the capital
structure of the firm there is specific proportion of debt and equity. Capital structure of the
company is computed by dividing debt by equity. From this, the proportion of debt to equity is
computed for the firms. Debt equity ratio of the given firms is discussed below.
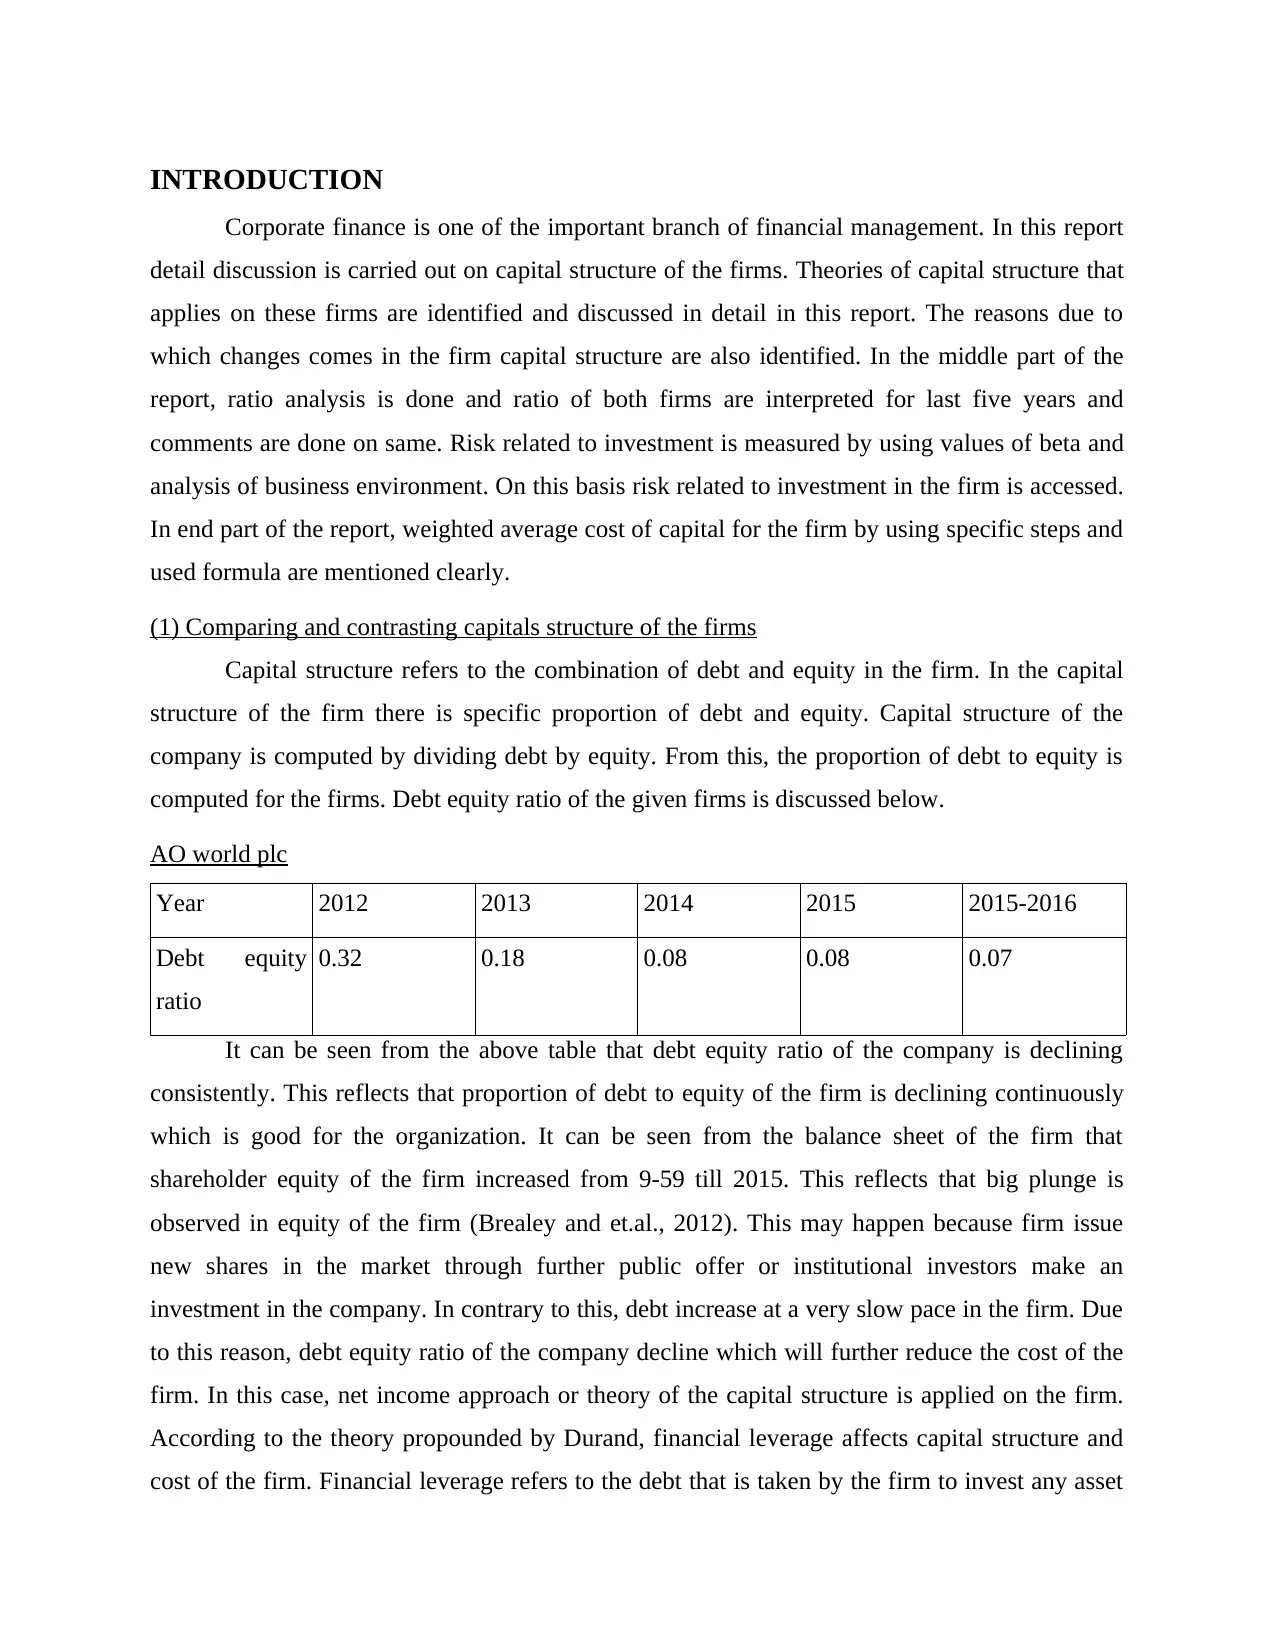
AO world plc
Year 2012 2013 2014 2015 2015-2016
Debt equity
ratio
0.32 0.18 0.08 0.08 0.07
It can be seen from the above table that debt equity ratio of the company is declining
consistently. This reflects that proportion of debt to equity of the firm is declining continuously
which is good for the organization. It can be seen from the balance sheet of the firm that
shareholder equity of the firm increased from 9-59 till 2015. This reflects that big plunge is
observed in equity of the firm (Brealey and et.al., 2012). This may happen because firm issue
new shares in the market through further public offer or institutional investors make an
investment in the company. In contrary to this, debt increase at a very slow pace in the firm. Due
to this reason, debt equity ratio of the company decline which will further reduce the cost of the
firm. In this case, net income approach or theory of the capital structure is applied on the firm.
According to the theory propounded by Durand, financial leverage affects capital structure and
cost of the firm. Financial leverage refers to the debt that is taken by the firm to invest any asset
Corporate finance is one of the important branch of financial management. In this report
detail discussion is carried out on capital structure of the firms. Theories of capital structure that
applies on these firms are identified and discussed in detail in this report. The reasons due to
which changes comes in the firm capital structure are also identified. In the middle part of the
report, ratio analysis is done and ratio of both firms are interpreted for last five years and
comments are done on same. Risk related to investment is measured by using values of beta and
analysis of business environment. On this basis risk related to investment in the firm is accessed.
In end part of the report, weighted average cost of capital for the firm by using specific steps and
used formula are mentioned clearly.
(1) Comparing and contrasting capitals structure of the firms
Capital structure refers to the combination of debt and equity in the firm. In the capital
structure of the firm there is specific proportion of debt and equity. Capital structure of the
company is computed by dividing debt by equity. From this, the proportion of debt to equity is
computed for the firms. Debt equity ratio of the given firms is discussed below.
AO world plc
Year 2012 2013 2014 2015 2015-2016
Debt equity
ratio
0.32 0.18 0.08 0.08 0.07
It can be seen from the above table that debt equity ratio of the company is declining
consistently. This reflects that proportion of debt to equity of the firm is declining continuously
which is good for the organization. It can be seen from the balance sheet of the firm that
shareholder equity of the firm increased from 9-59 till 2015. This reflects that big plunge is
observed in equity of the firm (Brealey and et.al., 2012). This may happen because firm issue
new shares in the market through further public offer or institutional investors make an
investment in the company. In contrary to this, debt increase at a very slow pace in the firm. Due
to this reason, debt equity ratio of the company decline which will further reduce the cost of the
firm. In this case, net income approach or theory of the capital structure is applied on the firm.
According to the theory propounded by Durand, financial leverage affects capital structure and
cost of the firm. Financial leverage refers to the debt that is taken by the firm to invest any asset
Paraphrase This Document
Need a fresh take? Get an instant paraphrase of this document with our AI Paraphraser
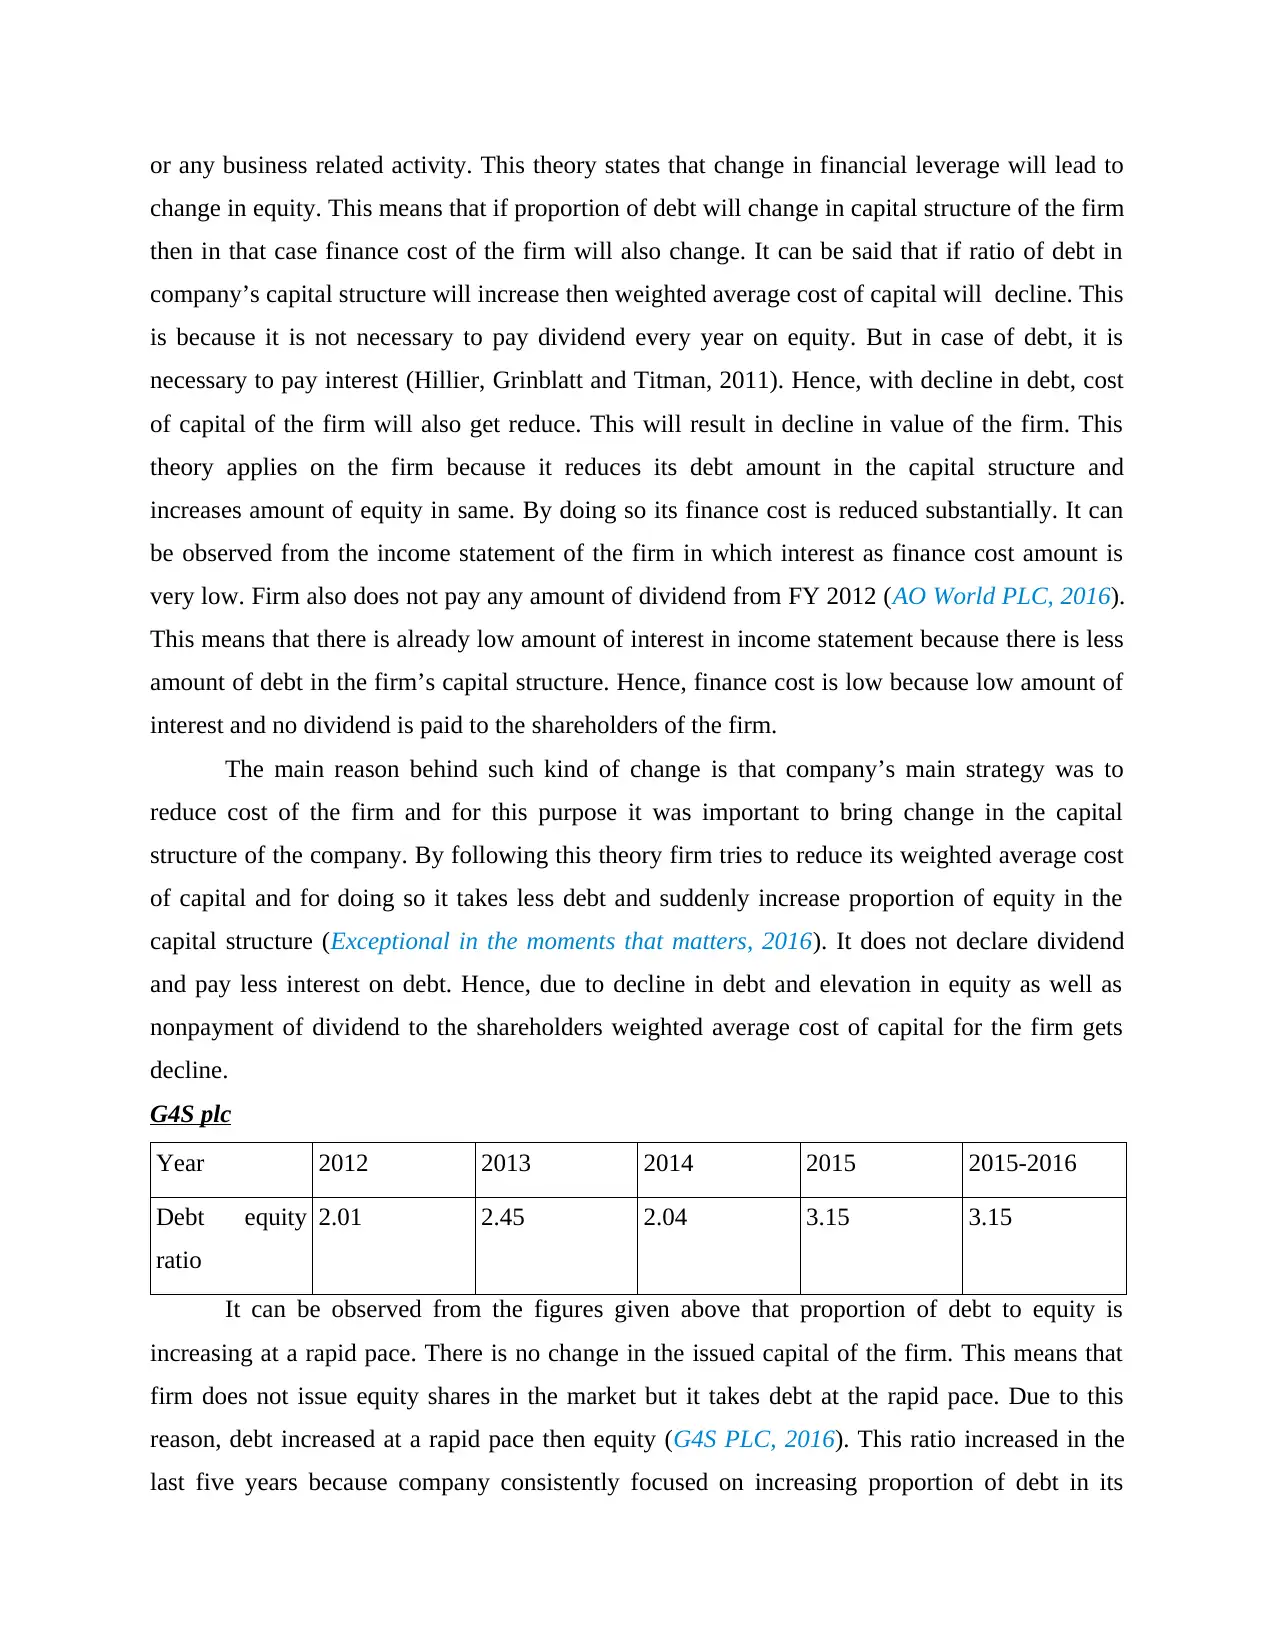
or any business related activity. This theory states that change in financial leverage will lead to
change in equity. This means that if proportion of debt will change in capital structure of the firm
then in that case finance cost of the firm will also change. It can be said that if ratio of debt in
company’s capital structure will increase then weighted average cost of capital will decline. This
is because it is not necessary to pay dividend every year on equity. But in case of debt, it is
necessary to pay interest (Hillier, Grinblatt and Titman, 2011). Hence, with decline in debt, cost
of capital of the firm will also get reduce. This will result in decline in value of the firm. This
theory applies on the firm because it reduces its debt amount in the capital structure and
increases amount of equity in same. By doing so its finance cost is reduced substantially. It can
be observed from the income statement of the firm in which interest as finance cost amount is
very low. Firm also does not pay any amount of dividend from FY 2012 (AO World PLC, 2016).
This means that there is already low amount of interest in income statement because there is less
amount of debt in the firm’s capital structure. Hence, finance cost is low because low amount of
interest and no dividend is paid to the shareholders of the firm.
The main reason behind such kind of change is that company’s main strategy was to
reduce cost of the firm and for this purpose it was important to bring change in the capital
structure of the company. By following this theory firm tries to reduce its weighted average cost
of capital and for doing so it takes less debt and suddenly increase proportion of equity in the
capital structure (Exceptional in the moments that matters, 2016). It does not declare dividend
and pay less interest on debt. Hence, due to decline in debt and elevation in equity as well as
nonpayment of dividend to the shareholders weighted average cost of capital for the firm gets
decline.
G4S plc
Year 2012 2013 2014 2015 2015-2016
Debt equity
ratio
2.01 2.45 2.04 3.15 3.15
It can be observed from the figures given above that proportion of debt to equity is
increasing at a rapid pace. There is no change in the issued capital of the firm. This means that
firm does not issue equity shares in the market but it takes debt at the rapid pace. Due to this
reason, debt increased at a rapid pace then equity (G4S PLC, 2016). This ratio increased in the
last five years because company consistently focused on increasing proportion of debt in its
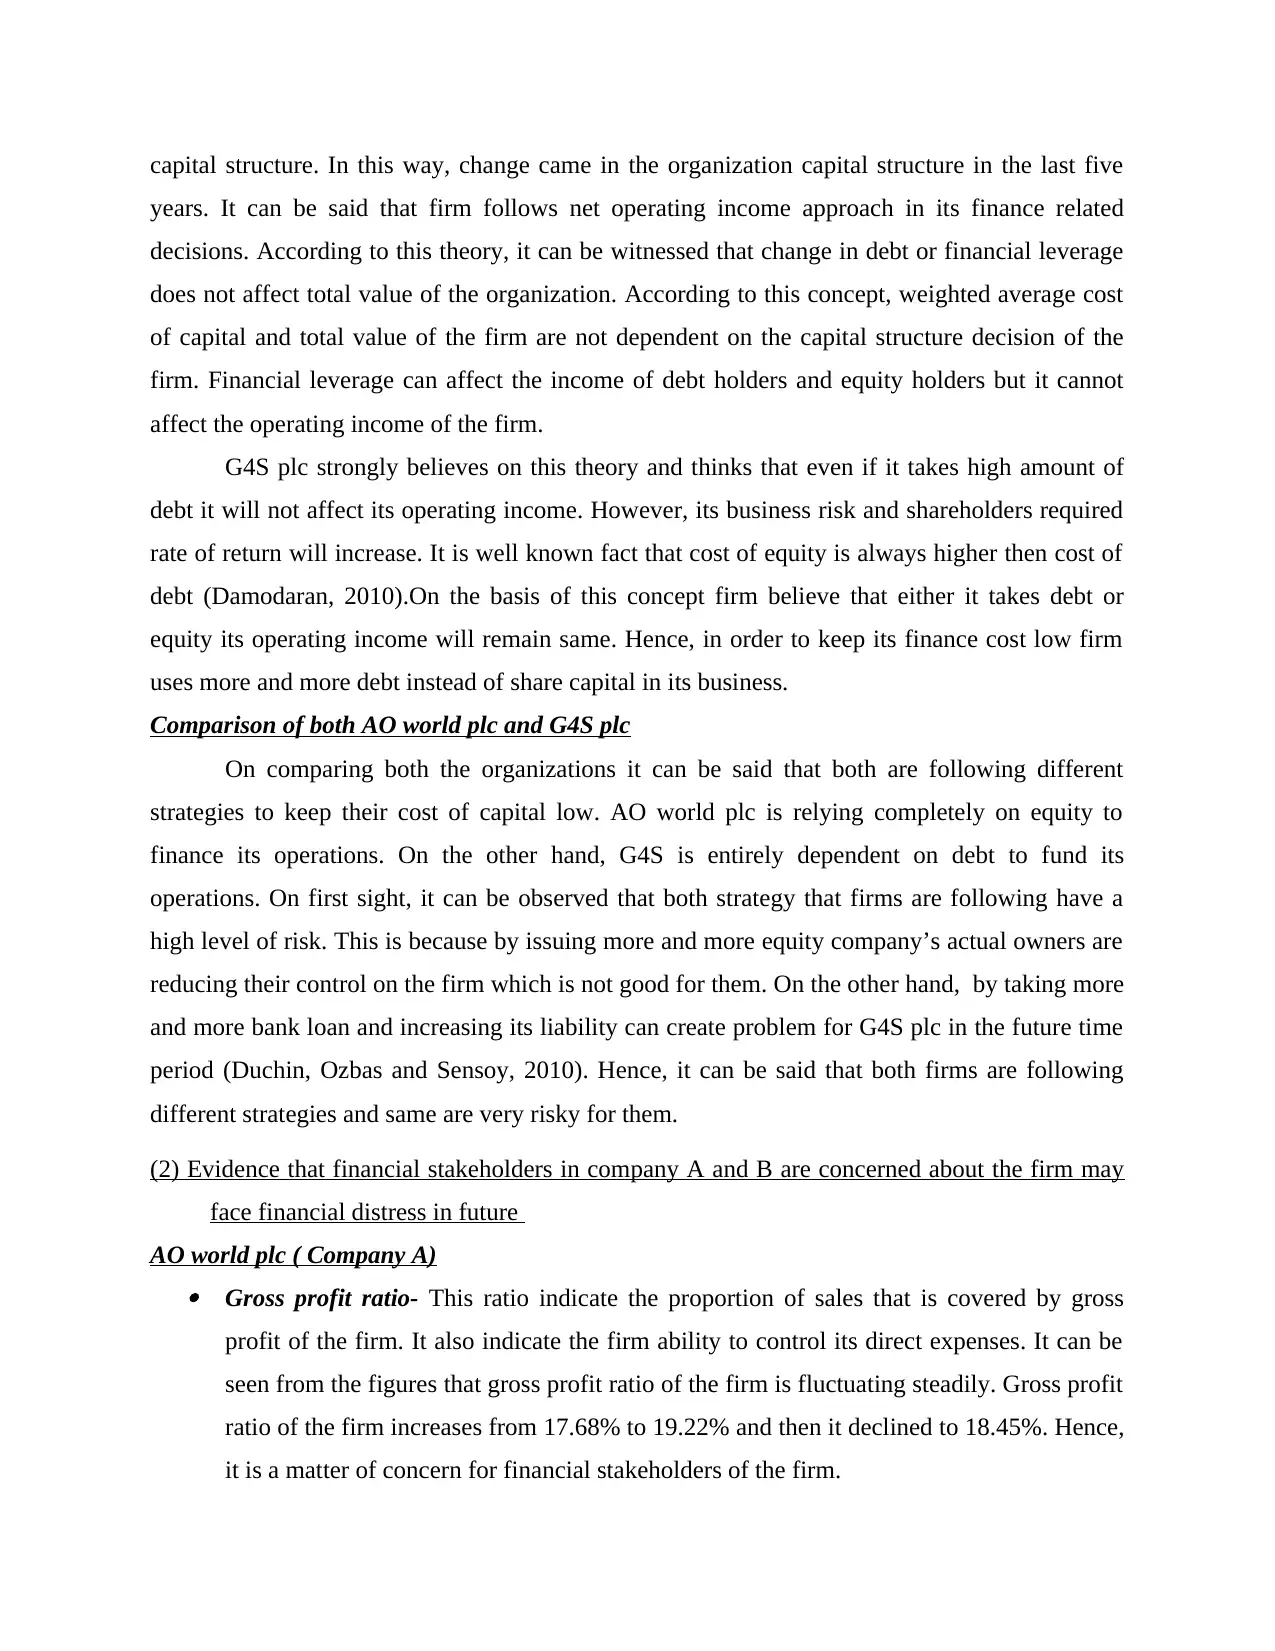
capital structure. In this way, change came in the organization capital structure in the last five
years. It can be said that firm follows net operating income approach in its finance related
decisions. According to this theory, it can be witnessed that change in debt or financial leverage
does not affect total value of the organization. According to this concept, weighted average cost
of capital and total value of the firm are not dependent on the capital structure decision of the
firm. Financial leverage can affect the income of debt holders and equity holders but it cannot
affect the operating income of the firm.
G4S plc strongly believes on this theory and thinks that even if it takes high amount of
debt it will not affect its operating income. However, its business risk and shareholders required
rate of return will increase. It is well known fact that cost of equity is always higher then cost of
debt (Damodaran, 2010).On the basis of this concept firm believe that either it takes debt or
equity its operating income will remain same. Hence, in order to keep its finance cost low firm
uses more and more debt instead of share capital in its business.
Comparison of both AO world plc and G4S plc
On comparing both the organizations it can be said that both are following different
strategies to keep their cost of capital low. AO world plc is relying completely on equity to
finance its operations. On the other hand, G4S is entirely dependent on debt to fund its
operations. On first sight, it can be observed that both strategy that firms are following have a
high level of risk. This is because by issuing more and more equity company’s actual owners are
reducing their control on the firm which is not good for them. On the other hand, by taking more
and more bank loan and increasing its liability can create problem for G4S plc in the future time
period (Duchin, Ozbas and Sensoy, 2010). Hence, it can be said that both firms are following
different strategies and same are very risky for them.
(2) Evidence that financial stakeholders in company A and B are concerned about the firm may
face financial distress in future
AO world plc ( Company A) Gross profit ratio- This ratio indicate the proportion of sales that is covered by gross
profit of the firm. It also indicate the firm ability to control its direct expenses. It can be
seen from the figures that gross profit ratio of the firm is fluctuating steadily. Gross profit
ratio of the firm increases from 17.68% to 19.22% and then it declined to 18.45%. Hence,
it is a matter of concern for financial stakeholders of the firm.
⊘ This is a preview!⊘
Do you want full access?
Subscribe today to unlock all pages.
Trusted by 1+ million students worldwide
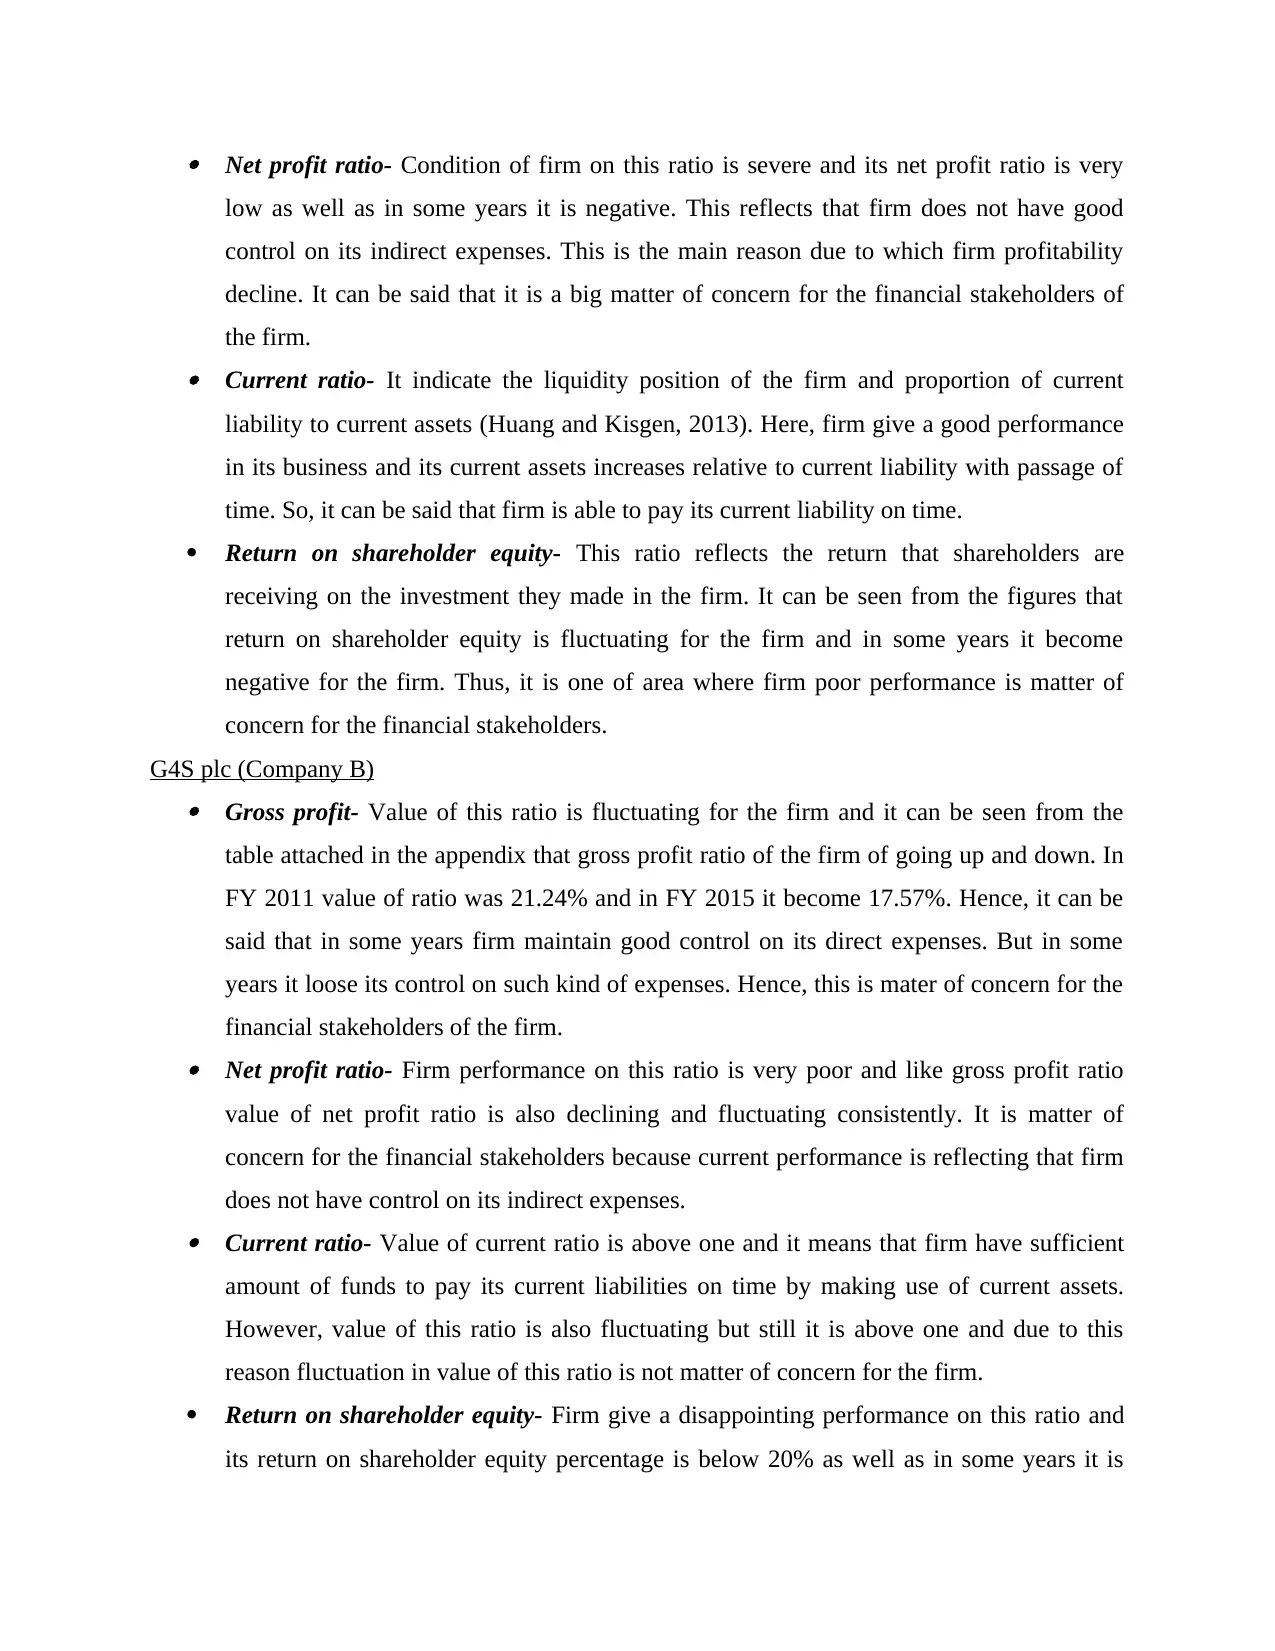
Net profit ratio- Condition of firm on this ratio is severe and its net profit ratio is very
low as well as in some years it is negative. This reflects that firm does not have good
control on its indirect expenses. This is the main reason due to which firm profitability
decline. It can be said that it is a big matter of concern for the financial stakeholders of
the firm. Current ratio- It indicate the liquidity position of the firm and proportion of current
liability to current assets (Huang and Kisgen, 2013). Here, firm give a good performance
in its business and its current assets increases relative to current liability with passage of
time. So, it can be said that firm is able to pay its current liability on time.
Return on shareholder equity- This ratio reflects the return that shareholders are
receiving on the investment they made in the firm. It can be seen from the figures that
return on shareholder equity is fluctuating for the firm and in some years it become
negative for the firm. Thus, it is one of area where firm poor performance is matter of
concern for the financial stakeholders.
G4S plc (Company B) Gross profit- Value of this ratio is fluctuating for the firm and it can be seen from the
table attached in the appendix that gross profit ratio of the firm of going up and down. In
FY 2011 value of ratio was 21.24% and in FY 2015 it become 17.57%. Hence, it can be
said that in some years firm maintain good control on its direct expenses. But in some
years it loose its control on such kind of expenses. Hence, this is mater of concern for the
financial stakeholders of the firm. Net profit ratio- Firm performance on this ratio is very poor and like gross profit ratio
value of net profit ratio is also declining and fluctuating consistently. It is matter of
concern for the financial stakeholders because current performance is reflecting that firm
does not have control on its indirect expenses. Current ratio- Value of current ratio is above one and it means that firm have sufficient
amount of funds to pay its current liabilities on time by making use of current assets.
However, value of this ratio is also fluctuating but still it is above one and due to this
reason fluctuation in value of this ratio is not matter of concern for the firm.
Return on shareholder equity- Firm give a disappointing performance on this ratio and
its return on shareholder equity percentage is below 20% as well as in some years it is
Paraphrase This Document
Need a fresh take? Get an instant paraphrase of this document with our AI Paraphraser
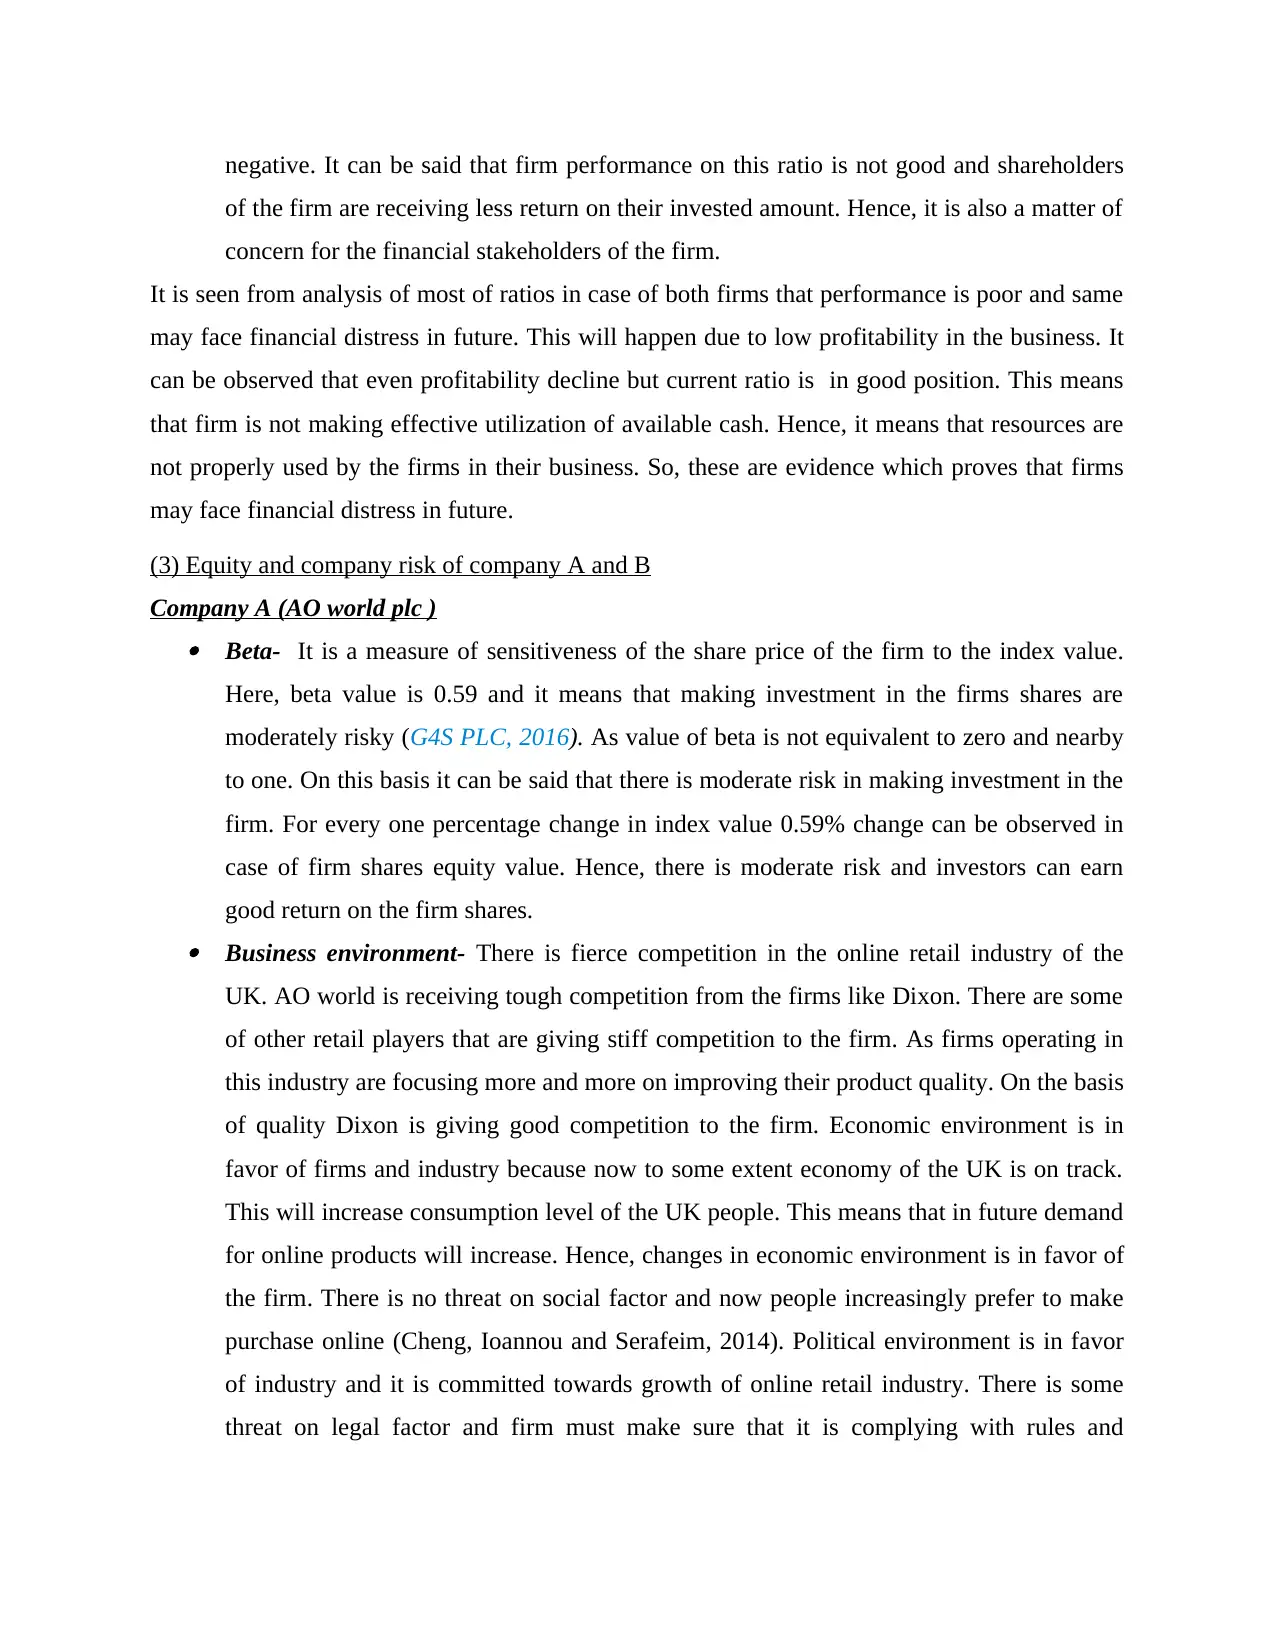
negative. It can be said that firm performance on this ratio is not good and shareholders
of the firm are receiving less return on their invested amount. Hence, it is also a matter of
concern for the financial stakeholders of the firm.
It is seen from analysis of most of ratios in case of both firms that performance is poor and same
may face financial distress in future. This will happen due to low profitability in the business. It
can be observed that even profitability decline but current ratio is in good position. This means
that firm is not making effective utilization of available cash. Hence, it means that resources are
not properly used by the firms in their business. So, these are evidence which proves that firms
may face financial distress in future.
(3) Equity and company risk of company A and B
Company A (AO world plc ) Beta- It is a measure of sensitiveness of the share price of the firm to the index value.
Here, beta value is 0.59 and it means that making investment in the firms shares are
moderately risky (G4S PLC, 2016). As value of beta is not equivalent to zero and nearby
to one. On this basis it can be said that there is moderate risk in making investment in the
firm. For every one percentage change in index value 0.59% change can be observed in
case of firm shares equity value. Hence, there is moderate risk and investors can earn
good return on the firm shares. Business environment- There is fierce competition in the online retail industry of the
UK. AO world is receiving tough competition from the firms like Dixon. There are some
of other retail players that are giving stiff competition to the firm. As firms operating in
this industry are focusing more and more on improving their product quality. On the basis
of quality Dixon is giving good competition to the firm. Economic environment is in
favor of firms and industry because now to some extent economy of the UK is on track.
This will increase consumption level of the UK people. This means that in future demand
for online products will increase. Hence, changes in economic environment is in favor of
the firm. There is no threat on social factor and now people increasingly prefer to make
purchase online (Cheng, Ioannou and Serafeim, 2014). Political environment is in favor
of industry and it is committed towards growth of online retail industry. There is some
threat on legal factor and firm must make sure that it is complying with rules and
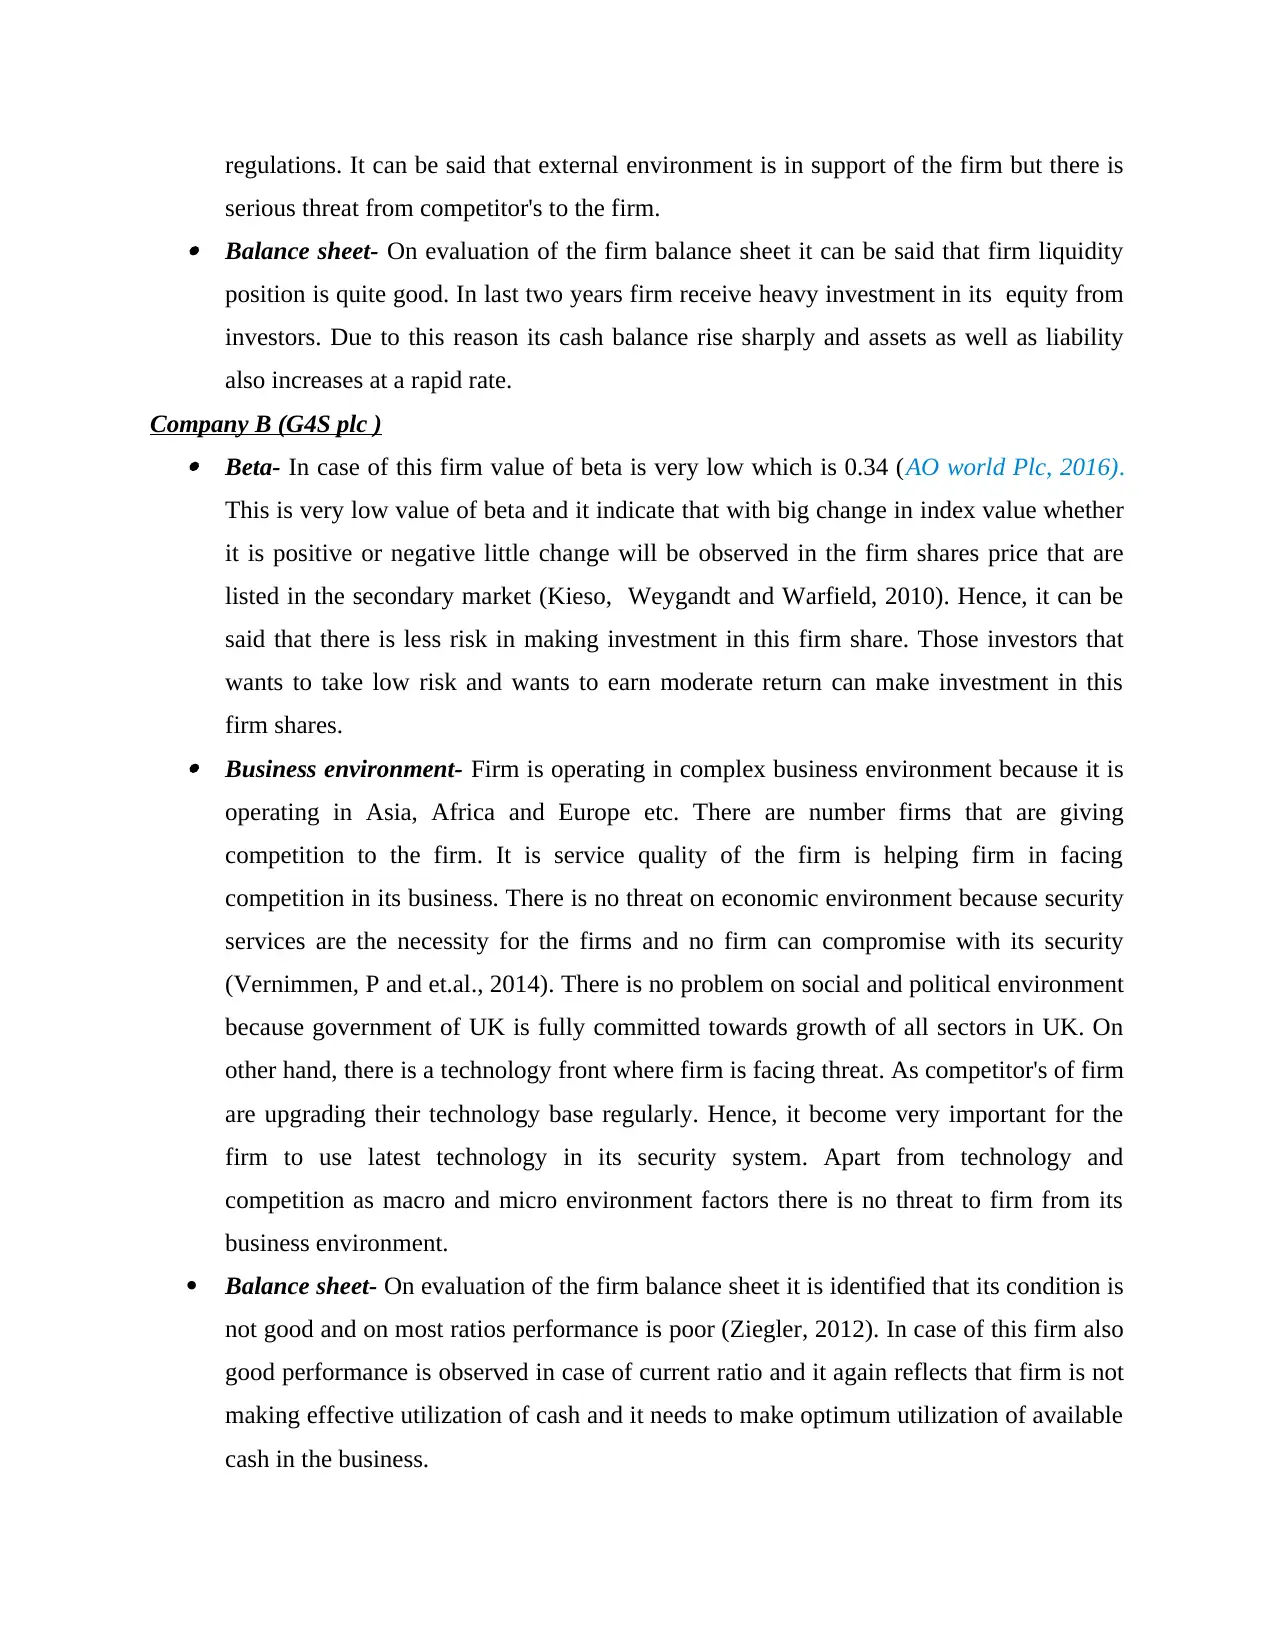
regulations. It can be said that external environment is in support of the firm but there is
serious threat from competitor's to the firm. Balance sheet- On evaluation of the firm balance sheet it can be said that firm liquidity
position is quite good. In last two years firm receive heavy investment in its equity from
investors. Due to this reason its cash balance rise sharply and assets as well as liability
also increases at a rapid rate.
Company B (G4S plc ) Beta- In case of this firm value of beta is very low which is 0.34 (AO world Plc, 2016).
This is very low value of beta and it indicate that with big change in index value whether
it is positive or negative little change will be observed in the firm shares price that are
listed in the secondary market (Kieso, Weygandt and Warfield, 2010). Hence, it can be
said that there is less risk in making investment in this firm share. Those investors that
wants to take low risk and wants to earn moderate return can make investment in this
firm shares. Business environment- Firm is operating in complex business environment because it is
operating in Asia, Africa and Europe etc. There are number firms that are giving
competition to the firm. It is service quality of the firm is helping firm in facing
competition in its business. There is no threat on economic environment because security
services are the necessity for the firms and no firm can compromise with its security
(Vernimmen, P and et.al., 2014). There is no problem on social and political environment
because government of UK is fully committed towards growth of all sectors in UK. On
other hand, there is a technology front where firm is facing threat. As competitor's of firm
are upgrading their technology base regularly. Hence, it become very important for the
firm to use latest technology in its security system. Apart from technology and
competition as macro and micro environment factors there is no threat to firm from its
business environment.
Balance sheet- On evaluation of the firm balance sheet it is identified that its condition is
not good and on most ratios performance is poor (Ziegler, 2012). In case of this firm also
good performance is observed in case of current ratio and it again reflects that firm is not
making effective utilization of cash and it needs to make optimum utilization of available
cash in the business.
⊘ This is a preview!⊘
Do you want full access?
Subscribe today to unlock all pages.
Trusted by 1+ million students worldwide
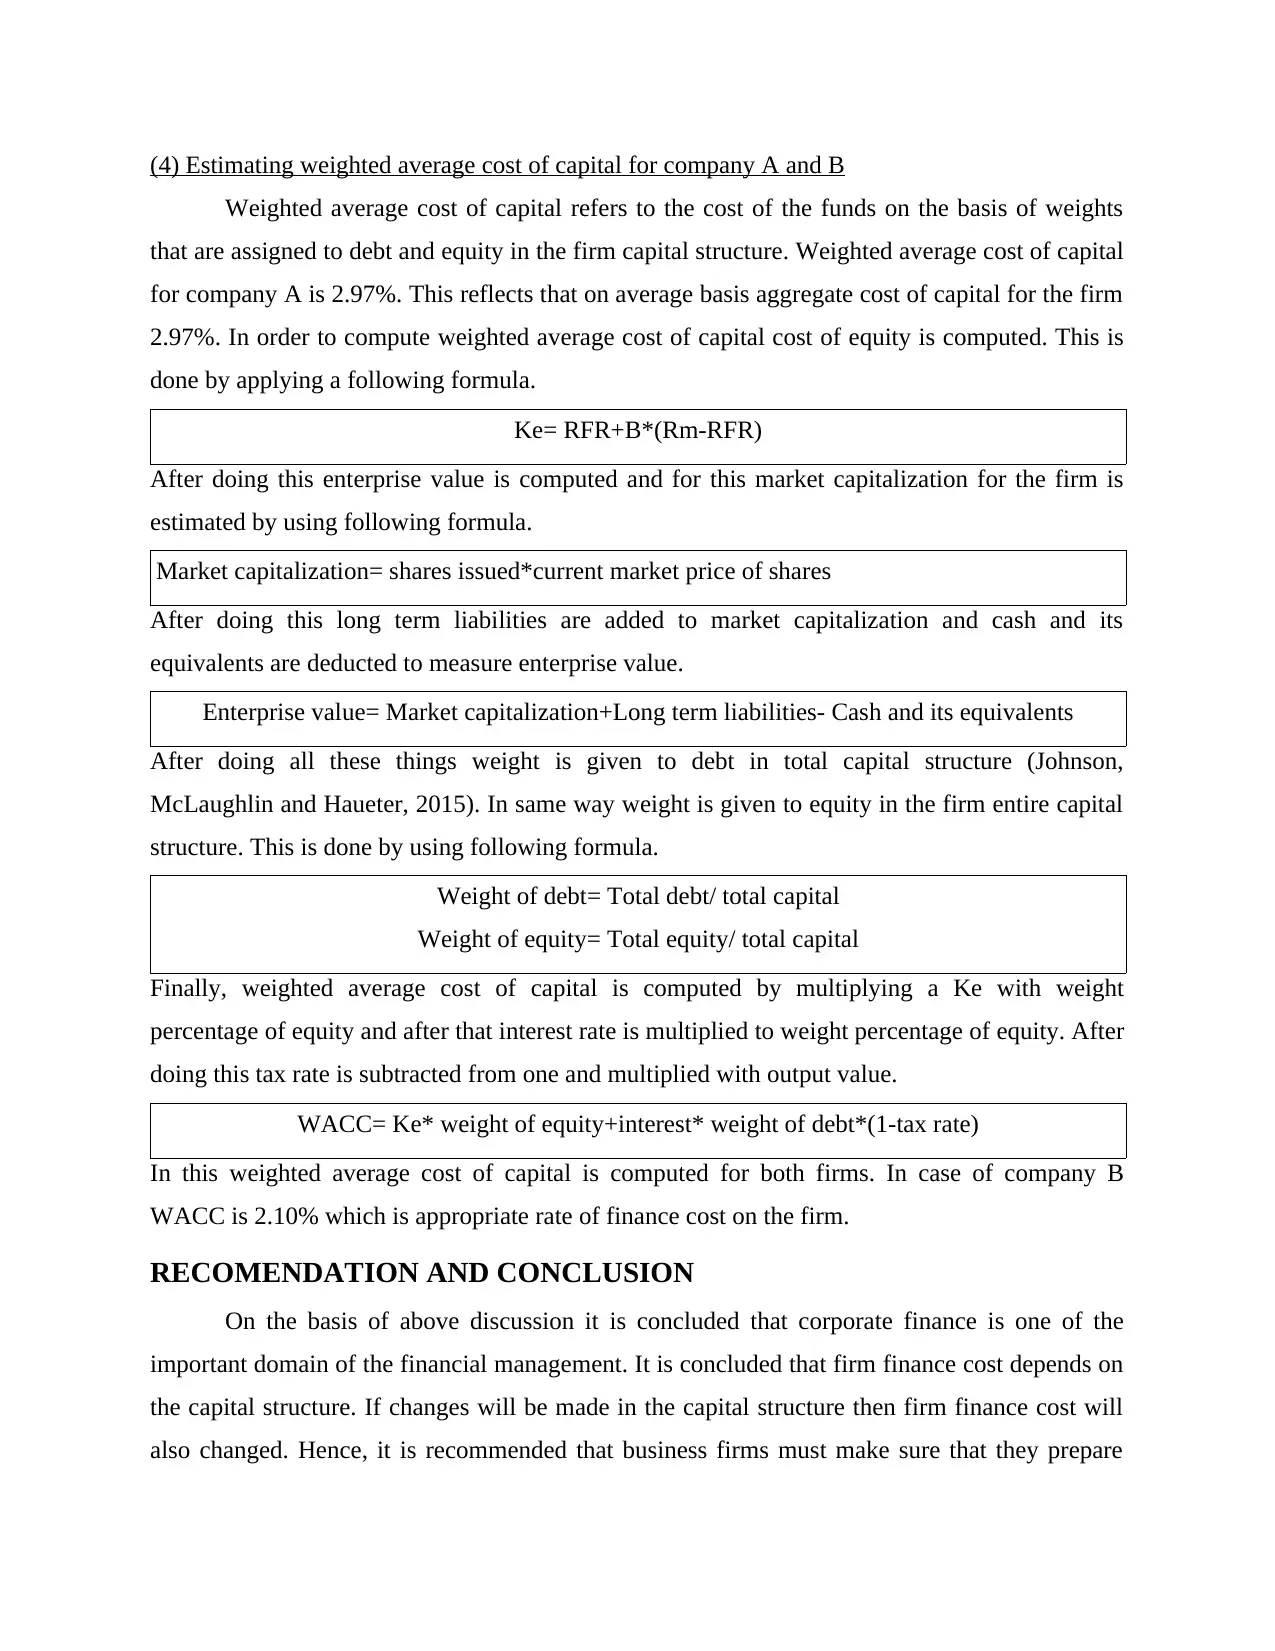
(4) Estimating weighted average cost of capital for company A and B
Weighted average cost of capital refers to the cost of the funds on the basis of weights
that are assigned to debt and equity in the firm capital structure. Weighted average cost of capital
for company A is 2.97%. This reflects that on average basis aggregate cost of capital for the firm
2.97%. In order to compute weighted average cost of capital cost of equity is computed. This is
done by applying a following formula.
Ke= RFR+B*(Rm-RFR)
After doing this enterprise value is computed and for this market capitalization for the firm is
estimated by using following formula.
Market capitalization= shares issued*current market price of shares
After doing this long term liabilities are added to market capitalization and cash and its
equivalents are deducted to measure enterprise value.
Enterprise value= Market capitalization+Long term liabilities- Cash and its equivalents
After doing all these things weight is given to debt in total capital structure (Johnson,
McLaughlin and Haueter, 2015). In same way weight is given to equity in the firm entire capital
structure. This is done by using following formula.
Weight of debt= Total debt/ total capital
Weight of equity= Total equity/ total capital
Finally, weighted average cost of capital is computed by multiplying a Ke with weight
percentage of equity and after that interest rate is multiplied to weight percentage of equity. After
doing this tax rate is subtracted from one and multiplied with output value.
WACC= Ke* weight of equity+interest* weight of debt*(1-tax rate)
In this weighted average cost of capital is computed for both firms. In case of company B
WACC is 2.10% which is appropriate rate of finance cost on the firm.
RECOMENDATION AND CONCLUSION
On the basis of above discussion it is concluded that corporate finance is one of the
important domain of the financial management. It is concluded that firm finance cost depends on
the capital structure. If changes will be made in the capital structure then firm finance cost will
also changed. Hence, it is recommended that business firms must make sure that they prepare
Paraphrase This Document
Need a fresh take? Get an instant paraphrase of this document with our AI Paraphraser
balanced capital structure. By doing so cost of capital can be minimized. Complete dependency
on debt and equity is not a solution instead it will create problem for the firm in future. Hence,
firms it is recommended that must cautiously prepare their capital structure. It is also
recommended that beta and analysis of business environment show different type of risks.
Hence, investors before making an investment must access risk on the of beta and analysis of
business environment.
REFERENCES
Books & journal
Brealey, R.A. and et.al., 2012. Principles of corporate finance. Tata McGraw-Hill Education.
Cheng, B., Ioannou, I. and Serafeim, G., 2014. Corporate social responsibility and access to
finance. Strategic Management Journal. 35(1). pp.1-23.
Damodaran, A., 2010. Applied corporate finance. John Wiley & Sons.
Duchin, R., Ozbas, O. and Sensoy, B.A., 2010. Costly external finance, corporate investment,
and the subprime mortgage credit crisis. Journal of Financial Economics. 97(3). pp.418-
435.
Hillier, D., Grinblatt, M. and Titman, S., 2011. Financial markets and corporate strategy .
McGraw-Hill.
Huang, J. and Kisgen, D.J., 2013. Gender and corporate finance: Are male executives
overconfident relative to female executives?. Journal of Financial Economics. 108(3).
pp.822-839.
Johnson, C.J., McLaughlin, J. and Haueter, E.S., 2015. Corporate finance and the securities
laws. Wolters Kluwer Law & Business.
Kieso, D.E., Weygandt, J.J. and Warfield, T.D., 2010. Intermediate accounting: IFRS edition
(Vol. 2). John Wiley & Sons.
Vernimmen, P. and et.al., 2014. Corporate finance: theory and practice. John Wiley & Sons.
Ziegler, A.C., 2012. A game theory analysis of options: corporate finance and financial
intermediation in continuous time. Springer Science & Business Media.
Online
What is the gross margin ratio, 2016. [Online]. Available through: <
http://www.accountingcoach.com/blog/gross-margin-ratio>. [.Accessed on 16th May
2016].
G4S PLC, 2016. [Online]. Available through: <
http://markets.ft.com/research/Markets/Tearsheets/Summary?s=GFS:LSE>. [Accessed on
17th May 2016].
AO world Plc, 2016. [Online]. Available through: <
http://www.infinancials.com/fe-EN/40299EX/AO-World-Plc/Beta>. [Accessed on 17th
May 2016].
⊘ This is a preview!⊘
Do you want full access?
Subscribe today to unlock all pages.
Trusted by 1+ million students worldwide
1 out of 16
Related Documents


Your All-in-One AI-Powered Toolkit for Academic Success.
+13062052269
info@desklib.com
Available 24*7 on WhatsApp / Email
![[object Object]](/_next/static/media/star-bottom.7253800d.svg)
Unlock your academic potential
Copyright © 2020–2026 A2Z Services. All Rights Reserved. Developed and managed by ZUCOL.