Analysis of CML, SML, Minimum Variance Portfolio, and CAPM
VerifiedAdded on 2023/06/05
|13
|2400
|478
Report
AI Summary
This report provides an in-depth analysis of key concepts in corporate financial management, focusing on the Capital Market Line (CML), Security Market Line (SML), Minimum Variance Portfolio, and the Capital Asset Pricing Model (CAPM). It begins by differentiating between the CML and SML, highlighting how they represent portfolio returns and market risk, respectively, using standard deviation and beta coefficients as risk measures. The report then explores the concept of the minimum variance portfolio, explaining its role in optimizing risk and return by allocating equity portfolios to minimize variance. Furthermore, the report delves into the CAPM, outlining its use in estimating the relationship between expected asset returns and systematic risk, and discussing its assumptions and advantages in determining the cost of equity. Through detailed discussions and graphical representations, the report offers valuable insights into these financial models, providing a comprehensive understanding of their applications and implications in investment and portfolio management.

Running head: CORPORATE FINANCIAL MANAGEMENT
Corporate Financial Management
Name of the Student
Name of the University
Author Note
Corporate Financial Management
Name of the Student
Name of the University
Author Note
Paraphrase This Document
Need a fresh take? Get an instant paraphrase of this document with our AI Paraphraser

1CORPORATE FINANCIAL MANAGEMENT
Executive Summary
This report deals with the capital market line and security market line. It also discusses the
differences between them. The idea of minimum variance portfolio is analysed .The benefits
are also discussed. The concept of CAPM is drawn . The advantages are also discussed in
detail. It is a measure on how do we calculate the return of a stock and how best we can say
it.
2CORPORATE FINANCIAL MANAGEMENT
Table of Contents
Introduction................................................................................................................................3
Discussion..................................................................................................................................4
CML VS SML........................................................................................................................4
Minimum variance portfolio..................................................................................................5
CAPM....................................................................................................................................7
Recommendations......................................................................................................................9
Conclusion..................................................................................................................................9
References................................................................................................................................11
⊘ This is a preview!⊘
Do you want full access?
Subscribe today to unlock all pages.
Trusted by 1+ million students worldwide
3CORPORATE FINANCIAL MANAGEMENT
Introduction
This report gives a brief account of the capital market line and the security market line . It
also states the dissimilarities between them. The security is measured by a beta coefficient .
The security market line virtually represents the capital market line .CML is a graph that
shows all possible combinations along the expected portfolio.The above frontier consists of
the combinations along the market portfolio and a risk free asset. The report make an indepth
analysis of the two . Then it discourses the idea of minimum variance portfolio and its
position in selecting stocks that enhance return and reduce risks. It also demonstrates the
significance of CAPM .
Paraphrase This Document
Need a fresh take? Get an instant paraphrase of this document with our AI Paraphraser
4CORPORATE FINANCIAL MANAGEMENT
Discussion
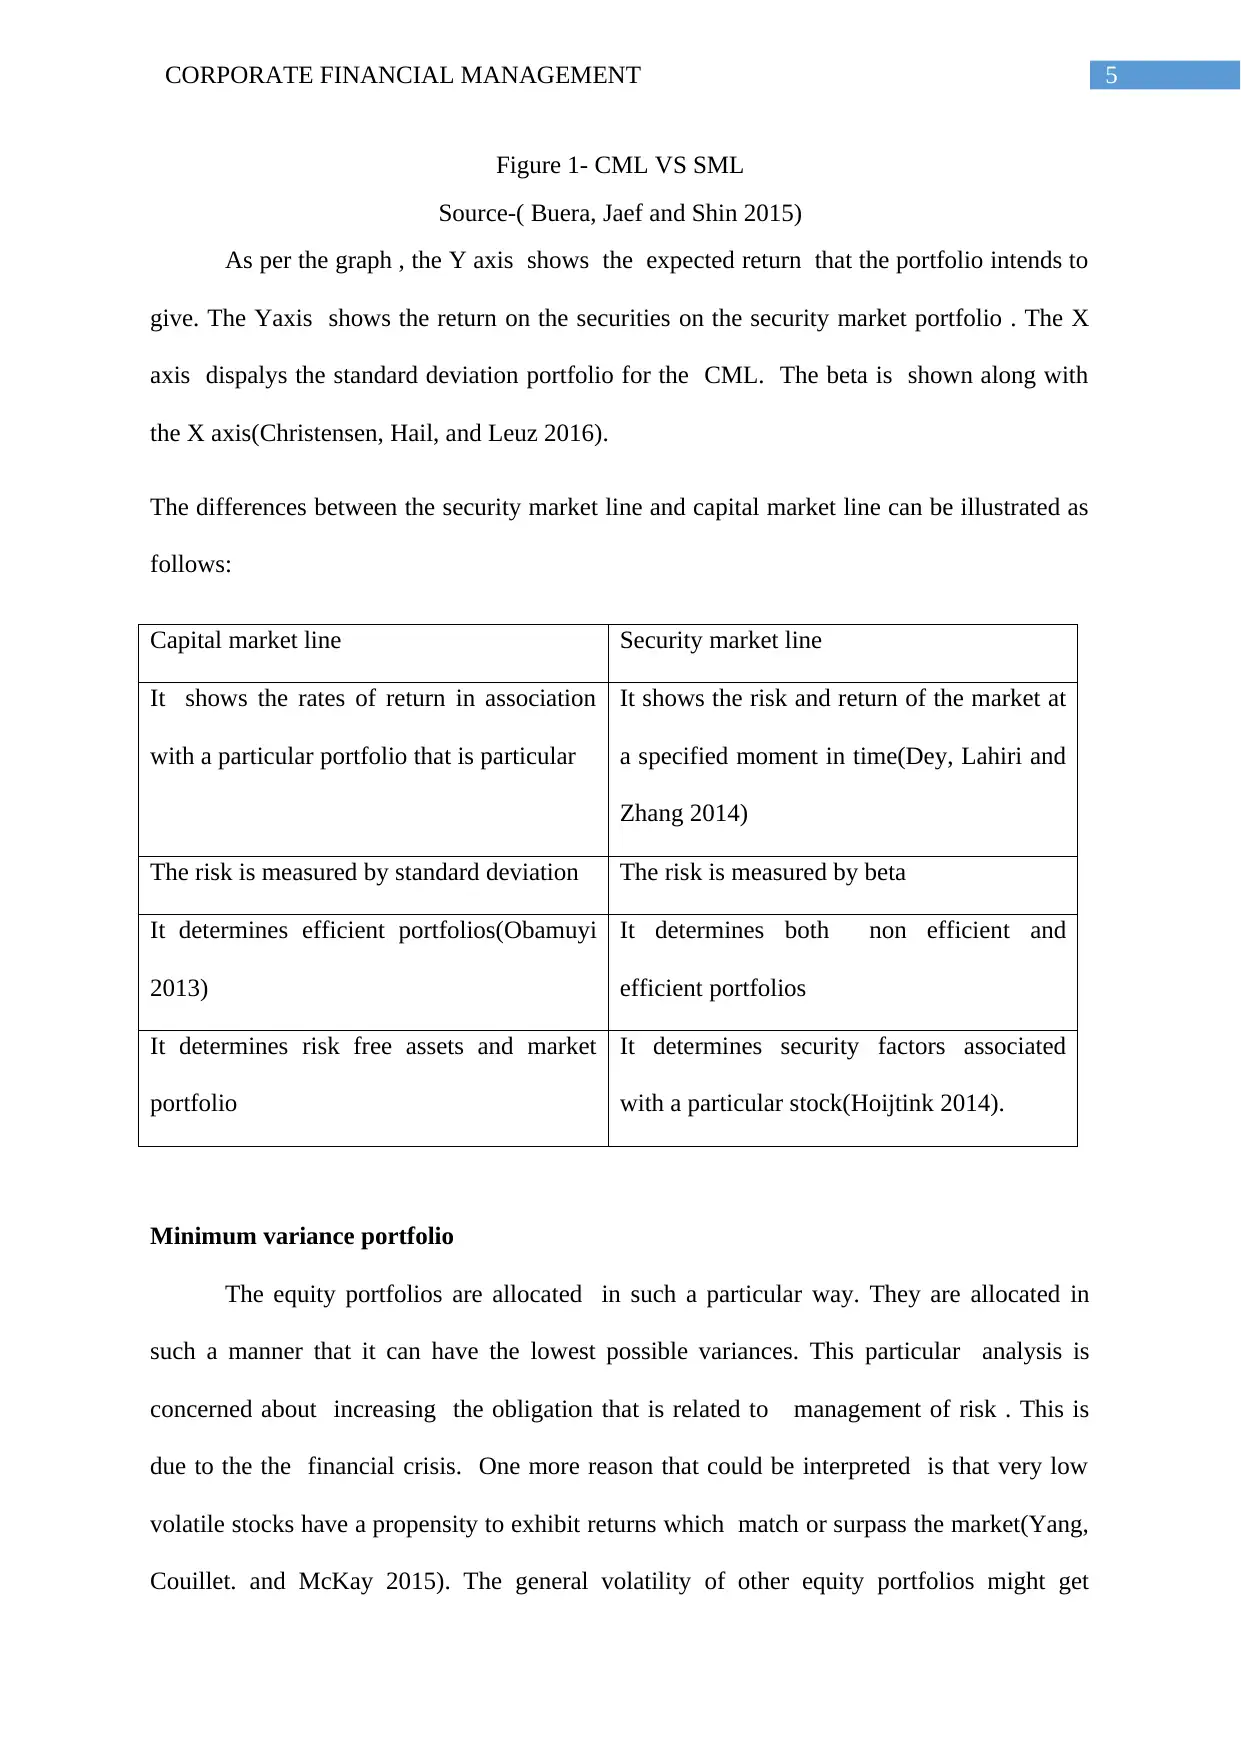
CML VS SML
The CML is a line that displays stock returns.. SML is a graph that symbolises the risk of the
market at a fixed point of time. It depends on the risk free rate of return. It is also dependent
on the levels of risk in association to a specific portfolio. Standard deviation measures the
risk factor for CML(Ahmed and Zlate 2014). The beta coefficient measures the risk factor
for SML. Security market line outlines both non efficient and efficient portfolios. The capital
market line helps define efficient portfolios only (Christensen, Hail and Leuz 2016).
Discussion
CML VS SML
The CML is a line that displays stock returns.. SML is a graph that symbolises the risk of the
market at a fixed point of time. It depends on the risk free rate of return. It is also dependent
on the levels of risk in association to a specific portfolio. Standard deviation measures the
risk factor for CML(Ahmed and Zlate 2014). The beta coefficient measures the risk factor
for SML. Security market line outlines both non efficient and efficient portfolios. The capital
market line helps define efficient portfolios only (Christensen, Hail and Leuz 2016).
5CORPORATE FINANCIAL MANAGEMENT
Figure 1- CML VS SML
Source-( Buera, Jaef and Shin 2015)
As per the graph , the Y axis shows the expected return that the portfolio intends to
give. The Yaxis shows the return on the securities on the security market portfolio . The X
axis dispalys the standard deviation portfolio for the CML. The beta is shown along with
the X axis(Christensen, Hail, and Leuz 2016).
The differences between the security market line and capital market line can be illustrated as
follows:
Capital market line Security market line
It shows the rates of return in association
with a particular portfolio that is particular
It shows the risk and return of the market at
a specified moment in time(Dey, Lahiri and
Zhang 2014)
The risk is measured by standard deviation The risk is measured by beta
It determines efficient portfolios(Obamuyi
2013)
It determines both non efficient and
efficient portfolios
It determines risk free assets and market
portfolio
It determines security factors associated
with a particular stock(Hoijtink 2014).
Minimum variance portfolio
The equity portfolios are allocated in such a particular way. They are allocated in
such a manner that it can have the lowest possible variances. This particular analysis is
concerned about increasing the obligation that is related to management of risk . This is
due to the the financial crisis. One more reason that could be interpreted is that very low
volatile stocks have a propensity to exhibit returns which match or surpass the market(Yang,
Couillet. and McKay 2015). The general volatility of other equity portfolios might get
⊘ This is a preview!⊘
Do you want full access?
Subscribe today to unlock all pages.
Trusted by 1+ million students worldwide
6CORPORATE FINANCIAL MANAGEMENT
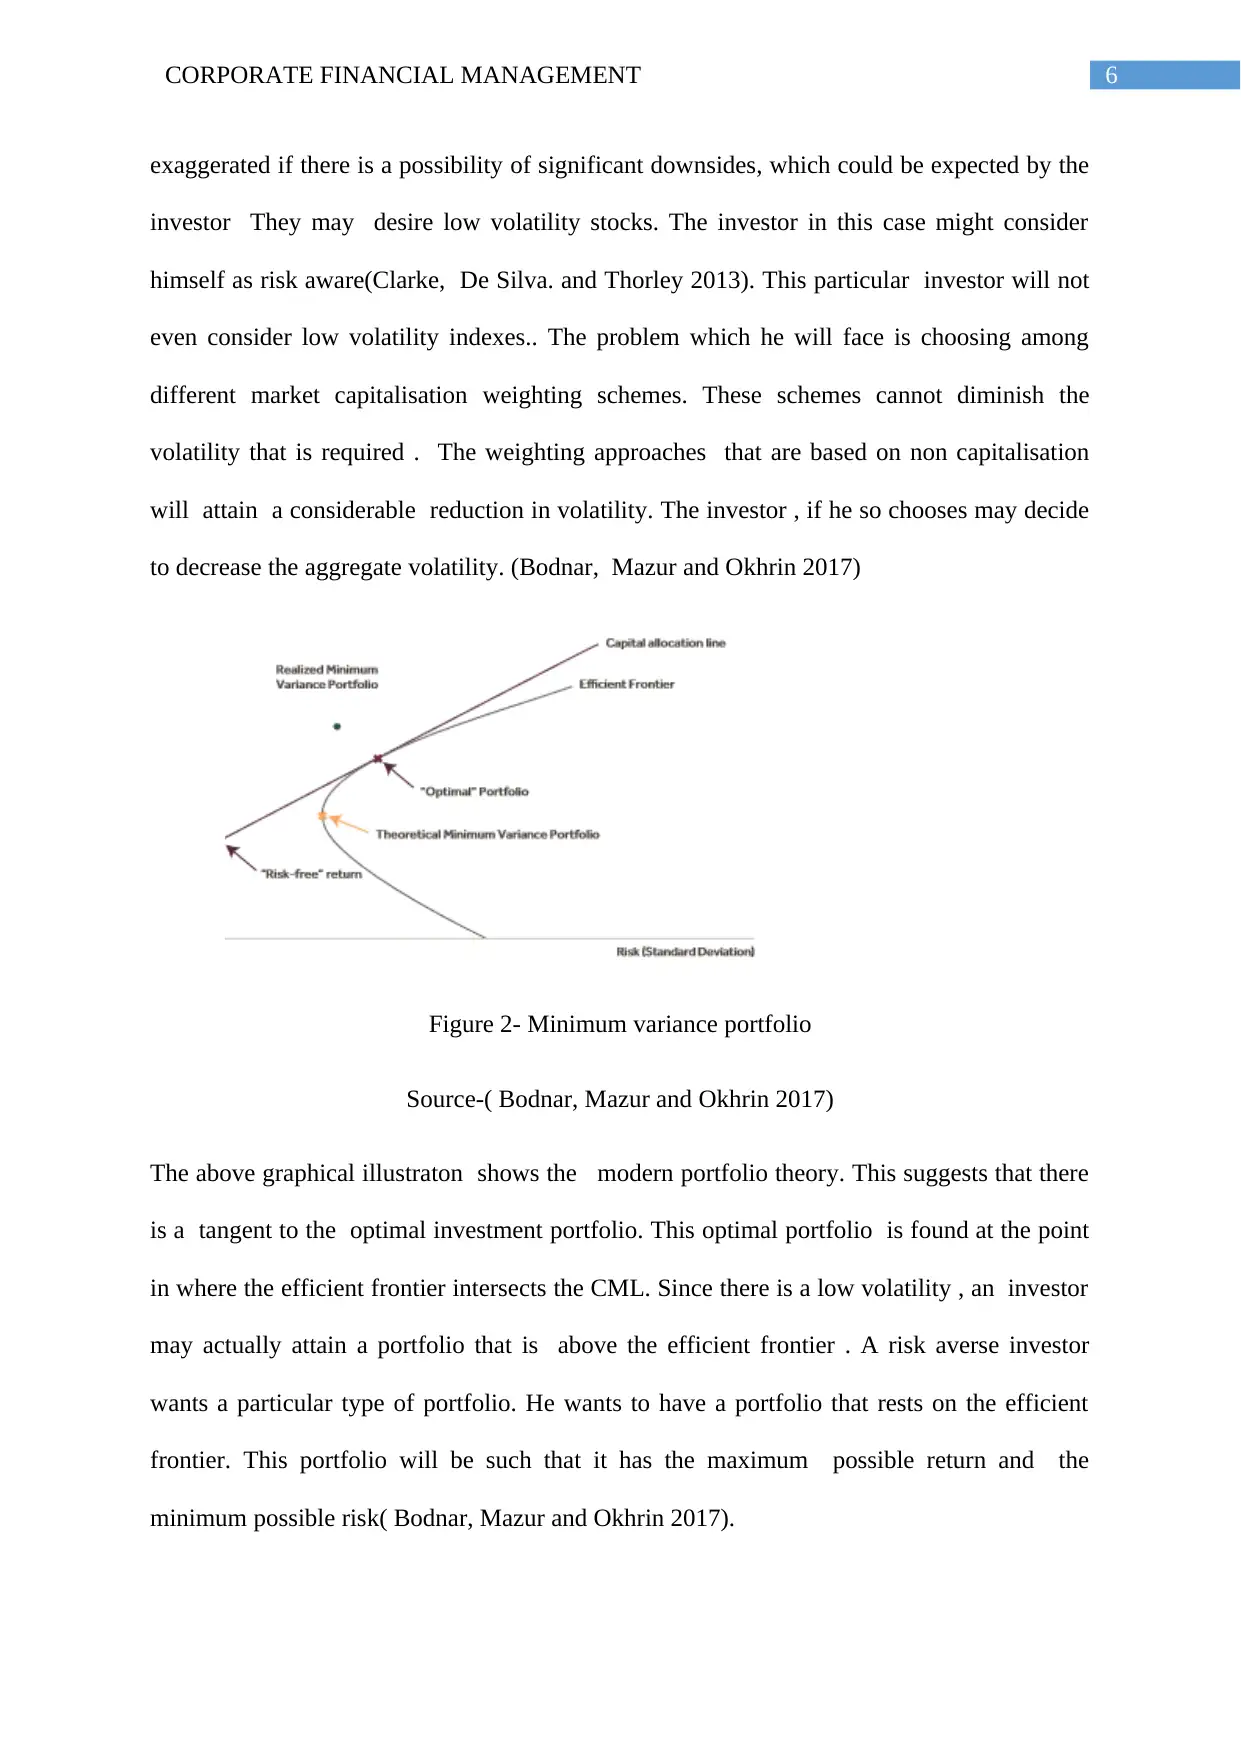
exaggerated if there is a possibility of significant downsides, which could be expected by the
investor They may desire low volatility stocks. The investor in this case might consider
himself as risk aware(Clarke, De Silva. and Thorley 2013). This particular investor will not
even consider low volatility indexes.. The problem which he will face is choosing among
different market capitalisation weighting schemes. These schemes cannot diminish the
volatility that is required . The weighting approaches that are based on non capitalisation
will attain a considerable reduction in volatility. The investor , if he so chooses may decide
to decrease the aggregate volatility. (Bodnar, Mazur and Okhrin 2017)
Figure 2- Minimum variance portfolio
Source-( Bodnar, Mazur and Okhrin 2017)
The above graphical illustraton shows the modern portfolio theory. This suggests that there
is a tangent to the optimal investment portfolio. This optimal portfolio is found at the point
in where the efficient frontier intersects the CML. Since there is a low volatility , an investor
may actually attain a portfolio that is above the efficient frontier . A risk averse investor
wants a particular type of portfolio. He wants to have a portfolio that rests on the efficient
frontier. This portfolio will be such that it has the maximum possible return and the
minimum possible risk( Bodnar, Mazur and Okhrin 2017).
Paraphrase This Document
Need a fresh take? Get an instant paraphrase of this document with our AI Paraphraser
7CORPORATE FINANCIAL MANAGEMENT
The importance of the minimum variance portfolio theory can be illustrated in the following
way:
The securities having low volatility attains a higher rate of return compared to stocks
that have high volatility.
It has a inclination to be more vigorous when the market is down. However as soon as
the market makes a full recovery, the minimum variance portfolio tends to display a
compounding rate of return.
This minimum variance portfolio suggests that the returns on a particular stock
should outperform the weighted capital market portfolio( Bodnar, Mazur and Okhrin
2017).
CAPM
CAPM is a model that provides the best estimate of the relationship between
expected return for assets and the level of systematic risk. It is used to generate the
expected return for assets. This method is predominantly used to value securities of a risky
nature(Smith. and Walsh 2013).
The main idea behind this model is the risk associated with various securities. It also
computes the compensation amount .This is the amount which the investor needs so that he
can sustain the additional risk that he has to bear in relation to this security . This can be
evaluated by using beta. Beta compares the return of the asset to the return that the market
gives over time . It reflects how risky the asset is.It considers the market premium . It also
studies the percentage change or the excess amount that the market return has over the risk
free rate.This risk is then compared to the volatility of the market . It incorporates a risk free
premium. As per this model it is stated that the expected return of a security or portfolio is
8CORPORATE FINANCIAL MANAGEMENT
similar to that of the risk free security rate. This model also states that it would be prudent not
to invest if for some reason ,the expected market return does not meet or beat the required
return.(Campbell et al. 2018).
Some of the assumptions of the CAPM include:
Single period transaction - CAPM assumes a standardised holding period. of one year.This
is used so that the comparison of return on different securities can be done.
Diversified portfolios- This point makes the claim that investors can diversify their
investments, they can reduce their systematic risk This is because the diversification of the e
unsystematic risk can be done and subsequently cannot be ignored.
Perfect capital market-A perfect capital market means that all the securities are valued at
the rate at what they should be valued..In a perfect market, there is a lack of tax or
transaction costs . Their returns will be plotted on the SML The perfect capital market
assumes that there is free information is available to all investors. However it can be stated
that capital markets are not perfect in nature. The return on securities are usually mentioned
annually. The one year holding period assumption may appear to be reasonable from the
perspective of the real world. However in reality the investors hold securities for more than a
year.
CAPM is indeed more relevant than other companies when calculating the rates of return for
expected return on assets. These include:
The model is founded on a theoretical relationship. This theoretical relationship can
be attributed to the fact that there is a relationship between systematic risk and
required rate of return .
⊘ This is a preview!⊘
Do you want full access?
Subscribe today to unlock all pages.
Trusted by 1+ million students worldwide
9CORPORATE FINANCIAL MANAGEMENT
It considers the level of systematic risk only. It considers a situation where
stockholders have varied portfolios. These diversified portfolios consist of securities
that eliminate the unsystematic risk.
It is better method compared to the dividend growth model regarding the
computation of a costof equity. This method contemplates the systematic risk of a
company. The risk is relative to the stock market’s overall risk .It is therefore a much
more effective method than other models. It is also applicable to all investment
methods (Maio 2013).
Recommendations
From the report there are certain recommendations that are as follows:
Both capital market line and security market line are useful tools in order to determine
whether the asset that is being considered for a portfolio that offers a reasonable
expected return for risk.
Minimum variance portfolio offers a minimum level of risk and considers a portfolio
allocation that best optimises risk and return for a security.
CAPM is a method by which can calculate the expected return on assets, especially
stocks. These can help in effective determination of the rates of return for particular
assets.
Conclusion
It is evident from the report that the security market line is indeed different than the
capital market line . The differences highlight the uniqueness of the two concepts. A
minimum variance portfolio analysis is also done. This analysis considers the minimum
variance portfolio . Now the minimum variance portfolio has been found to be a suitable
method for selecting stocks. These stocks have ideal returns and minimum risk variance.
Paraphrase This Document
Need a fresh take? Get an instant paraphrase of this document with our AI Paraphraser

10CORPORATE FINANCIAL MANAGEMENT
From the CAPM discussion, it is evident that it is a more relevant method than other
equations than the required rate of return. It helps in measuring the return on asset by
associating the beta. This beta is a measure of systematic risk . This systematic risk is
combined when one is calculating the rate of return on a security using the CAPM. It also
helps in figuring the cost of equity. The CAPM is the best method while determining return
on risky securities. It is based on a theoretical approach that best determines systematic risk
and eliminates unsystematic risk. So it is more effective in computing prices of securities.
11CORPORATE FINANCIAL MANAGEMENT
References
Ahmed, S. and Zlate, A., 2014. Capital flows to emerging market economies: a brave new
world?. Journal of International Money and Finance, 48, pp.221-248.
Bodnar, T., Mazur, S. and Okhrin, Y., 2017. Bayesian estimation of the global minimum
variance portfolio. European Journal of Operational Research, 256(1), pp.292-307.
Buera, F.J., Jaef, R.N.F. and Shin, Y., 2015. Anatomy of a credit crunch: from capital to labor
markets. Review of Economic Dynamics, 18(1), pp.101-117.
Campbell, J.Y., Giglio, S., Polk, C. and Turley, R., 2018. An intertemporal CAPM with
stochastic volatility. Journal of Financial Economics, 128(2), pp.207-233.
Christensen, H.B., Hail, L. and Leuz, C., 2016. Capital-market effects of securities
regulation: Prior conditions, implementation, and enforcement. The Review of Financial
Studies, 29(11), pp.2885-2924.
Clarke, R., De Silva, H. and Thorley, S., 2013. Risk parity, maximum diversification, and
minimum variance: An analytic perspective. The Journal of Portfolio Management, 39(3),
pp.39-53.
Dekker, H.A., 2017. The invisible line: land reform, land tenure security and land
registration. Routledge.
Dempsey, M., 2013. The capital asset pricing model (CAPM): the history of a failed
revolutionary idea in finance?. Abacus, 49, pp.7-23.
Dey, D., Lahiri, A. and Zhang, G., 2014. Quality Competition and Market Segmentation in
the Security Software Market. Mis Quarterly, 38(2).
⊘ This is a preview!⊘
Do you want full access?
Subscribe today to unlock all pages.
Trusted by 1+ million students worldwide
1 out of 13
Related Documents


Your All-in-One AI-Powered Toolkit for Academic Success.
+13062052269
info@desklib.com
Available 24*7 on WhatsApp / Email
![[object Object]](/_next/static/media/star-bottom.7253800d.svg)
Unlock your academic potential
Copyright © 2020–2026 A2Z Services. All Rights Reserved. Developed and managed by ZUCOL.