Holmes Institute: Corporate Accounting Report - Telstra and TPG
VerifiedAdded on 2023/06/04
|27
|5087
|482
Report
AI Summary
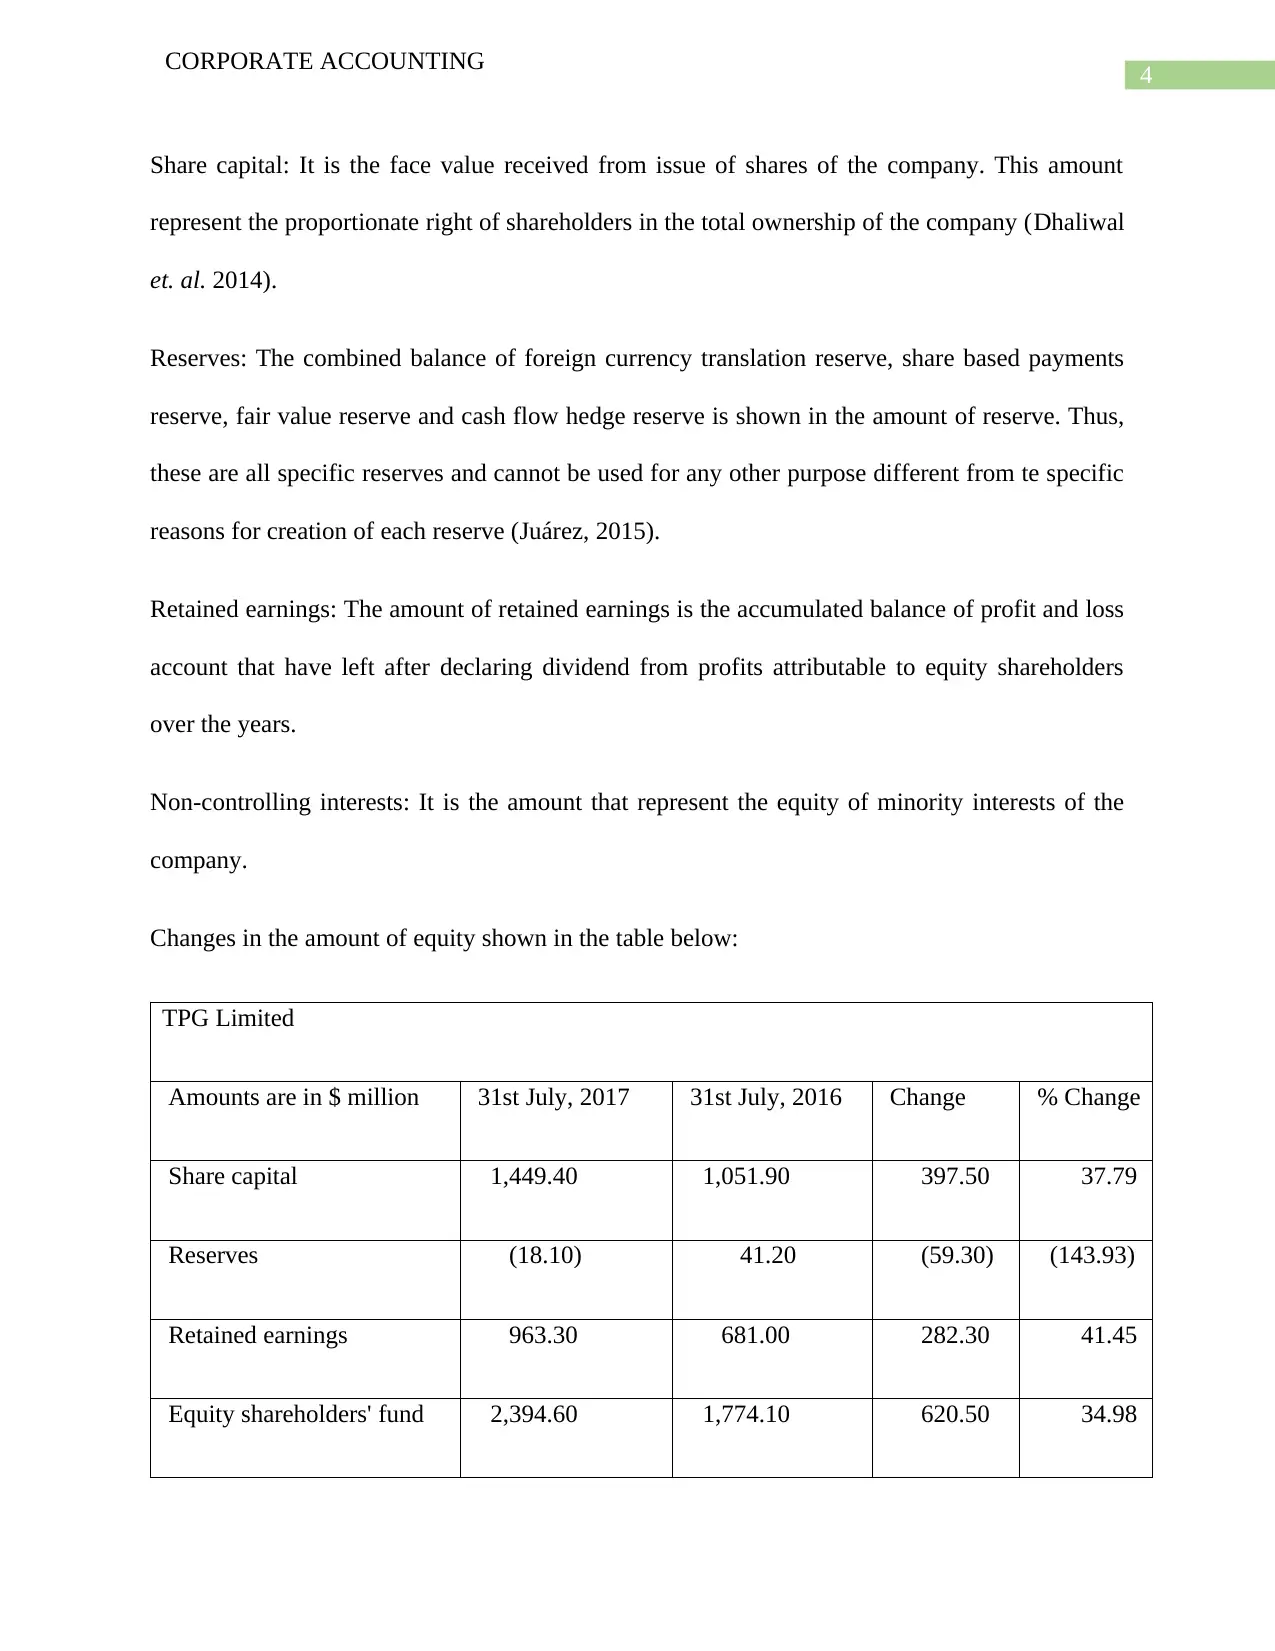
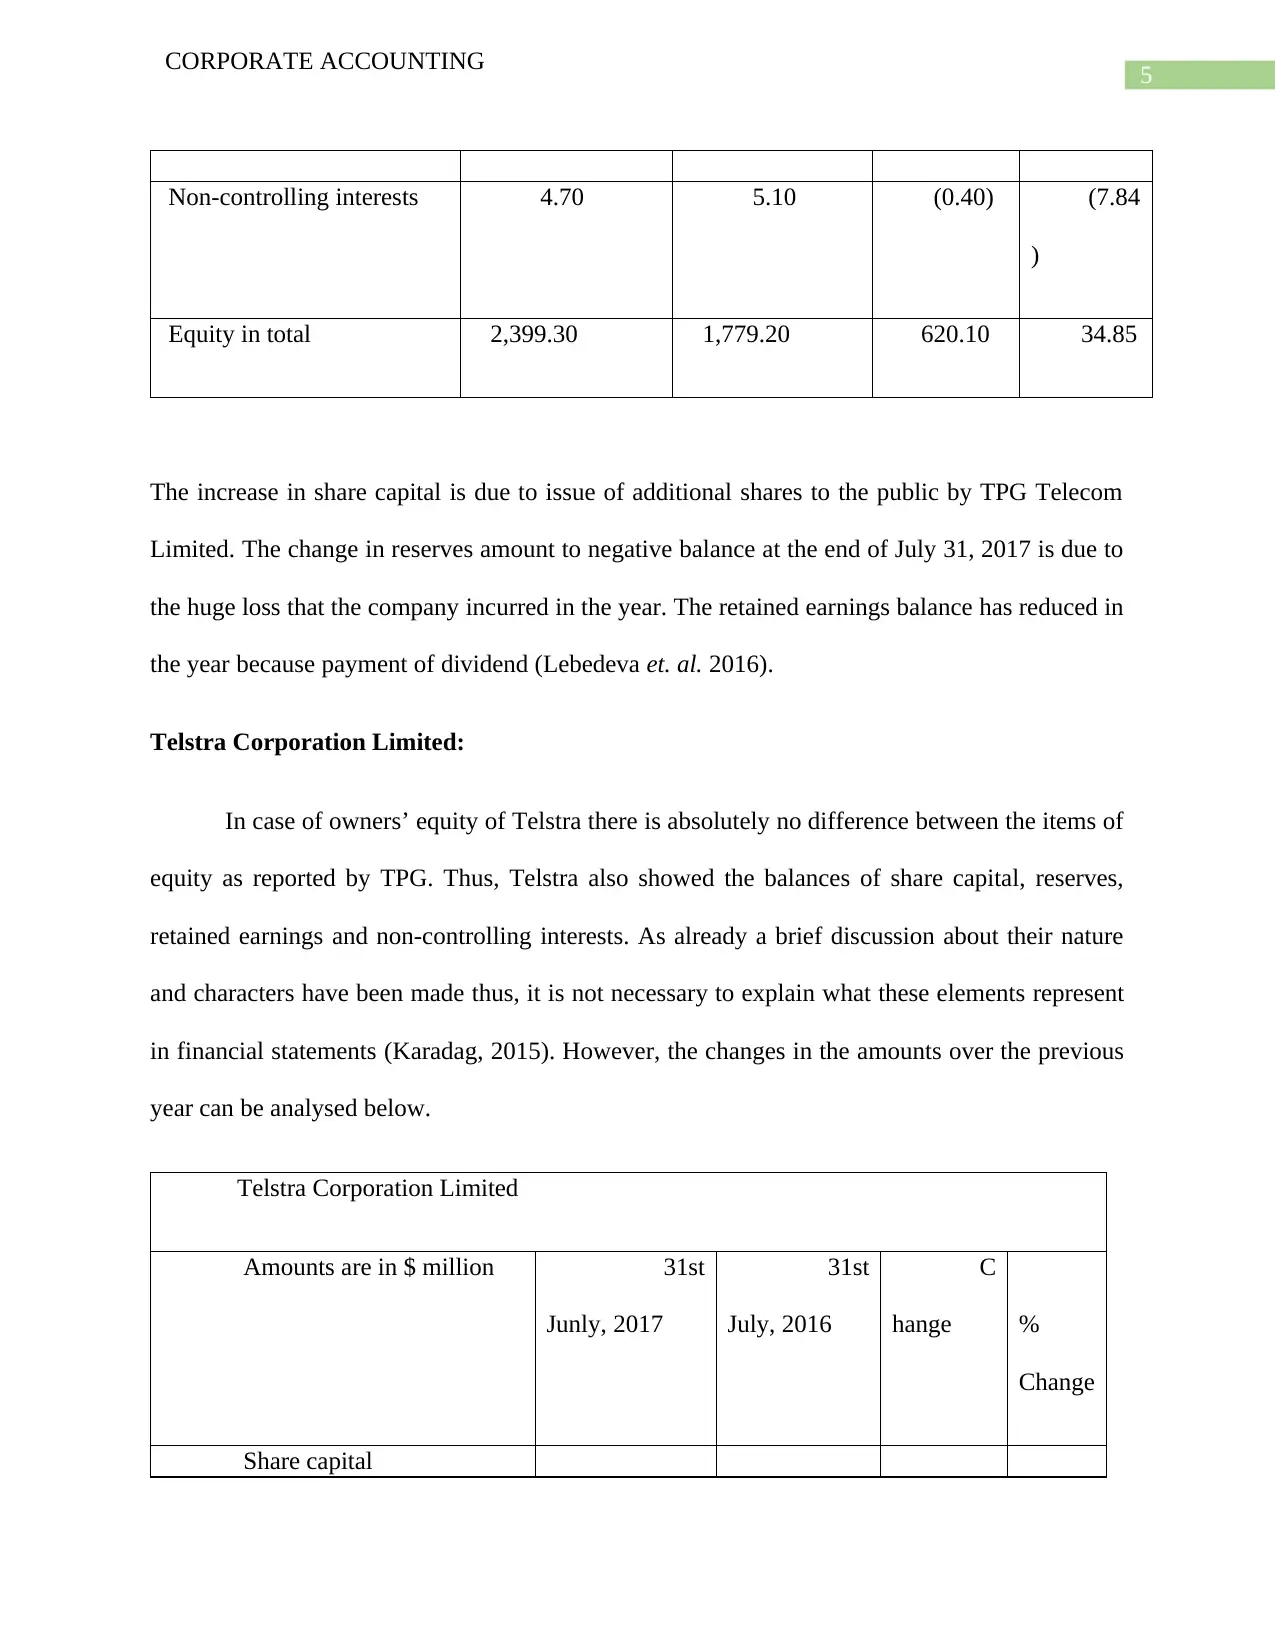
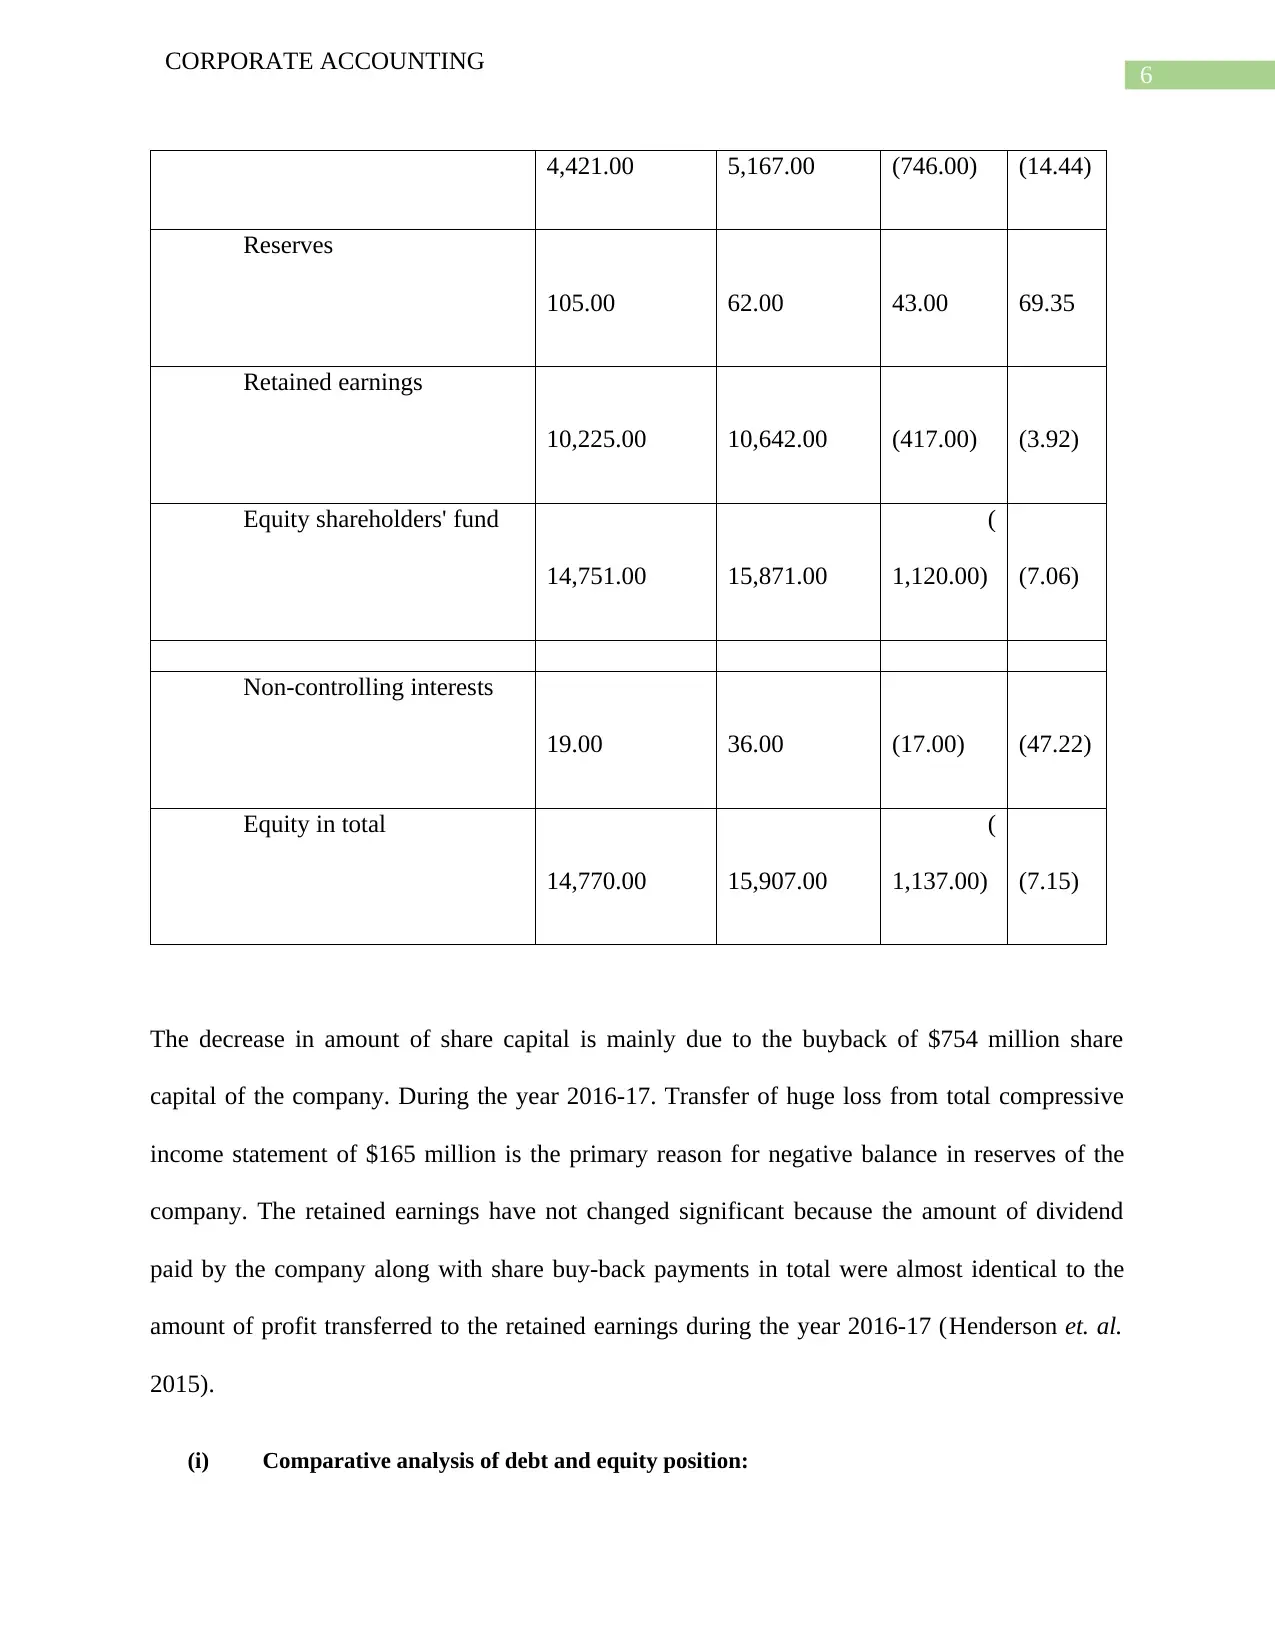
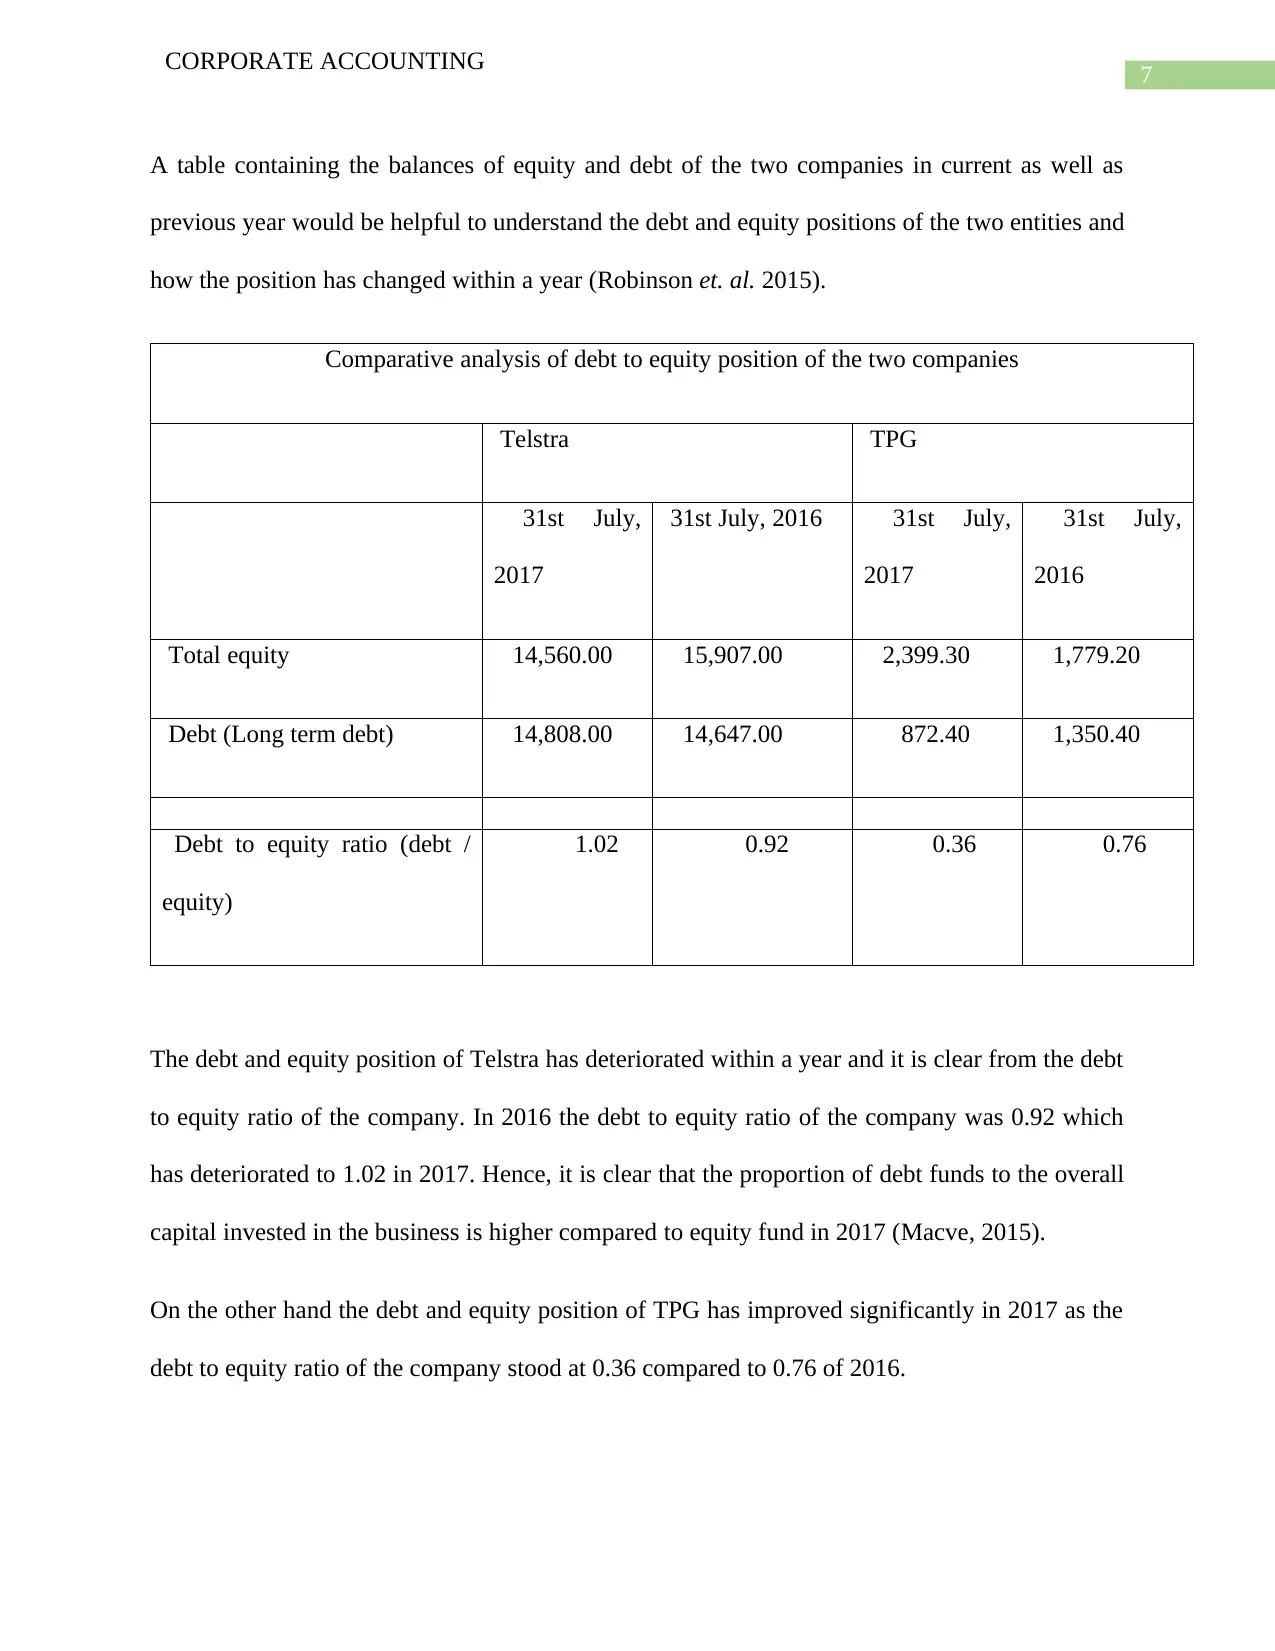
This report provides a comprehensive analysis of the financial statements of two Australian Securities Exchange (ASX) listed companies, Telstra Corporation Limited and TPG Telecom Limited, as required by a Corporate Accounting assignment. The report begins with an executive summary and introduction to both companies, followed by an in-depth examination of their owners' equity, including share capital, reserves, retained earnings, and non-controlling interests, with comparative analyses of changes over time. The analysis extends to cash flow statements, comparing operating, investing, and financing activities, along with a comparative debt to equity analysis. The report also delves into the other comprehensive income statements, identifying key items like foreign exchange translation effects and fair value changes. Finally, the report covers corporate income tax accounting and concludes with a summary of the findings, providing a thorough overview of the financial performance and positions of Telstra and TPG Telecom.

Running head: CORPORATE ACCOUNTING
Corporate Accounting
Name of the Student:
Name of the University:
Authors Note:
Corporate Accounting
Name of the Student:
Name of the University:
Authors Note:
Paraphrase This Document
Need a fresh take? Get an instant paraphrase of this document with our AI Paraphraser

1
CORPORATE ACCOUNTING
Executive Summary:
Financial reports are prepared by entities and organizations operating in Australia to
comply with the requirements of Corporations Act, 2001 (the act). In Australia, the corporations
and entities established under the act must abide by the rules and regulations enumerated in
different sections of the act to avoid penalty. Australian Securities Exchange is the largest
exchange in the country that has shares of different companies, not only from the country but
across the globe, listed in its index. The primary objective of this document is to discuss about
different elements of financial statements of entities enlisted in Australian Securities Exchange.

2
CORPORATE ACCOUNTING
Contents
Executive Summary:........................................................................................................................1
Introduction:....................................................................................................................................3
Owners’ equity:...............................................................................................................................3
Analysis of cash flow statements of two companies:......................................................................8
Other Comprehensive Income Statement analysis:.......................................................................12
Corporate Income Tax Accounting:..............................................................................................16
Conclusion:....................................................................................................................................21
References:....................................................................................................................................22
⊘ This is a preview!⊘
Do you want full access?
Subscribe today to unlock all pages.

Trusted by 1+ million students worldwide

3
CORPORATE ACCOUNTING
Introduction:
The two chosen entities for this purpose are Telstra Corporations and TPG Telecom
Limited. A brief introduction about the two entities shall provide a frame of reference to the
readers of the document while evaluating the details about these two companies.
Telstra Corporation Limited (Telstra): Telstra Corporation builds telecommunication networks
and operates these networks to provide top quality telecommunication services to the citizens of
the country. Apart from Australia the country also has its operations extended to different parts
of the world. The company, founded in 1975, has it’s headquarter in Melbourne, Australia.
TPG Telecom Limited (TPG): A giant in Telecommunication industry in Australia, TPG
specializes in internet and mobile telecommunication services. In internet service providing
market TPG has the second largest market share. The company also has the distinction of
running and operating largest mobile virtual network in the country. Initially the company was
founded as Total Peripherals Group in 1986. Registered head office of the company is situated at
New South Wales, Australia.
Taking into consideration the profiles of the two entities selected for the exercise in this
document, let us now get into a detailed discussion about various elements of financial
statements of these two companies.
Owners’ equity:
TPG Limited:
Owners’ equity section of TPG shows the following items:
Paraphrase This Document
Need a fresh take? Get an instant paraphrase of this document with our AI Paraphraser

4
CORPORATE ACCOUNTING
Share capital: It is the face value received from issue of shares of the company. This amount
represent the proportionate right of shareholders in the total ownership of the company (Dhaliwal
et. al. 2014).
Reserves: The combined balance of foreign currency translation reserve, share based payments
reserve, fair value reserve and cash flow hedge reserve is shown in the amount of reserve. Thus,
these are all specific reserves and cannot be used for any other purpose different from te specific
reasons for creation of each reserve (Juárez, 2015).
Retained earnings: The amount of retained earnings is the accumulated balance of profit and loss
account that have left after declaring dividend from profits attributable to equity shareholders
over the years.
Non-controlling interests: It is the amount that represent the equity of minority interests of the
company.
Changes in the amount of equity shown in the table below:
TPG Limited
Amounts are in $ million 31st July, 2017 31st July, 2016 Change % Change
Share capital 1,449.40 1,051.90 397.50 37.79
Reserves (18.10) 41.20 (59.30) (143.93)
Retained earnings 963.30 681.00 282.30 41.45
Equity shareholders' fund 2,394.60 1,774.10 620.50 34.98

5
CORPORATE ACCOUNTING
Non-controlling interests 4.70 5.10 (0.40) (7.84
)
Equity in total 2,399.30 1,779.20 620.10 34.85
The increase in share capital is due to issue of additional shares to the public by TPG Telecom
Limited. The change in reserves amount to negative balance at the end of July 31, 2017 is due to
the huge loss that the company incurred in the year. The retained earnings balance has reduced in
the year because payment of dividend (Lebedeva et. al. 2016).
Telstra Corporation Limited:
In case of owners’ equity of Telstra there is absolutely no difference between the items of
equity as reported by TPG. Thus, Telstra also showed the balances of share capital, reserves,
retained earnings and non-controlling interests. As already a brief discussion about their nature
and characters have been made thus, it is not necessary to explain what these elements represent
in financial statements (Karadag, 2015). However, the changes in the amounts over the previous
year can be analysed below.
Telstra Corporation Limited
Amounts are in $ million 31st
Junly, 2017
31st
July, 2016
C
hange %
Change
Share capital
⊘ This is a preview!⊘
Do you want full access?
Subscribe today to unlock all pages.

Trusted by 1+ million students worldwide

6
CORPORATE ACCOUNTING
4,421.00 5,167.00 (746.00) (14.44)
Reserves
105.00 62.00 43.00 69.35
Retained earnings
10,225.00 10,642.00 (417.00) (3.92)
Equity shareholders' fund
14,751.00 15,871.00
(
1,120.00) (7.06)
Non-controlling interests
19.00 36.00 (17.00) (47.22)
Equity in total
14,770.00 15,907.00
(
1,137.00) (7.15)
The decrease in amount of share capital is mainly due to the buyback of $754 million share
capital of the company. During the year 2016-17. Transfer of huge loss from total compressive
income statement of $165 million is the primary reason for negative balance in reserves of the
company. The retained earnings have not changed significant because the amount of dividend
paid by the company along with share buy-back payments in total were almost identical to the
amount of profit transferred to the retained earnings during the year 2016-17 (Henderson et. al.
2015).
(i) Comparative analysis of debt and equity position:
Paraphrase This Document
Need a fresh take? Get an instant paraphrase of this document with our AI Paraphraser

7
CORPORATE ACCOUNTING
A table containing the balances of equity and debt of the two companies in current as well as
previous year would be helpful to understand the debt and equity positions of the two entities and
how the position has changed within a year (Robinson et. al. 2015).
Comparative analysis of debt to equity position of the two companies
Telstra TPG
31st July,
2017
31st July, 2016 31st July,
2017
31st July,
2016
Total equity 14,560.00 15,907.00 2,399.30 1,779.20
Debt (Long term debt) 14,808.00 14,647.00 872.40 1,350.40
Debt to equity ratio (debt /
equity)
1.02 0.92 0.36 0.76
The debt and equity position of Telstra has deteriorated within a year and it is clear from the debt
to equity ratio of the company. In 2016 the debt to equity ratio of the company was 0.92 which
has deteriorated to 1.02 in 2017. Hence, it is clear that the proportion of debt funds to the overall
capital invested in the business is higher compared to equity fund in 2017 (Macve, 2015).
On the other hand the debt and equity position of TPG has improved significantly in 2017 as the
debt to equity ratio of the company stood at 0.36 compared to 0.76 of 2016.

8
CORPORATE ACCOUNTING
Analysis of cash flow statements of two companies:
(ii) Cash flow statement items and changes in the items:
Operating activities:
Telstra and TPG have reported the amount of cash collected from customers, cash paid to
suppliers. In addition TPG has reported the amount of cash generated from operations whereas
Telstra has reported cash receipts from Government grants and net placement of deposits. Apart
from that both companies have also deducted the amount of income tax paid in cash to ascertain
the net cash generated from operating activities (Patelli and Pedrini, 2015).
Investing activities:
Telstra and TPG has shown the amount of cash used to acquire property, plant and
equipment, intangible assets, payment for acquisition of business, payment for joint ventures and
other investment properties purchased. Cash inflows under investing activities for TPG include
proceeds from disposal of investment properties (Zhang and Andrew, 2014).
Cash flow from financing activities:
Repayments of borrowings is common in both the company. Telstra has also used cash to
buy back its shares whereas TPG has collected cash from issue shares net of issuing costs.
Repayment of principal amount of financial lease is part of financing activities and have been
reported in the cash flow statements of both the companies under financing activities (Dinnie,
2015.
(iii) Comparative analysis of cash flows from three broad categories:
TPG Limited
⊘ This is a preview!⊘
Do you want full access?
Subscribe today to unlock all pages.

Trusted by 1+ million students worldwide

9
CORPORATE ACCOUNTING
Amounts are in $ million 31
st July,
2017
31
st July,
2016
C
hange %
Change
Cash flow from operating activities
722.70 620.40 102.30 16.49
cash flow from investing activities
(457.10)
(
1,488.60) 1,031.50 (69.29)
Cash flow from financing activities
(258.60) 884.00 (1,142.60) (129.25
)
Net change in cash
7.00 15.80 (8.80) (55.70)
From the above table it is clear that the net cash flow generated from operating activities
of TPG Limited has increased in 2017 with $722.70. In 2016 the company generated a net cash
of $620.40 million. Cash used in investing activities in 2017 $457.10 million is again
significantly less compared to the $1488.60 million in 2016. In 2017 the company used $258.60
million in financing activities this is mainly to due to the repayments of borrowings (Cheng et.
al. 2014).
Paraphrase This Document
Need a fresh take? Get an instant paraphrase of this document with our AI Paraphraser

10
CORPORATE ACCOUNTING
Telstra Corporation Limited
Amounts are in $ million 31st
July, 2017
31s
t July, 2016
C
hange %
Change
Cash flow from operating activities
7,775.00 8,133.00 (358.00) (4.40)
cash flow from investing activities
(4,279.00) (2,207.00)
(
2,072.00) 93.88
Cash flow from financing activities
(6,104.00) (3,777.00)
(
2,327.00) 61.61
Net change in cash
(2,608.00) 2,149.00
(
4,757.00) (221.36)
Telstra has generated a net cash of $7,775 million in 2017 compared to $8,133 million in
2016. Thus, there has been significant reduction in cash generation from operating activities of
the company. The company has also spend significantly higher amount in investing activities by
acquiring property, plant and equipment at $4,279 million. In 2016 the company merely use a net
cash of $2,207 million on investing activities. The company has used $6,104 million in net cash
on financing activities that include buy back of shares, repayments of borrowings in 2017. In
contrast the company only used net cash of $3,777 million in financing activities in 2016

11
CORPORATE ACCOUNTING
(Schaltegger and Burritt, 2017). Thus, there has been significant changes in cash flows of the
company in 2017.
(iv) Comparative analysis of two companies:
Let’s have a table containing the net cash generated or used in three board categories of the two
companies over the last three years including 2017. Based on the table a brief discussion shall be
made to compare the cash flow activities of the two companies in recent years (Simnett and
Huggins, 2015).
Comparative analysis
Year 2017 2016 2015
Telstra TPG Telstra TPG Telstra TPG
Cash flow from operating
activities `
7,775.
00
7
22.70
8,1
33.00
62
0.40
8,311.
00
381.
90
cash flow from investing
activities
(4,279.
00)
(45
7.10)
(2,2
07.00)
(1,488.
60)
(5,692.0
0)
(265.
60)
Cash flow from financing
activities
(6,104.
00)
(25
8.60)
(3,7
77.00)
88
4.00
(6,882.0
0)
(116.
90)
The above table clearly shows the significant difference between the size and scale of operations
of the two entities selected in this document, i.e. Telstra and TPG. Telstra’s operating scale is
much larger than that of TPG. Cash flows generated from operating activities in 2017 for Telstra
⊘ This is a preview!⊘
Do you want full access?
Subscribe today to unlock all pages.

Trusted by 1+ million students worldwide
1 out of 27
Related Documents

Your All-in-One AI-Powered Toolkit for Academic Success.
+13062052269
info@desklib.com
Available 24*7 on WhatsApp / Email
Unlock your academic potential
Copyright © 2020–2025 A2Z Services. All Rights Reserved. Developed and managed by ZUCOL.