Corporate Finance Report: AACo Debt and Capital Structure Analysis
VerifiedAdded on  2020/04/01
|7
|1027
|139
Report
AI Summary
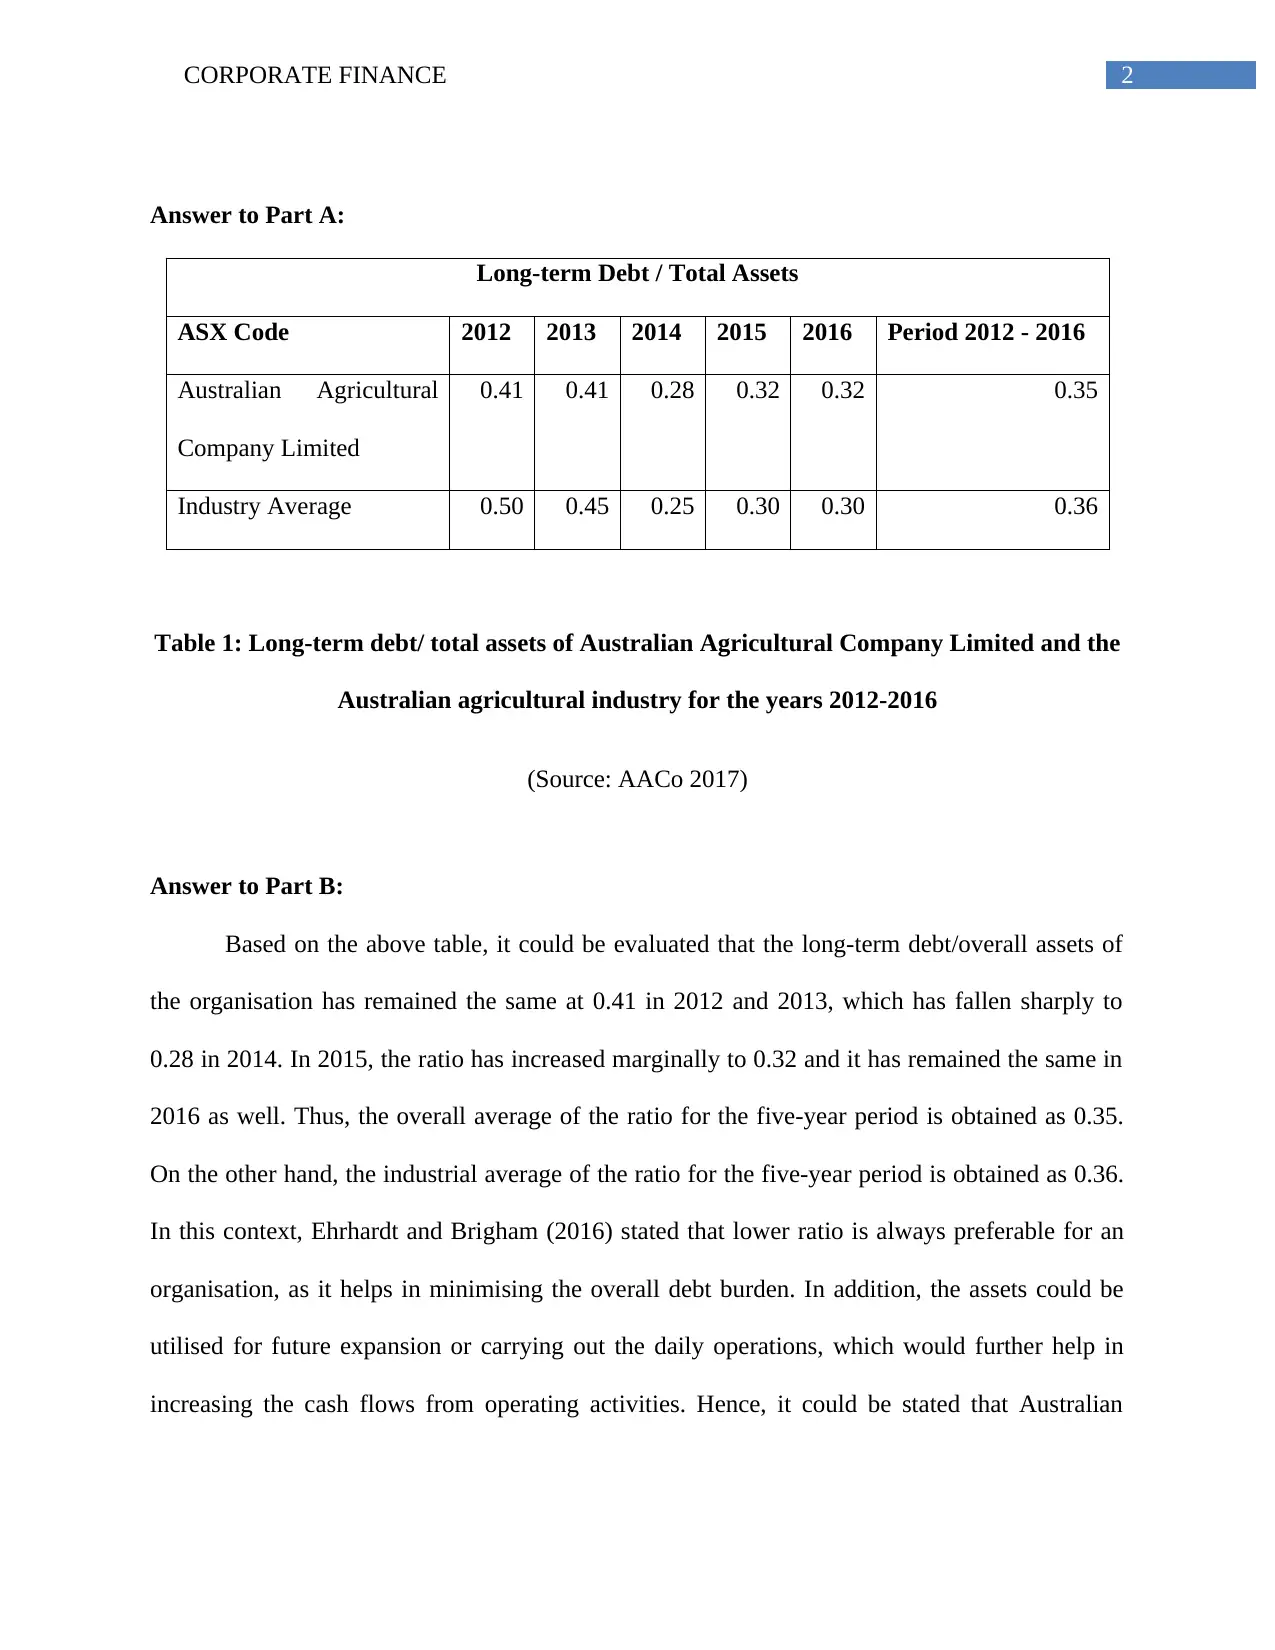
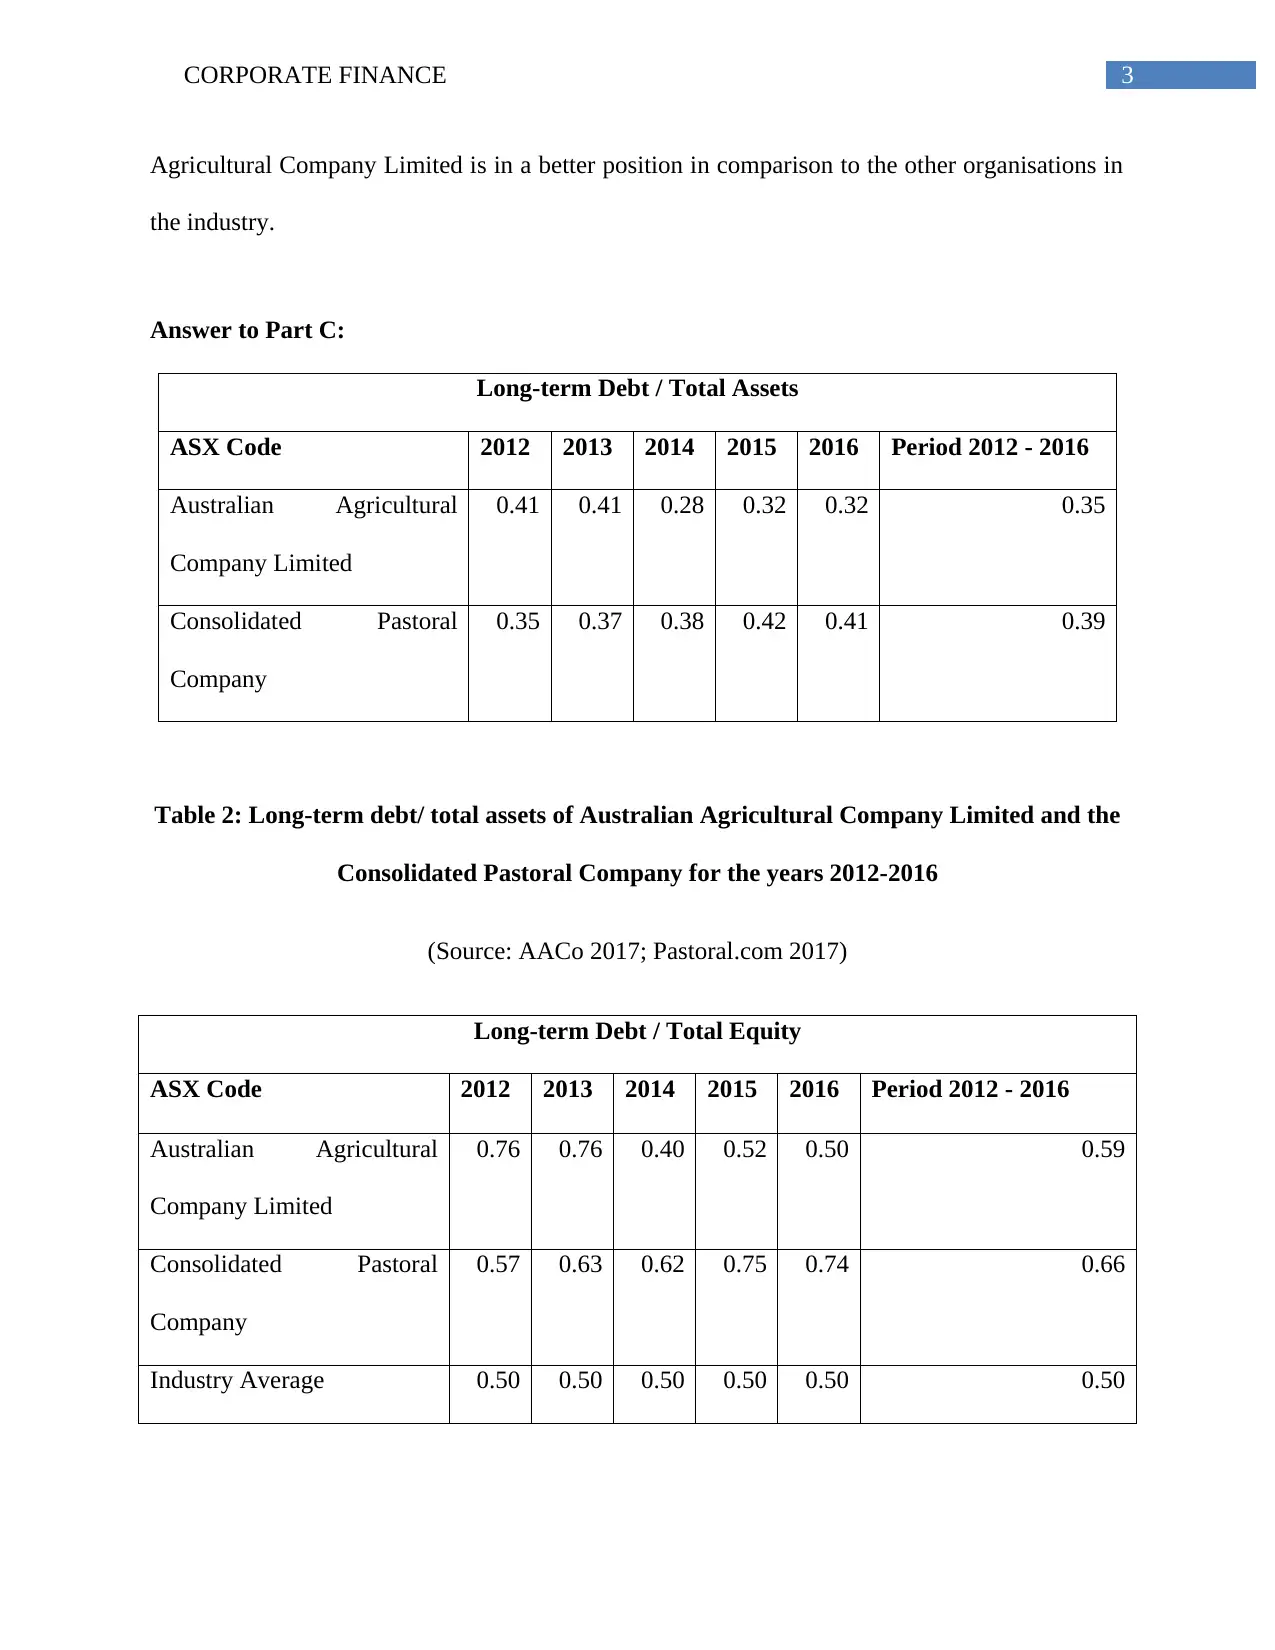
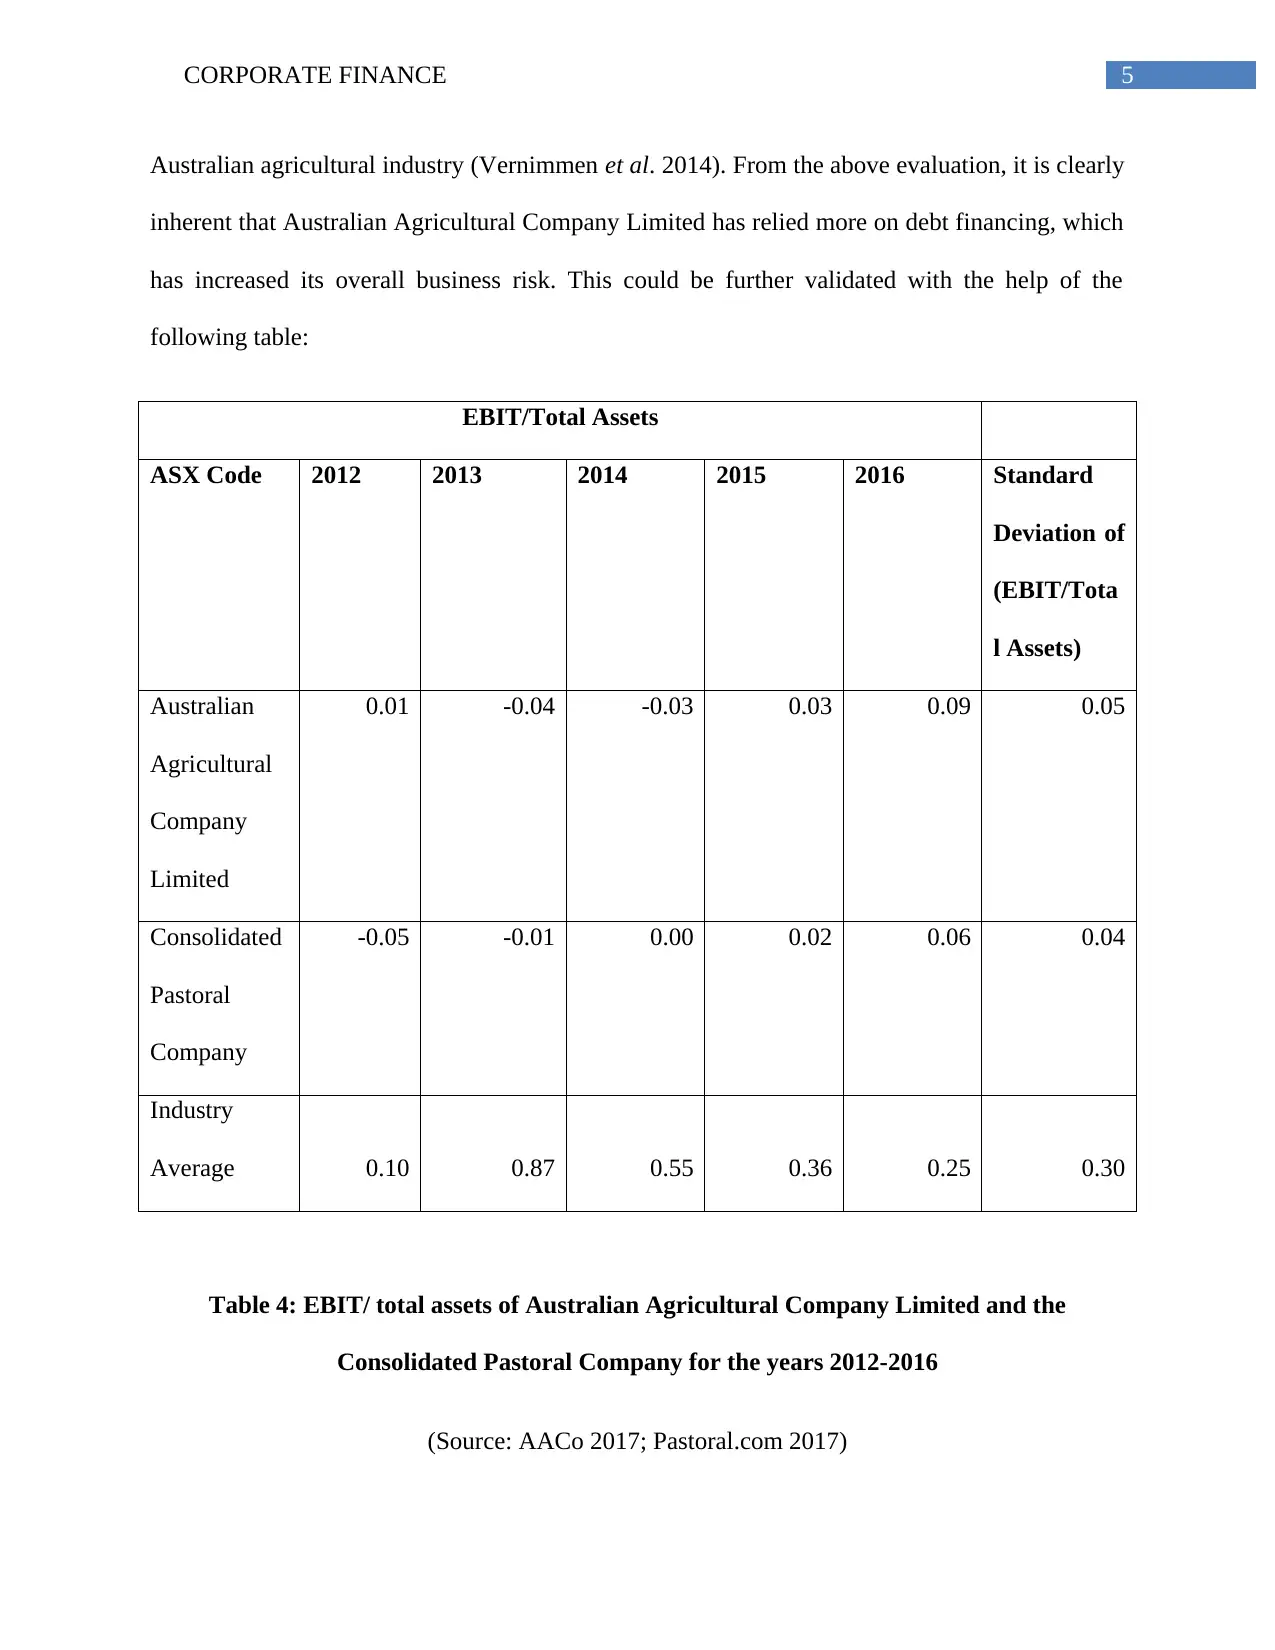
This report presents a corporate finance analysis focusing on the Australian Agricultural Company Limited (AACo) from 2012 to 2016. It examines AACo's long-term debt to total assets ratio, comparing it to industry averages and a competitor, Consolidated Pastoral Company. The analysis includes calculations of debt-to-equity ratios and EBIT/Total Assets, providing insights into AACo's capital structure and financial risk profile. The report evaluates AACo's financial position relative to industry standards and competitors, drawing conclusions about its debt burden, competitive advantages, and overall business risk, referencing key financial concepts and relevant academic sources.

Running head: CORPORATE FINANCE
Corporate Finance
Name of the Student:
Name of the University:
Author’s Note:
Course ID:
Corporate Finance
Name of the Student:
Name of the University:
Author’s Note:
Course ID:
Paraphrase This Document
Need a fresh take? Get an instant paraphrase of this document with our AI Paraphraser

1CORPORATE FINANCE
Table of Contents
Answer to Part A:............................................................................................................................2
Answer to Part B:.............................................................................................................................2
Answer to Part C:.............................................................................................................................3
Answer to Part D:............................................................................................................................4
References:......................................................................................................................................7

2CORPORATE FINANCE
Answer to Part A:
Long-term Debt / Total Assets
ASX Code 2012 2013 2014 2015 2016 Period 2012 - 2016
Australian Agricultural
Company Limited
0.41 0.41 0.28 0.32 0.32 0.35
Industry Average 0.50 0.45 0.25 0.30 0.30 0.36
Table 1: Long-term debt/ total assets of Australian Agricultural Company Limited and the
Australian agricultural industry for the years 2012-2016
(Source: AACo 2017)
Answer to Part B:
Based on the above table, it could be evaluated that the long-term debt/overall assets of
the organisation has remained the same at 0.41 in 2012 and 2013, which has fallen sharply to
0.28 in 2014. In 2015, the ratio has increased marginally to 0.32 and it has remained the same in
2016 as well. Thus, the overall average of the ratio for the five-year period is obtained as 0.35.
On the other hand, the industrial average of the ratio for the five-year period is obtained as 0.36.
In this context, Ehrhardt and Brigham (2016) stated that lower ratio is always preferable for an
organisation, as it helps in minimising the overall debt burden. In addition, the assets could be
utilised for future expansion or carrying out the daily operations, which would further help in
increasing the cash flows from operating activities. Hence, it could be stated that Australian
⊘ This is a preview!⊘
Do you want full access?
Subscribe today to unlock all pages.

Trusted by 1+ million students worldwide

3CORPORATE FINANCE
Agricultural Company Limited is in a better position in comparison to the other organisations in
the industry.
Answer to Part C:
Long-term Debt / Total Assets
ASX Code 2012 2013 2014 2015 2016 Period 2012 - 2016
Australian Agricultural
Company Limited
0.41 0.41 0.28 0.32 0.32 0.35
Consolidated Pastoral
Company
0.35 0.37 0.38 0.42 0.41 0.39
Table 2: Long-term debt/ total assets of Australian Agricultural Company Limited and the
Consolidated Pastoral Company for the years 2012-2016
(Source: AACo 2017; Pastoral.com 2017)
Long-term Debt / Total Equity
ASX Code 2012 2013 2014 2015 2016 Period 2012 - 2016
Australian Agricultural
Company Limited
0.76 0.76 0.40 0.52 0.50 0.59
Consolidated Pastoral
Company
0.57 0.63 0.62 0.75 0.74 0.66
Industry Average 0.50 0.50 0.50 0.50 0.50 0.50
Paraphrase This Document
Need a fresh take? Get an instant paraphrase of this document with our AI Paraphraser

4CORPORATE FINANCE
Table 3: Long-term debt/ total equity of Australian Agricultural Company Limited and the
Consolidated Pastoral Company for the years 2012-2016
(Source: AACo 2017; Pastoral.com 2017)
According to the above tables, the long-term debt/ total asset ratio has been higher in
case of the Consolidated Pastoral Company. This organisation has been selected, as it is the main
competitor of the Australian Agricultural Company Limited in the Australian agriculture
industry. In this case, the ratio is higher for Consolidated Pastoral Company in contrast to the
Australian Agricultural Company Limited. The possible reason is the increasing amount of bank
loans on the part of the former organisation, which has increased its overall debt burden. Hence,
based on the above analysis, it could be stated that Australian Agricultural Company Limited has
been enjoying competitive advantage over Consolidated Pastoral Company in the Australian
market.
In terms of long-term debt/ total equity ratio, there has been fluctuation in case of the
Australian Agricultural Company Limited, while the trend is on the increasing scale for the
Consolidated Pastoral Company. It has been observed that the industrial average has remained
fixed at 0.50. The lower the ratio, the better it is for the organisation in minimising the overall
debt burden (Fracassi 2016). In this case, both the organisations have failed to meet the industrial
standards; however, the position of Australian Agricultural Company Limited is slightly better
compared to that of the Consolidated Pastoral Company.
Answer to Part D:
An optimal capital structure is considered as one, which has an identical debt-to-equity
ratio of 0.5. This denotes that the weights of overall debt and overall equity are 50% each in the

5CORPORATE FINANCE
Australian agricultural industry (Vernimmen et al. 2014). From the above evaluation, it is clearly
inherent that Australian Agricultural Company Limited has relied more on debt financing, which
has increased its overall business risk. This could be further validated with the help of the
following table:
EBIT/Total Assets
ASX Code 2012 2013 2014 2015 2016 Standard
Deviation of
(EBIT/Tota
l Assets)
Australian
Agricultural
Company
Limited
0.01 -0.04 -0.03 0.03 0.09 0.05
Consolidated
Pastoral
Company
-0.05 -0.01 0.00 0.02 0.06 0.04
Industry
Average 0.10 0.87 0.55 0.36 0.25 0.30
Table 4: EBIT/ total assets of Australian Agricultural Company Limited and the
Consolidated Pastoral Company for the years 2012-2016
(Source: AACo 2017; Pastoral.com 2017)
⊘ This is a preview!⊘
Do you want full access?
Subscribe today to unlock all pages.

Trusted by 1+ million students worldwide

6CORPORATE FINANCE
From the above table, it could be seen that the organisation has less risk in the market in
contrast to the other organisations in the industry; however, the risk margin is slightly lower for
the Consolidated Pastoral Company.
From the above table, it could be seen that the organisation has less risk in the market in
contrast to the other organisations in the industry; however, the risk margin is slightly lower for
the Consolidated Pastoral Company.
1 out of 7
Related Documents

Your All-in-One AI-Powered Toolkit for Academic Success.
 +13062052269
info@desklib.com
Available 24*7 on WhatsApp / Email
Unlock your academic potential
Copyright © 2020–2025 A2Z Services. All Rights Reserved. Developed and managed by ZUCOL.