Corporate Finance Assignment: Rio Tinto Group CAPM and Dividend Policy
VerifiedAdded on 2022/08/14
|27
|4485
|20
Report
AI Summary
This report provides a comprehensive analysis of the Rio Tinto Group's financial performance, focusing on the application of the Capital Asset Pricing Model (CAPM) to determine the cost of equity. It calculates the cost of equity, ungears the equity beta to derive the asset beta, and examines the company's dividend policy over the past five years using relevant ratios. The report also critically evaluates the suitability of the CAPM-derived cost of equity for investment appraisal, comparing it to the Dividend Growth Model. The analysis includes detailed calculations, justifications for data choices, and a discussion of the implications of the findings for Rio Tinto's financial management and investment decisions. The report also considers the company's dividend payout ratio and its implications for future investments and shareholder value. This analysis is crucial for understanding the financial health and investment potential of Rio Tinto.

Running head: CORPORATE FINANCE 1
Rio Tinto Group CAPM and dividend policy models
Name of the student
Institutional affiliation
Date
Rio Tinto Group CAPM and dividend policy models
Name of the student
Institutional affiliation
Date
Paraphrase This Document
Need a fresh take? Get an instant paraphrase of this document with our AI Paraphraser
CORPORATE FINANCE 2
Introduction
The paper is an assessment regarding the financial aspects of the capital asset pricing
model together with the dividend policy model of a firm. As required, the selected company for
making the analysis is known as Rio Tinto Group. Briefly, Rio Tinto is an Anglo-Australian
multinational entity dealing mining and metals. The company also has its headquarters located
in the United Kingdom, London and it is also listed on the London stock exchange as RIO
(ASX). Therefore, for the purposes of making the CAPM analyses Rio Tinto will be used as the
case study. The structure of the paper comprises of four main sections in which all the required
assessments are provided. For instance in the first section of the paper, calculations regarding
the CAPM are provided. Besides the calculations, the section also includes other elaborate
explanations about the various aspects of CAPM.
The capital asset pricing model refers to a financial approach through which the
relationship between systematic risk and expected returns is analyzed. Majorly, the technique is
used to evaluate stock returns hence its applicability to the selected company of choice.
Primarily, investors and stock holders use the capital asset pricing model to forecast the required
rate of return of any given stock or asset. To effectively make such forecasts of the expected
return, three major factors are put into play. These include the risk free rate of the stock, the
expected market return and the beta value of the asset. Regarding the riot into group, the Capital
Asset Pricing Model is calculated as below with consideration of all the above mentioned
factors:
A): Calculating The Company’s Current Cost of Equity Using the Capital Asset Pricing
Model
CORPORATE FINANCE 3
As previously mentioned, the capital asset pricing model a measure used to determine
and assess the expected return of an asset, security or stock. In the financial market different
securities have varying levels of risk attached. Due to such a scenario investors are tend to draw
closer attention to the risks associated with particular stocks or assets on the market. Some of the
stocks are highly risky whereas others have low levels of risks attached. It should however be
noted that the highly risky securities also have high levels of return (Boyte-White, 2020). On the
other hand, assets that have low risks have low returns as well. Therefore, to determine the
riskiness of an asset, investors apply the Capital asset pricing model.
On the other hand however, public listed companies seek to raise capital by issuing out
shares on the stock market. It is such a factor that gives rise to the concept of cost of equity of a
firm. Under normal circumstances, a public listed entity uses two main sources of capital and
these include the debt finance ordinary share financing. Therefore where an entity opts to use
equity financing, then this give s rise to the cost of equity. Alternatively, the cost of equity is
also known as the expected return on an investment especially for the shareholder. When using
the capital asset pricing model, the cost of equity also represents the current cost of equity of a
firm. Since the investor or ordinary share holder aims at generating returns, the company is
deemed to declare dividends. It is these dividends that are characterized as the cost of equity.
The capital asset pricing (CAPM) is therefore given by the formula stated as:
E (r) =r f + β ¿ ¿)
According to the above formula, E(r) is the known as the expected return of an asset. r f
on the other hand represents the risk free rate of the asset or stock. The β factor on the other
⊘ This is a preview!⊘
Do you want full access?
Subscribe today to unlock all pages.
Trusted by 1+ million students worldwide
CORPORATE FINANCE 4
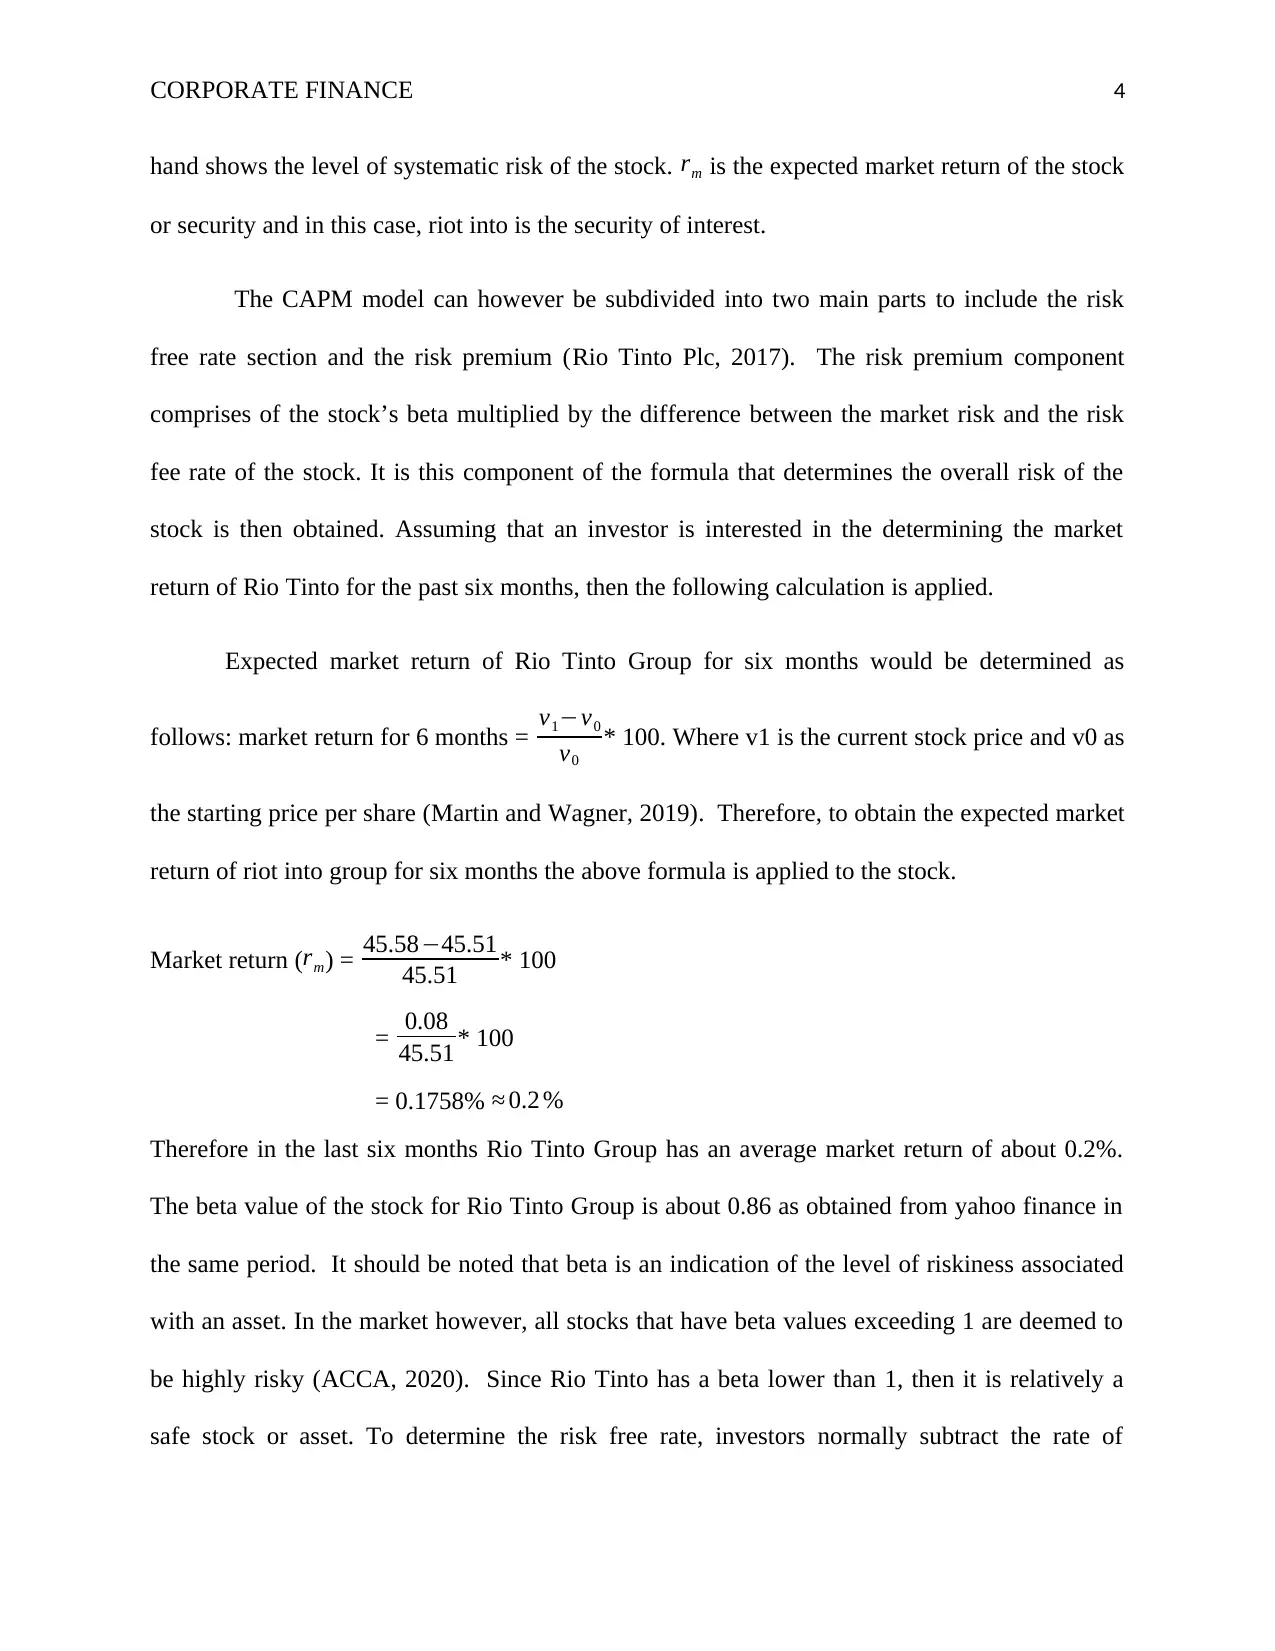
hand shows the level of systematic risk of the stock. rm is the expected market return of the stock
or security and in this case, riot into is the security of interest.
The CAPM model can however be subdivided into two main parts to include the risk
free rate section and the risk premium (Rio Tinto Plc, 2017). The risk premium component
comprises of the stock’s beta multiplied by the difference between the market risk and the risk
fee rate of the stock. It is this component of the formula that determines the overall risk of the
stock is then obtained. Assuming that an investor is interested in the determining the market
return of Rio Tinto for the past six months, then the following calculation is applied.
Expected market return of Rio Tinto Group for six months would be determined as
follows: market return for 6 months = v1−v0
v0
* 100. Where v1 is the current stock price and v0 as
the starting price per share (Martin and Wagner, 2019). Therefore, to obtain the expected market
return of riot into group for six months the above formula is applied to the stock.
Market return (rm) = 45.58−45.51
45.51 * 100
= 0.08
45.51 * 100
= 0.1758% ≈ 0.2 %
Therefore in the last six months Rio Tinto Group has an average market return of about 0.2%.
The beta value of the stock for Rio Tinto Group is about 0.86 as obtained from yahoo finance in
the same period. It should be noted that beta is an indication of the level of riskiness associated
with an asset. In the market however, all stocks that have beta values exceeding 1 are deemed to
be highly risky (ACCA, 2020). Since Rio Tinto has a beta lower than 1, then it is relatively a
safe stock or asset. To determine the risk free rate, investors normally subtract the rate of
Paraphrase This Document
Need a fresh take? Get an instant paraphrase of this document with our AI Paraphraser
CORPORATE FINANCE 5
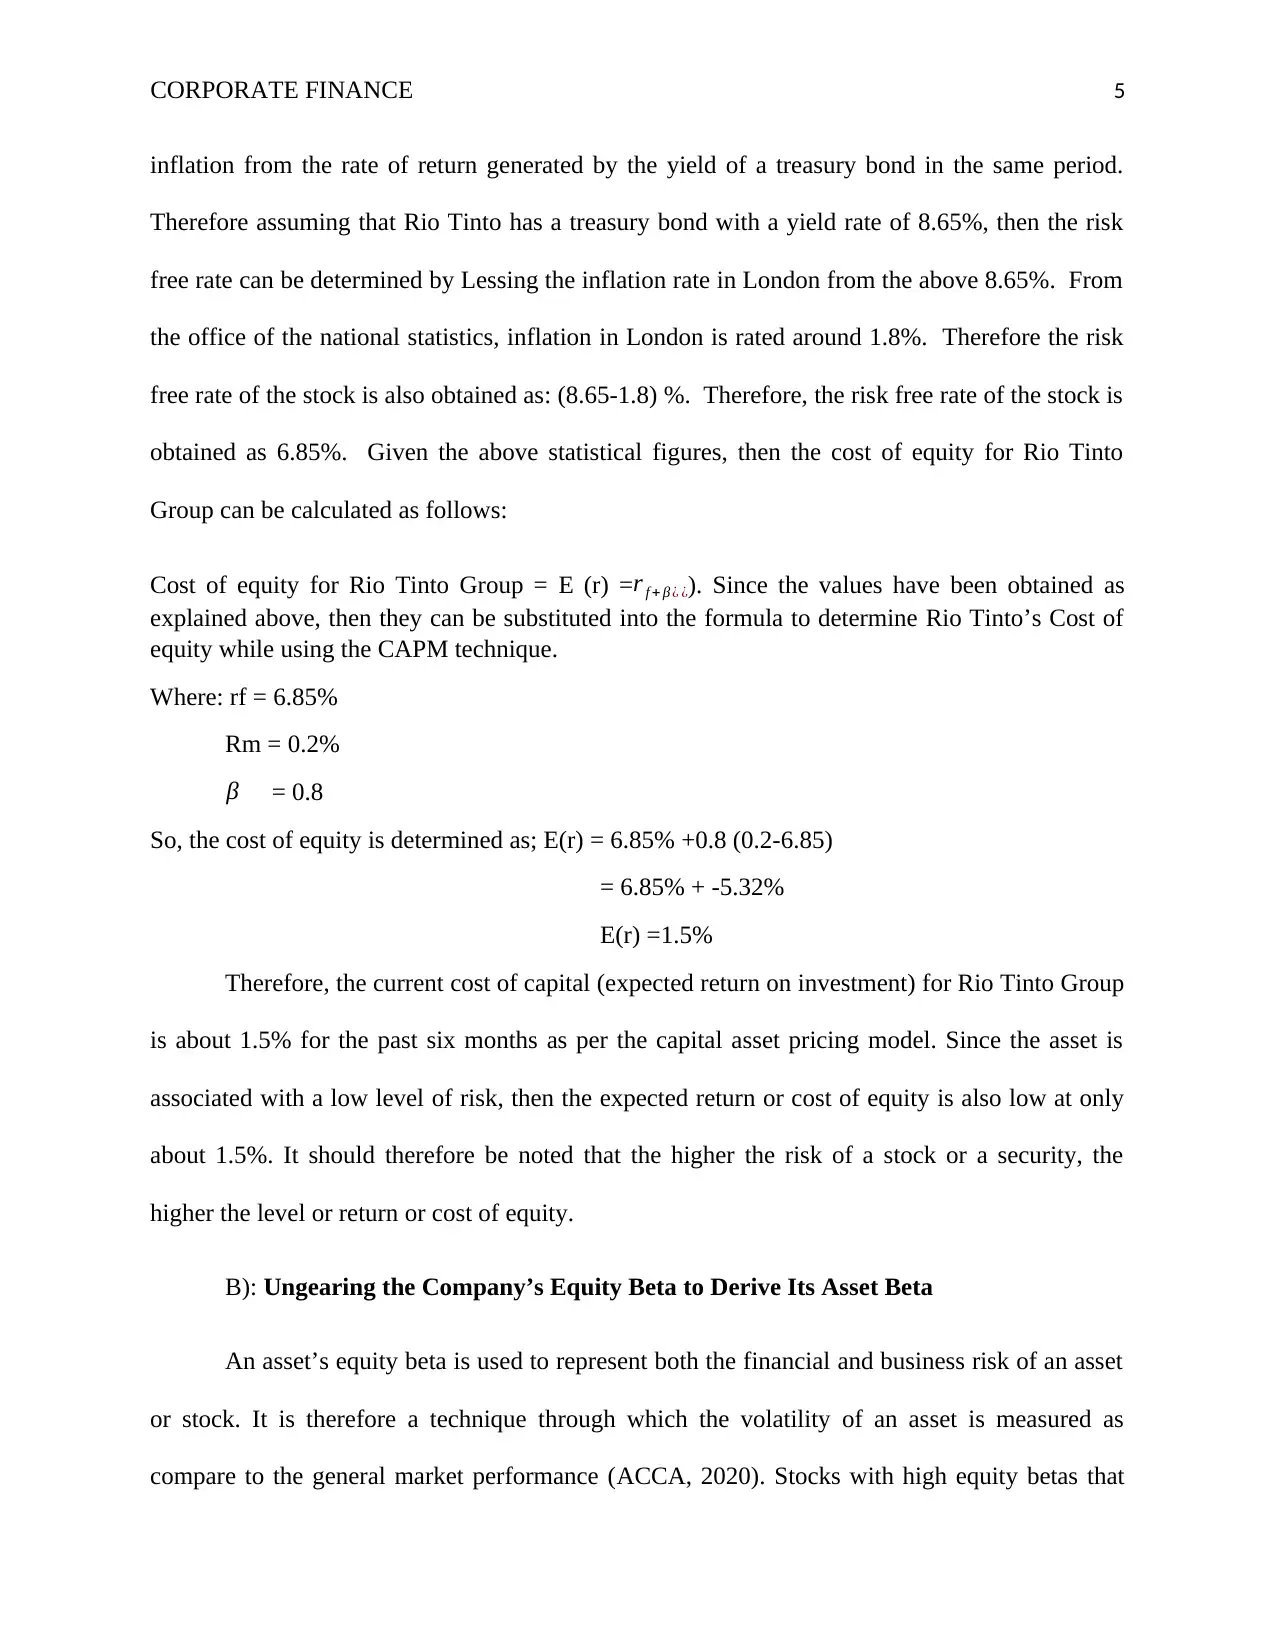
inflation from the rate of return generated by the yield of a treasury bond in the same period.
Therefore assuming that Rio Tinto has a treasury bond with a yield rate of 8.65%, then the risk
free rate can be determined by Lessing the inflation rate in London from the above 8.65%. From
the office of the national statistics, inflation in London is rated around 1.8%. Therefore the risk
free rate of the stock is also obtained as: (8.65-1.8) %. Therefore, the risk free rate of the stock is
obtained as 6.85%. Given the above statistical figures, then the cost of equity for Rio Tinto
Group can be calculated as follows:
Cost of equity for Rio Tinto Group = E (r) =r f + β ¿ ¿). Since the values have been obtained as
explained above, then they can be substituted into the formula to determine Rio Tinto’s Cost of
equity while using the CAPM technique.
Where: rf = 6.85%
Rm = 0.2%
β = 0.8
So, the cost of equity is determined as; E(r) = 6.85% +0.8 (0.2-6.85)
= 6.85% + -5.32%
E(r) =1.5%
Therefore, the current cost of capital (expected return on investment) for Rio Tinto Group
is about 1.5% for the past six months as per the capital asset pricing model. Since the asset is
associated with a low level of risk, then the expected return or cost of equity is also low at only
about 1.5%. It should therefore be noted that the higher the risk of a stock or a security, the
higher the level or return or cost of equity.
B): Ungearing the Company’s Equity Beta to Derive Its Asset Beta
An asset’s equity beta is used to represent both the financial and business risk of an asset
or stock. It is therefore a technique through which the volatility of an asset is measured as
compare to the general market performance (ACCA, 2020). Stocks with high equity betas that
CORPORATE FINANCE 6
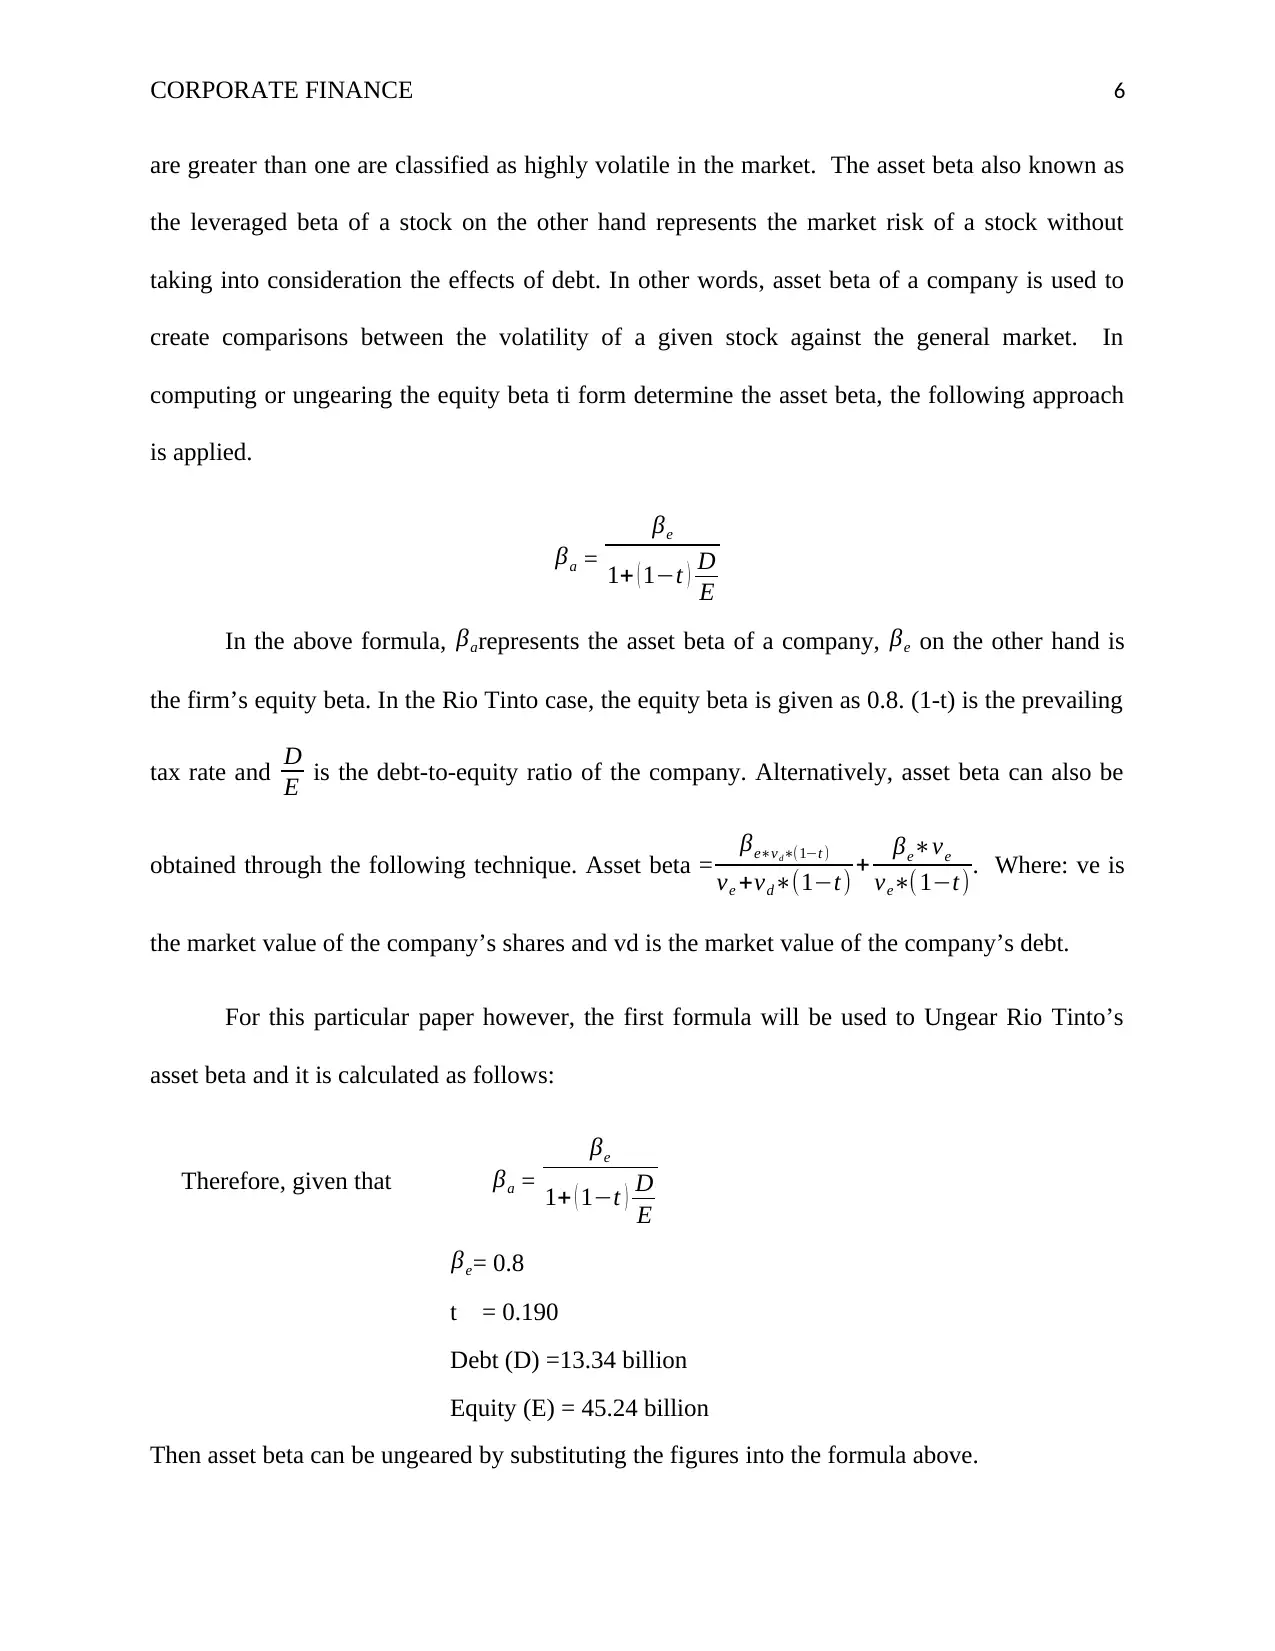
are greater than one are classified as highly volatile in the market. The asset beta also known as
the leveraged beta of a stock on the other hand represents the market risk of a stock without
taking into consideration the effects of debt. In other words, asset beta of a company is used to
create comparisons between the volatility of a given stock against the general market. In
computing or ungearing the equity beta ti form determine the asset beta, the following approach
is applied.
βa =
βe
1+ ( 1−t ) D
E
In the above formula, βarepresents the asset beta of a company, βe on the other hand is
the firm’s equity beta. In the Rio Tinto case, the equity beta is given as 0.8. (1-t) is the prevailing
tax rate and D
E is the debt-to-equity ratio of the company. Alternatively, asset beta can also be
obtained through the following technique. Asset beta = βe∗vd∗(1−t )
ve +vd∗(1−t) + βe∗ve
ve∗(1−t). Where: ve is
the market value of the company’s shares and vd is the market value of the company’s debt.
For this particular paper however, the first formula will be used to Ungear Rio Tinto’s
asset beta and it is calculated as follows:
Therefore, given that βa =
βe
1+ ( 1−t ) D
E
βe= 0.8
t = 0.190
Debt (D) =13.34 billion
Equity (E) = 45.24 billion
Then asset beta can be ungeared by substituting the figures into the formula above.
⊘ This is a preview!⊘
Do you want full access?
Subscribe today to unlock all pages.
Trusted by 1+ million students worldwide
CORPORATE FINANCE 7
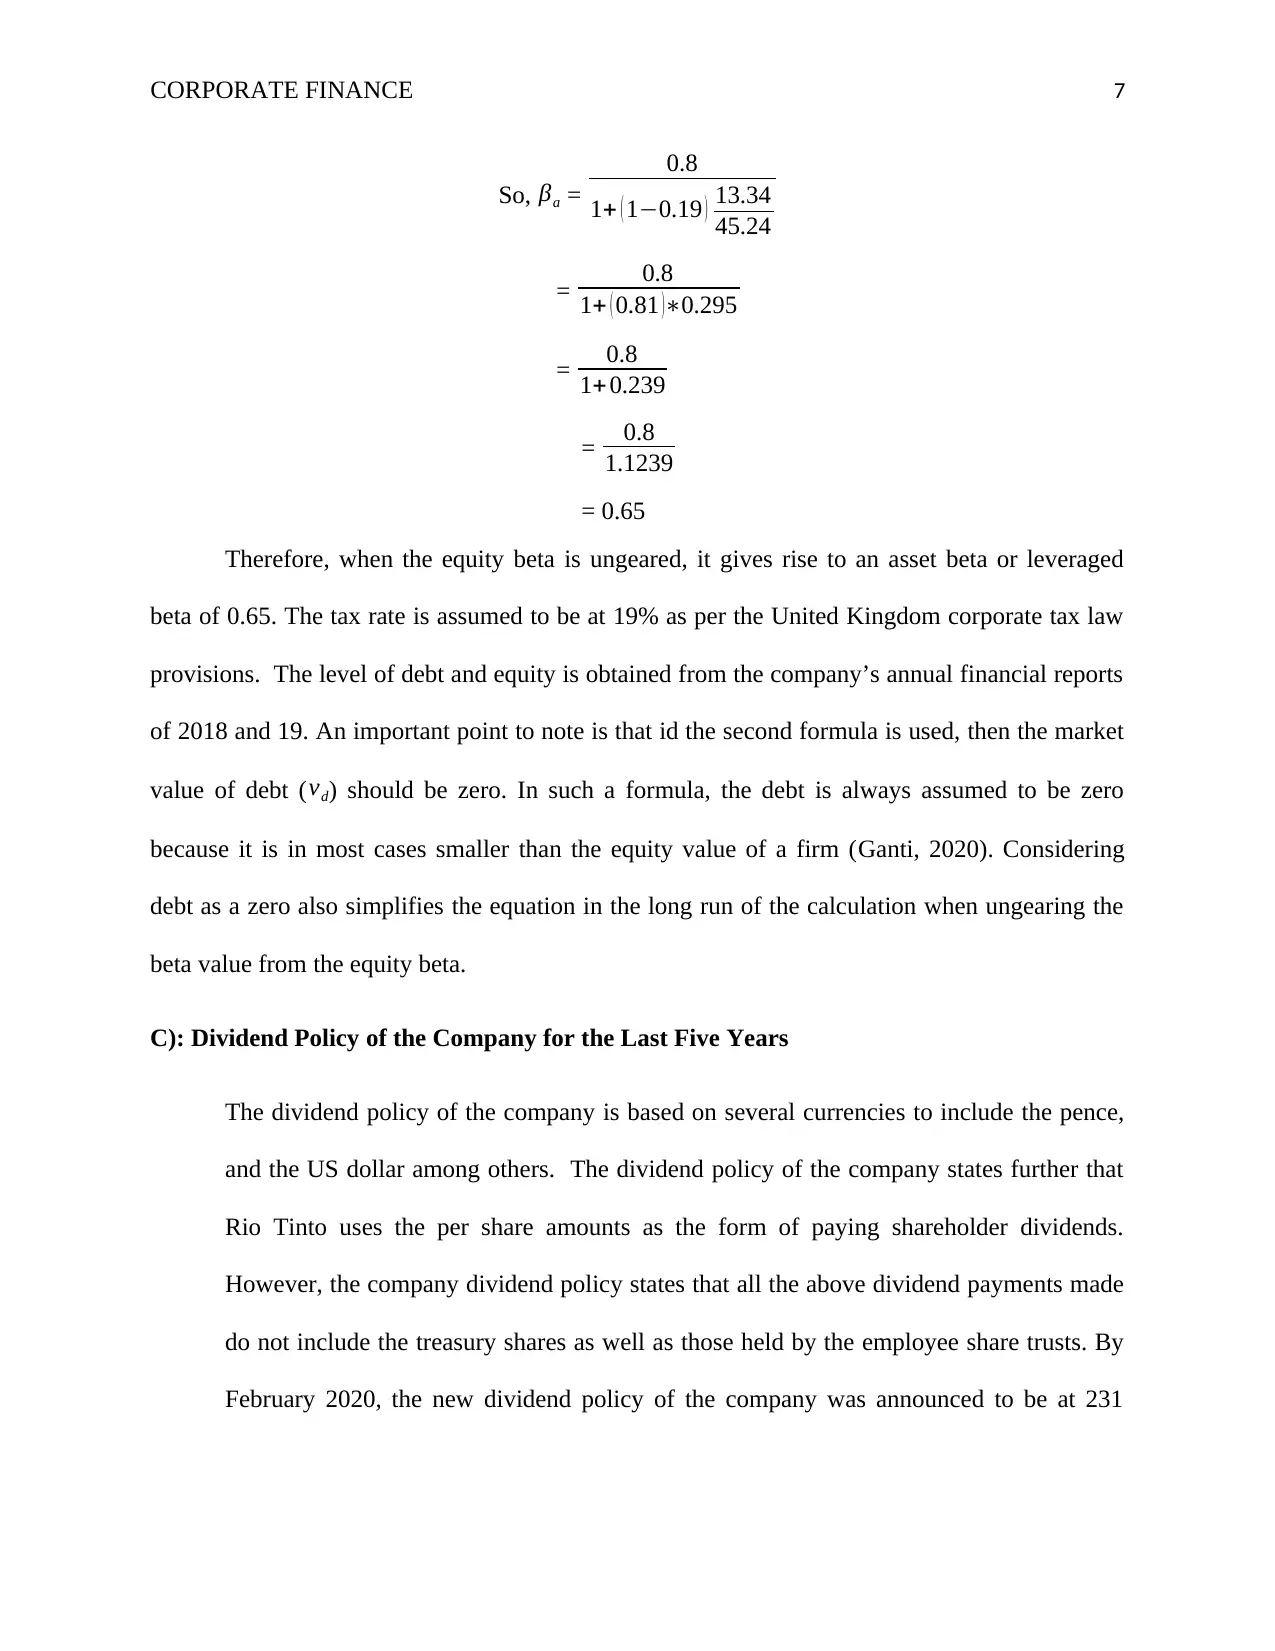
So, βa =
0.8
1+ ( 1−0.19 ) 13.34
45.24
= 0.8
1+ ( 0.81 )∗0.295
= 0.8
1+ 0.239
= 0.8
1.1239
= 0.65
Therefore, when the equity beta is ungeared, it gives rise to an asset beta or leveraged
beta of 0.65. The tax rate is assumed to be at 19% as per the United Kingdom corporate tax law
provisions. The level of debt and equity is obtained from the company’s annual financial reports
of 2018 and 19. An important point to note is that id the second formula is used, then the market
value of debt ( vd) should be zero. In such a formula, the debt is always assumed to be zero
because it is in most cases smaller than the equity value of a firm (Ganti, 2020). Considering
debt as a zero also simplifies the equation in the long run of the calculation when ungearing the
beta value from the equity beta.
C): Dividend Policy of the Company for the Last Five Years
The dividend policy of the company is based on several currencies to include the pence,
and the US dollar among others. The dividend policy of the company states further that
Rio Tinto uses the per share amounts as the form of paying shareholder dividends.
However, the company dividend policy states that all the above dividend payments made
do not include the treasury shares as well as those held by the employee share trusts. By
February 2020, the new dividend policy of the company was announced to be at 231
Paraphrase This Document
Need a fresh take? Get an instant paraphrase of this document with our AI Paraphraser
CORPORATE FINANCE 8
cents per share. The policy also provides all dividend payments will be franked from the
present franking credits coming from income tax payments
(Financial Times, 2019). When assessing the company’s dividend policy in the last
five years, relevant ratios such as the payout ratio are applied. The dividend payout ratio
refers to the fraction of the net income earned by a company that is paid out to shareholders
(Rio Tinto Group, 2019). It is also worth noting that the portion of net income that is left
unpaid is used for future investments of the business entity (Rio Tinto Group, 2019).
Companies that have high growth potential normally have low payout ratios. On the other
therefore, the companies with low growth levels are associated with high payout ratios since
much of their earnings are paid in form of dividends (Rio Tinto Group, 2018). In summary
therefore, a company’s payout ratio reflects the portion income that is paid out to
shareholders especially the ordinary shareholders (Bojan, 2013). Mathematically, the
dividend payout ratio of an entity can be determined as: dividend payout ratio = (dividends
per share/earnings per share).
Alternatively, the dividend payout ratio of any given company can be determined by
dividing the total amount paid in form of dividends by the net income in a given period.
Mathematically it is stated as: dividend payout ratio = (total dividends paid/net income). For
the Rio Tinto group it is such a formula can also be used to determine its payout ratio for the
last five years (Burton and Lewis, 2018). In 2019 for instance, the company’s payout ratio
was estimated at about 69.7% which is approximately 70%. From the formula, the
company’s dividend payout ratio = (dividends per/earnings per share)
= (443 cents/636 cents)
= (0.697 ≈ 0.7)* 100
CORPORATE FINANCE 9
= 70%
Therefore, according to the calculation, the company’s payout ratio is over 50%
implying that Rio Tinto group has sufficient earnings to cover its dividend payments.
On average, in the last five years the company has also registered a trailing twelve-
month payout ratio of about 58.59%.
D) A Critical Evaluation Of CAPM And The Dividend Growth Model For Rio Tinto
Group
For an investor to effectively manage a security or a portfolio of stocks, an investor
has to critically evaluate the factors and aspects. Due to such a condition, the need to evaluate
an asset with various approaches. The dividend growth model and the capital asset pricing
model are some of the common methods through which an investment can be assessed.
Unlike the Capital Asset Pricing Model, the dividend growth model primarily focuses on the
amount of dividends that can be generated from a particular stock (Corporate Finance
Institute, 2020). The capital asset pricing model on the other hand emphasizes other external
factors such as risk and rate of return that of an asset. For the Rio Tinto Group therefore, the
both techniques are critically important. Therefore, it is important to note that investors are
more interested in the return that an asset can bring. Therefore, to attract such investors Rio
Tinto needs to apply the dividend growth model.
On the other hand however, the capital asset pricing model is also a significant
technique for the company. Since Rio Tinto Group is a public listed entity, there evaluate its
market performance against the general market average. Ultimately the need to apply the
CAPM is inevitable for the company of Rio Tinto Group. Therefore, the student takes the
⊘ This is a preview!⊘
Do you want full access?
Subscribe today to unlock all pages.
Trusted by 1+ million students worldwide
CORPORATE FINANCE 10
stand that both the dividend growth model and the capital asset pricing model are
significantly important for the company (Ker, 2016). The decision to use only one technique
has several underlying adverse outcomes that have the potential to negatively impact
business. The dividend growth model of the company is applicable is critical when
ascertaining the stock shares depending on the company’s future dividends (Martin, 2016).
Therefore, by using the dividend growth model, Rio Tinto Group can ably determine its
dividend value for the future periods. It has to be noted however that such future projections
can only be applicable for five years. Beyond such a period the company is then deemed to
less detailed projections. The mathematical formula of the model is then applied and the
future values of the company’s dividends. Discounting such future dividends will then be
used as a way of determining the present value of the company (Team, 2019).
The capital asset pricing model approach on the other hand is suitable for purposes of
analyzing the market conditions. With the capital asset pricing model, decision making takes
a broader perspective which includes the market risk, risk free rate the beta factor and the
expected cost of capital. Since the model allows comparisons between the company
performance against the market average return (Pan, 2020). The most outstanding benefit of
using the capital asset pricing model is that an investor or the company can easily assess the
riskiness of the stock on the market. In a broader perspective, the capital asset pricing model
is a slightly more applicable than the dividend growth model.
Because the capital asset pricing model provides a detailed view of the entity, the
investment appraisal estimates are more reliable than the dividend payout ratio estimates.
Most investors put significant emphasis on matters of risk and yet the dividend growth model
Paraphrase This Document
Need a fresh take? Get an instant paraphrase of this document with our AI Paraphraser
CORPORATE FINANCE 11
does not reflect such scenarios (Nel, 2011). Therefore, analyzing the investment appraisal
process while using the dividend growth model is to a certain level unreliable.
On the contrary however, none of the two methods of investment appraisal techniques
is perfect. The fact that both approaches depend on various assumptions regarding the future,
the estimates are always subjected to flaws and errors (Kenton, 2019). In order to predict
long term investment, an entity has to forecast a dividend policy of over five or ten years
ahead. In the real life of investment such predictions are not realistic due to the numerous
uncertainties in the market. The capital asset pricing model on the other hand does not take
into consideration factors such as unsystematic risks. The unsystematic risks in such a sense
represent those risks that occur in a particular industry or type of market alone. Therefore, for
companies that are highly specialized such as the Rio Tinto Group, the capital asset pricing
model may not be highly reliable (Toms, 2012).
In the financial market, daily information and data is associated with several non-
trading periods and such a situation results in an inaccurate systematic risk as used by the
capital asset pricing model. In most cases, the full effect resulting from new market
information is in most cases not immediately reflected in the share prices of the stock or
security. Such a tendency is due to the fact there are significant delays in adjusting stock
prices Coffie and Chukwulobelu, 2012). For instance, in the mining industry price changes
for mineral assets or stocks take long periods before reacting to the prevailing information
and market data. Consequently, when an investor uses short return interval the systematic
risks in the model are erroneous. It is therefore very advisable to use the long term return
interval such as monthly intervals, six-month intervals among others (Nhleko and
Musingwini, 2016). The long term intervals are help in reducing the price adjustment biases.
CORPORATE FINANCE 12
Therefore, as earlier stated, the capital asset pricing model is a relatively better investment
appraisal approach for the Rio Tinto Group.
Conclusion
The capital asset pricing model is the most commonly used approach for determining the
cost of equity for the public listed companies. Several investors find the model’s return and risk
factors very intuitive in investment practices. Although there is still limited research supporting
the application of the technique, the capital asset pricing model is strongly backed theoretically.
On the other, the dividend growth model of investment appraisal is considered as the easiest
approach for valuing a stock or an asset. To determine the present value of a particular stock, the
model only requires an individual to discount down all the future dividend payments. The
growth of a company is therefore estimated to follow a constant infinite rate and trend (Nhleko,
2015).It is however, limited by the fact that there is no significant evidence supporting the
constant growth infinite growth rate in of dividends. Therefore, it is largely advisable for Rio
Tinto Group to use a combination of the two types of investment appraisal techniques. Relying
on a single method can significantly affect the overall performance of the company especially in
cases of critical uncertainties (Piplovic, 2018).The dividend growth model allows the company to
ascertain the dividends as well as measuring the company’s growth. The capital asset pricing
model on the other hand is then used to determine and asses underlying factors such as
systematic risk and expected return.
⊘ This is a preview!⊘
Do you want full access?
Subscribe today to unlock all pages.
Trusted by 1+ million students worldwide
1 out of 27
Related Documents


Your All-in-One AI-Powered Toolkit for Academic Success.
+13062052269
info@desklib.com
Available 24*7 on WhatsApp / Email
![[object Object]](/_next/static/media/star-bottom.7253800d.svg)
Unlock your academic potential
Copyright © 2020–2026 A2Z Services. All Rights Reserved. Developed and managed by ZUCOL.