Corporate Finance: Risk Calculation and Portfolio Investment Analysis

Verified

Added on  2020/03/16

|5
|770
|53
Homework Assignment
AI Summary
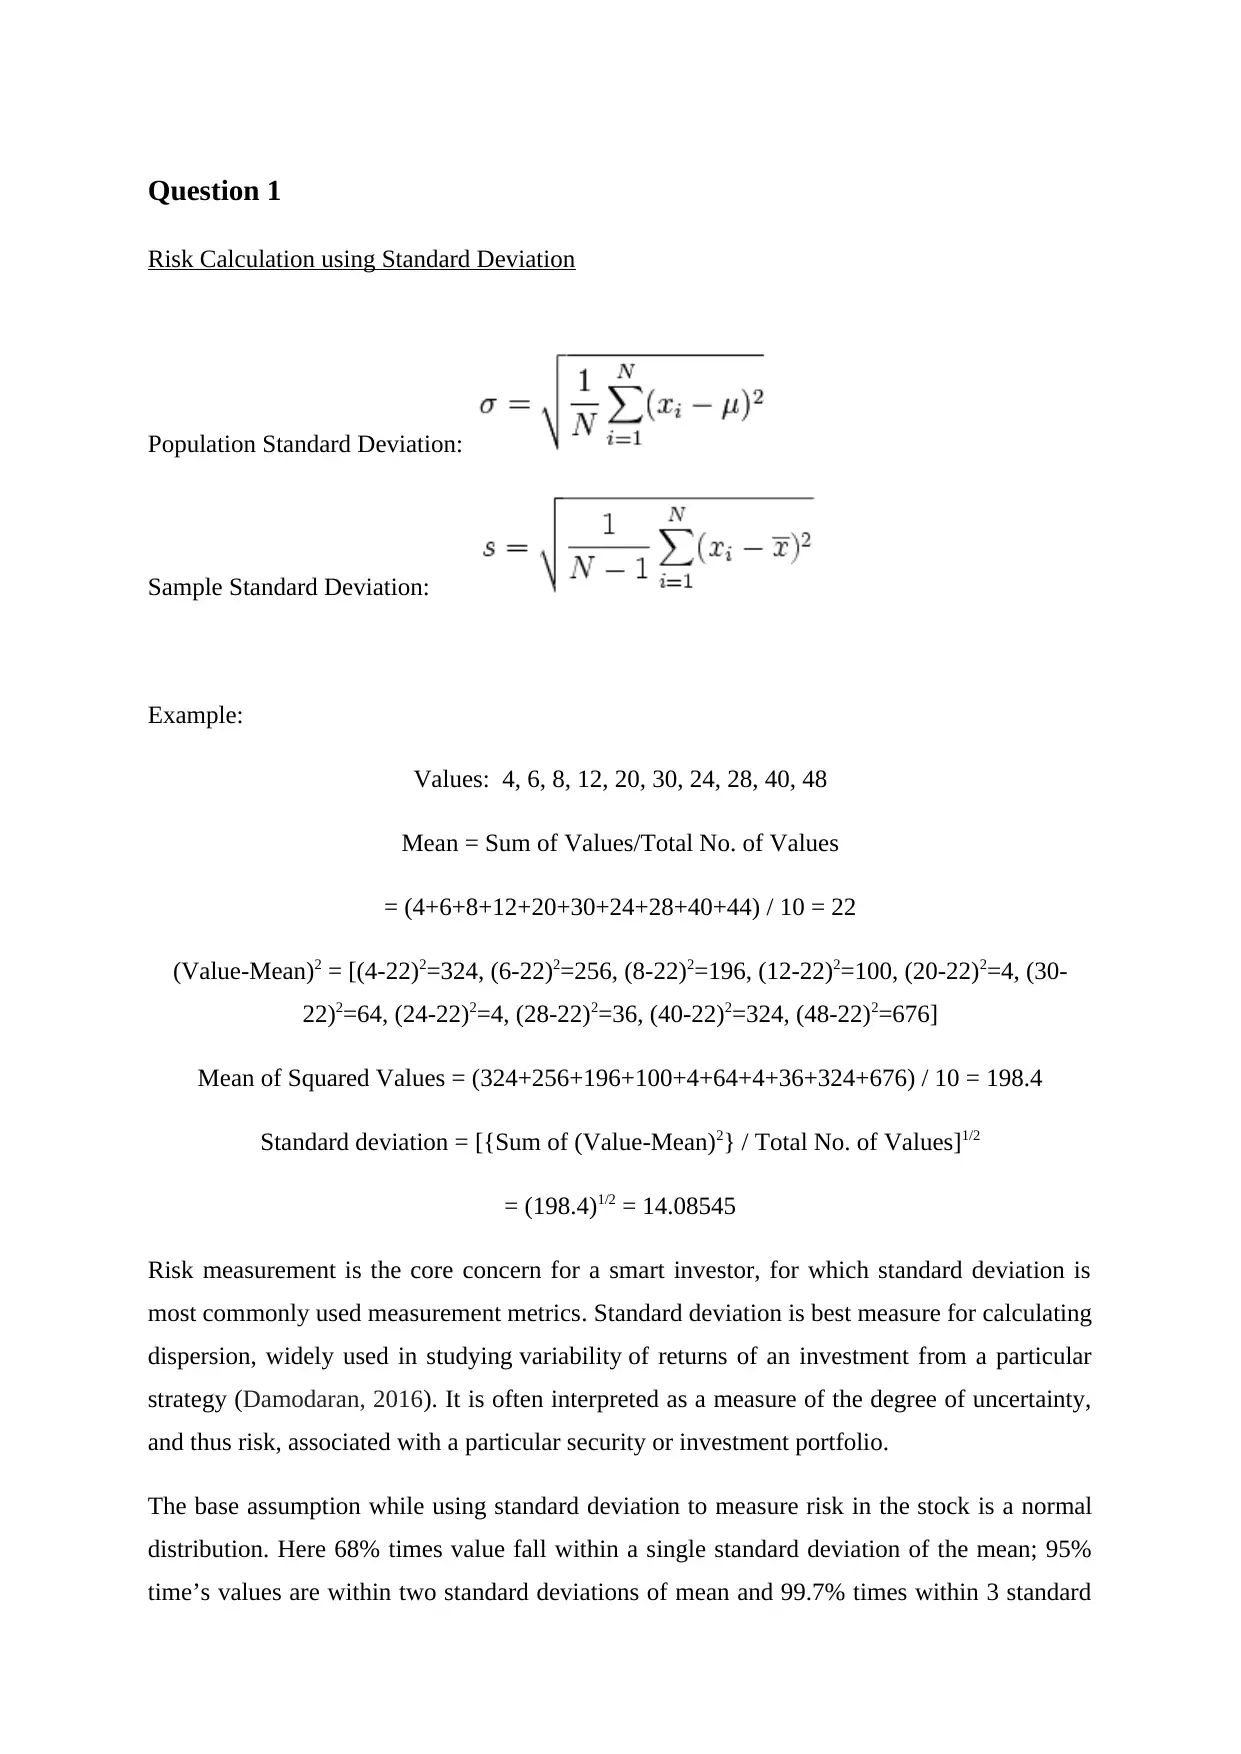
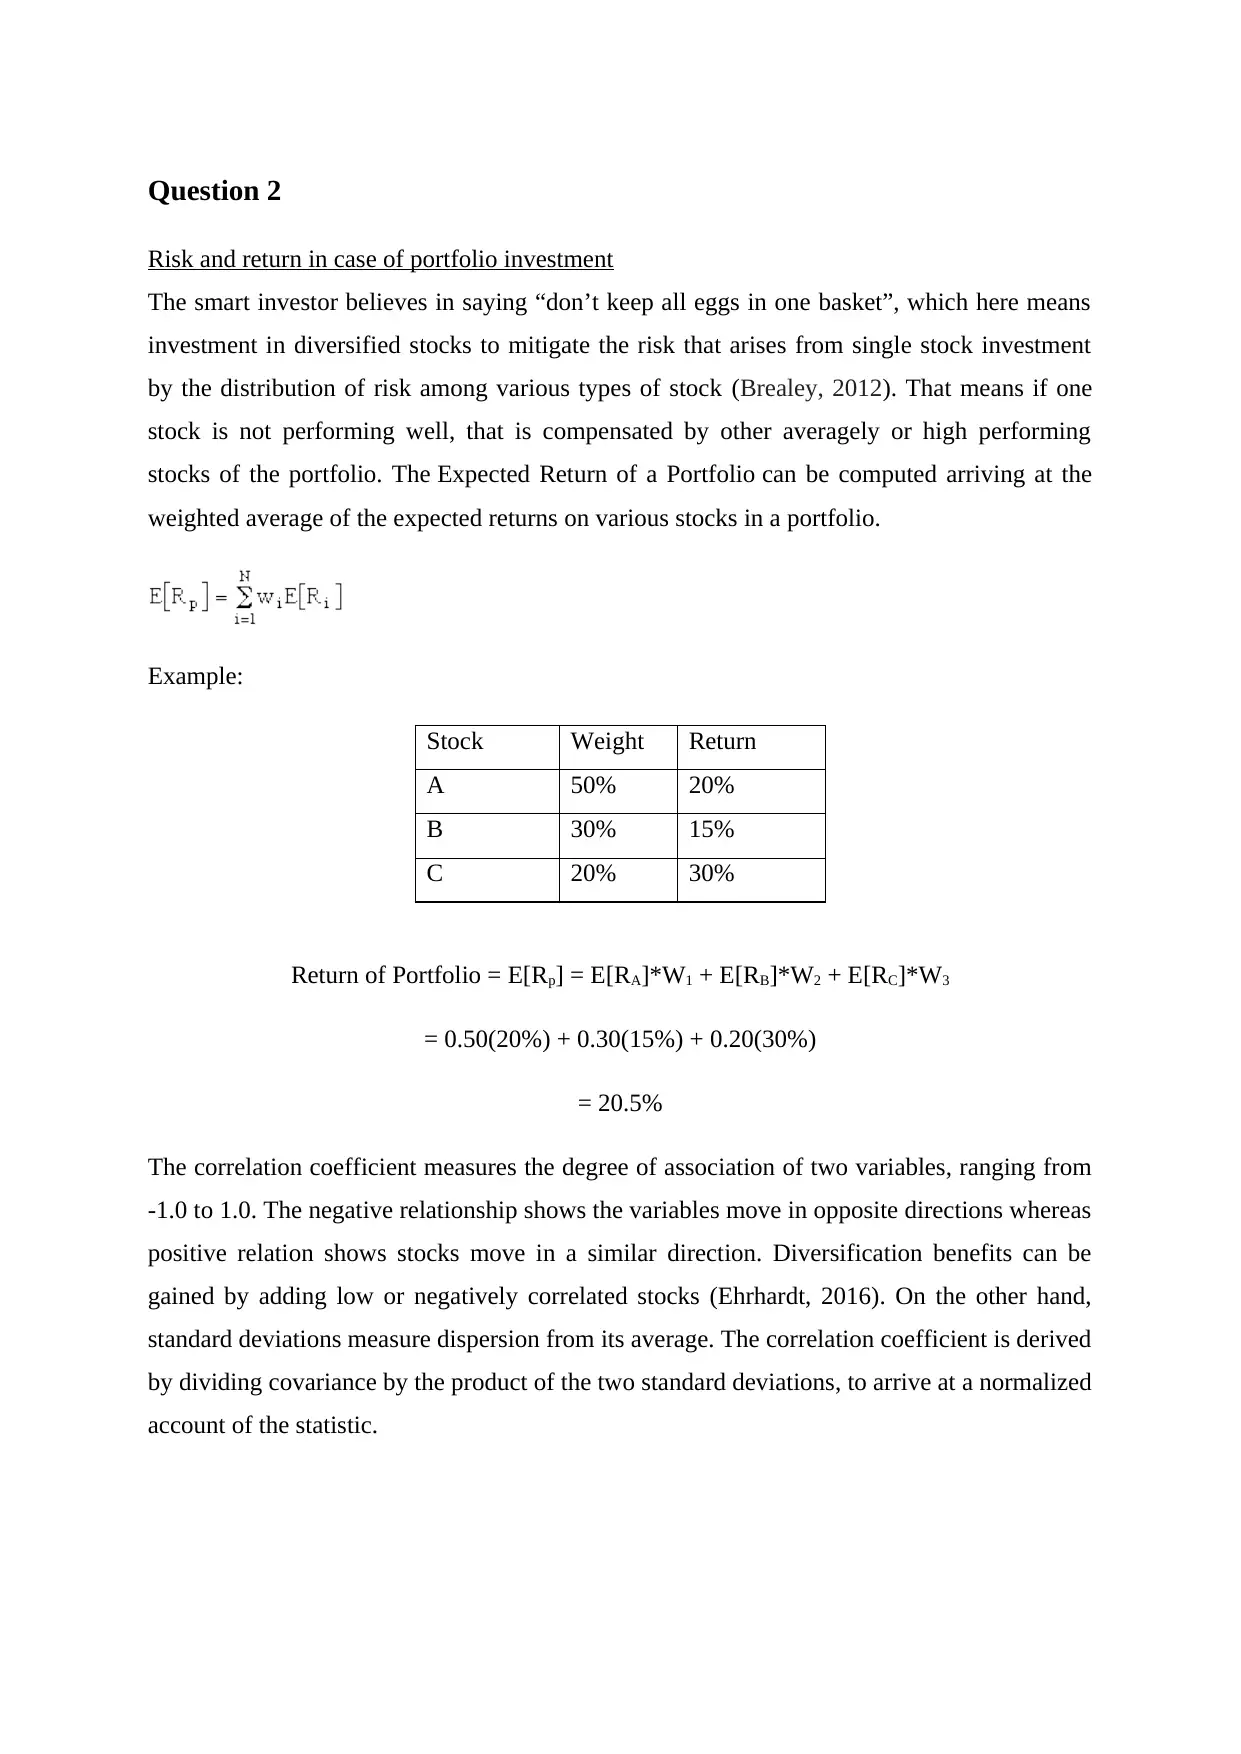
This document presents a solution to a corporate finance assignment. It begins by demonstrating the calculation of risk using standard deviation, including a step-by-step example with numerical values. The solution explains the significance of standard deviation as a key metric for investors, emphasizing its role in measuring the dispersion and uncertainty of investment returns. It then transitions to portfolio investment, explaining the principle of diversification and its benefits in mitigating risk. The solution provides a formula for calculating the expected return of a portfolio and illustrates this with a practical example. It also discusses the correlation coefficient and its importance in diversification. The document references several key finance textbooks, including works by Brealey, Damodaran, Ehrhardt, and Vernimmen, to support the concepts presented.
Document Page
Corporate finance
tabler-icon-diamond-filled.svg

Paraphrase This Document

Need a fresh take? Get an instant paraphrase of this document with our AI Paraphraser
Document Page
Question 1
Risk Calculation using Standard Deviation
Population Standard Deviation:
Sample Standard Deviation:
Example:
Values: 4, 6, 8, 12, 20, 30, 24, 28, 40, 48
Mean = Sum of Values/Total No. of Values
= (4+6+8+12+20+30+24+28+40+44) / 10 = 22
(Value-Mean)2 = [(4-22)2=324, (6-22)2=256, (8-22)2=196, (12-22)2=100, (20-22)2=4, (30-
22)2=64, (24-22)2=4, (28-22)2=36, (40-22)2=324, (48-22)2=676]
Mean of Squared Values = (324+256+196+100+4+64+4+36+324+676) / 10 = 198.4
Standard deviation = [{Sum of (Value-Mean)2} / Total No. of Values]1/2
= (198.4)1/2 = 14.08545
Risk measurement is the core concern for a smart investor, for which standard deviation is
most commonly used measurement metrics. Standard deviation is best measure for calculating
dispersion, widely used in studying variability of returns of an investment from a particular
strategy (Damodaran, 2016). It is often interpreted as a measure of the degree of uncertainty,
and thus risk, associated with a particular security or investment portfolio.
The base assumption while using standard deviation to measure risk in the stock is a normal
distribution. Here 68% times value fall within a single standard deviation of the mean; 95%
time’s values are within two standard deviations of mean and 99.7% times within 3 standard
Document Page
deviations of the mean (Vernimmen, 2014). Like here if the stock price is $100 and SD is
$14.08, 65% chance that price is in range of $114 to $86; 95% certain for the price to range
between $128 to $72; and 99.7% certainty to range between $142 to $ 58.
Probability distribution makes use of finding the possibility of getting the desired stock price
in order to assess the return as calculated in association with the risk factor making use of
standard deviation as a tool.
Document Page
Question 2
Risk and return in case of portfolio investment
The smart investor believes in saying “don’t keep all eggs in one basket”, which here means
investment in diversified stocks to mitigate the risk that arises from single stock investment
by the distribution of risk among various types of stock (Brealey, 2012). That means if one
stock is not performing well, that is compensated by other averagely or high performing
stocks of the portfolio. The Expected Return of a Portfolio can be computed arriving at the
weighted average of the expected returns on various stocks in a portfolio.
Example:
Stock Weight Return
A 50% 20%
B 30% 15%
C 20% 30%
Return of Portfolio = E[Rp] = E[RA]*W1 + E[RB]*W2 + E[RC]*W3
= 0.50(20%) + 0.30(15%) + 0.20(30%)
= 20.5%
The correlation coefficient measures the degree of association of two variables, ranging from
-1.0 to 1.0. The negative relationship shows the variables move in opposite directions whereas
positive relation shows stocks move in a similar direction. Diversification benefits can be
gained by adding low or negatively correlated stocks (Ehrhardt, 2016). On the other hand,
standard deviations measure dispersion from its average. The correlation coefficient is derived
by dividing covariance by the product of the two standard deviations, to arrive at a normalized
account of the statistic.
tabler-icon-diamond-filled.svg

Paraphrase This Document

Need a fresh take? Get an instant paraphrase of this document with our AI Paraphraser
Document Page
References
Brealey, Richard A., Stewart C. Myers, Franklin Allen, and Pitabas Mohanty. Principles of
corporate finance. Tata McGraw-Hill Education, 2012.
Damodaran, Aswath. Damodaran on valuation: security analysis for investment and
corporate finance. Vol. 324. John Wiley & Sons, 2016.
Ehrhardt, Michael C., and Eugene F. Brigham. Corporate finance: A focused approach.
Cengage Learning, 2016.
Vernimmen, Pierre, Pascal Quiry, Maurizio Dallocchio, Yann Le Fur, and Antonio
Salvi. Corporate finance: theory and practice. John Wiley & Sons, 2014.
chevron_up_icon
1 out of 5
circle_padding
hide_on_mobile
zoom_out_icon
[object Object]