Investment Analysis and Share Price Movement: Corporate Finance
VerifiedAdded on 2020/05/11
|16
|2061
|76
Report
AI Summary
This report analyzes the corporate financial management of Riverlea, focusing on the evaluation of investment options in confectionary production. Part 1 assesses the financial outcomes using investment appraisal techniques such as Net Present Value (NPV), Internal Rate of Return (IRR), payback period, and discounted payback period, under various scenarios including sensitivity analysis with different probabilities of revenue changes. The analysis aims to determine the viability and financial stability of the project, recommending whether Riverlea should commence confectionary production. Part 2 evaluates the impact of announcements on Riverlea's share price, examining market efficiency and potential trading strategies like short selling to generate revenue. The report identifies the influence of market efficiency on share prices and how investors' expectations reflect in the share price movement. The findings suggest that Riverlea's shares are affected by strong market efficiency, and strategies like short selling could be used to capitalize on share price fluctuations.

Running head: CORPORATE FINANCIAL MANAGEMENT
Corporate Financial Management
Name of the Student:
Name of the University:
Authors Note:
Corporate Financial Management
Name of the Student:
Name of the University:
Authors Note:
Paraphrase This Document
Need a fresh take? Get an instant paraphrase of this document with our AI Paraphraser
CORPORATE FINANCIAL MANAGEMENT
1
Executive Summary:
The relevant evaluation of investment options is mainly conducted to understand the financial
outcome, which could be provided from production of confectionaries. There are different
types of scenarios, which could be conducted for determining the overall viability of the
investment option. Relevant scenarios could be conducted for deriving the financial stability
and feasibility of the production of confectionaries. In addition, the overall investment
analysis is mainly conducted on different scenarios, where the range of income that could be
presented from investment is depicted. The investment appraisal techniques mainly represent
the overall financial stability of the new project, which could increase firm value in future.
Therefore, it is advisable to Riverlea to commence with the production of confectionaries in
their production function.
The relevant evaluation is mainly conducted on the share price movement of Riverlea after
the announcement of extra income that will be generated in near future. In addition, the
overall valuation could mainly indicate overall impact of the announcement, which is
conducted on the share price of the company. Relevant calculation is mainly conducted to
detect the probability of the share price value after the announcement. Therefore, from the
evaluation it could be identified that shares of Riverlea is directly affected by strong market
efficiency. In addition, share price movement after the announcement mainly indicates that
the share price of the company adequately reflected to the news. The overall investment
strategy such as short selling could be conducted by the organisation for generating higher
revenue from investment.
CORPORATE FINANCIAL MANAGEMENT
2
Table of Contents
Part 1:.........................................................................................................................................3
1. Introduction:...........................................................................................................................3
2. Findings:.................................................................................................................................3
2.1 Calculating the Discounted Rate:.........................................................................................3
2.2 Drafting the expected cash flows of the project:..................................................................4
2.3 Sensitivity Analysis:.............................................................................................................6
2.3.1 Drafting the cash flow when 40% probability is there for 40% lowers incremental
revenues:....................................................................................................................................6
2.3.2 Drafting the cash flow when 10% probability is there for 20% increase in incremental
revenues:....................................................................................................................................8
3. Concussion and Recommendations:....................................................................................10
Part 2:.......................................................................................................................................10
1. Introduction:.........................................................................................................................10
2. Findings:...............................................................................................................................11
2.1 Determining that stock has semi-strong market efficiency:...............................................11
2.2 Portraying the relevant trading strategy:............................................................................13
3. Concussion and Recommendations:....................................................................................13
Reference and Bibliography:....................................................................................................14
⊘ This is a preview!⊘
Do you want full access?
Subscribe today to unlock all pages.
Trusted by 1+ million students worldwide
CORPORATE FINANCIAL MANAGEMENT
3
Part 1:
1. Introduction:
The relevant evaluation of investment options is mainly conducted to understand the
financial outcome, which could be provided from production of confectionaries. There are
different types of scenarios, which could be conducted for determining the overall viability of
the investment option. Relevant scenarios could be conducted for deriving the financial
stability and feasibility of the production of confectionaries.
2. Findings:
2.1 Calculating the Discounted Rate:
Particulars Value
Rf 5.05%
Beta 1.56
Rm 9.22%
CAPM 11.55%
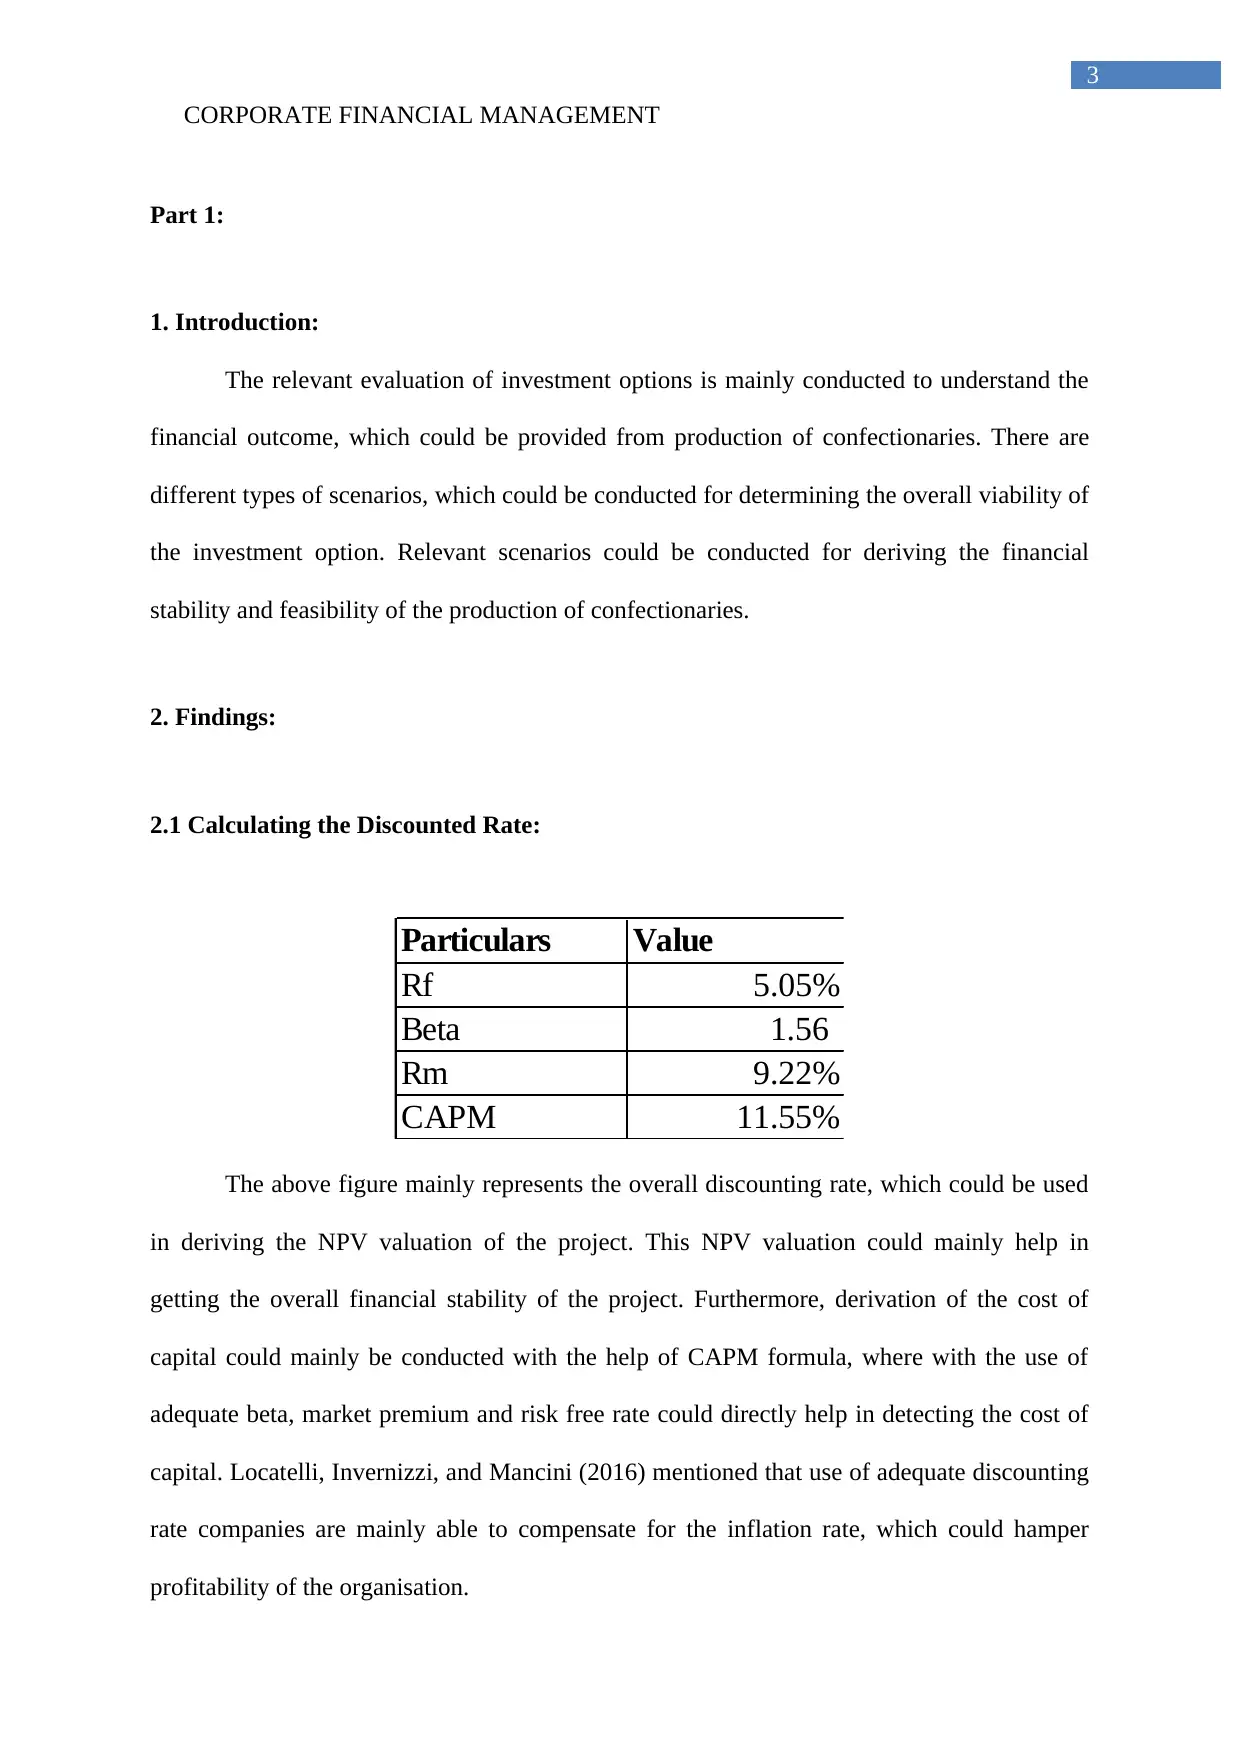
The above figure mainly represents the overall discounting rate, which could be used
in deriving the NPV valuation of the project. This NPV valuation could mainly help in
getting the overall financial stability of the project. Furthermore, derivation of the cost of
capital could mainly be conducted with the help of CAPM formula, where with the use of
adequate beta, market premium and risk free rate could directly help in detecting the cost of
capital. Locatelli, Invernizzi, and Mancini (2016) mentioned that use of adequate discounting
rate companies are mainly able to compensate for the inflation rate, which could hamper
profitability of the organisation.
3
Part 1:
1. Introduction:
The relevant evaluation of investment options is mainly conducted to understand the
financial outcome, which could be provided from production of confectionaries. There are
different types of scenarios, which could be conducted for determining the overall viability of
the investment option. Relevant scenarios could be conducted for deriving the financial
stability and feasibility of the production of confectionaries.
2. Findings:
2.1 Calculating the Discounted Rate:
Particulars Value
Rf 5.05%
Beta 1.56
Rm 9.22%
CAPM 11.55%
The above figure mainly represents the overall discounting rate, which could be used
in deriving the NPV valuation of the project. This NPV valuation could mainly help in
getting the overall financial stability of the project. Furthermore, derivation of the cost of
capital could mainly be conducted with the help of CAPM formula, where with the use of
adequate beta, market premium and risk free rate could directly help in detecting the cost of
capital. Locatelli, Invernizzi, and Mancini (2016) mentioned that use of adequate discounting
rate companies are mainly able to compensate for the inflation rate, which could hamper
profitability of the organisation.
Paraphrase This Document
Need a fresh take? Get an instant paraphrase of this document with our AI Paraphraser
CORPORATE FINANCIAL MANAGEMENT
4
2.2 Drafting the expected cash flows of the project:
Item/Year 0 1 2 3 4 5 6 7 8 9 10
Net increase in Revenue $800,000 $880,000 $968,000 $1,064,800 $1,171,280 $1,288,408 $1,417,249 $1,558,974 $1,714,871 $1,886,358
Net decrease in revenue $(200,000) $(200,000) $(200,000) $(200,000) $(200,000) $(200,000) $(200,000) $(200,000) $(200,000) $(200,000)
Net increase in Cost $(240,000) $(272,000) $(307,200) $(345,920) $(388,512) $(435,363) $(486,900) $(543,589) $(605,948) $(674,543)
Increase in Depreciation $(340,000) $(272,000) $(217,600) $(174,080) $(139,264) $(111,411) $(89,129) $(71,303) $(57,043) $(45,634)
Profit on Sale $200,000
Taxable Income $20,000 $136,000 $243,200 $344,800 $443,504 $541,634 $641,220 $744,081 $851,880 $1,166,181
Item/Year 0 1 2 3 4 5 6 7 8 9 10
Net increase in Revenue $800,000 $880,000 $968,000 $1,064,800 $1,171,280 $1,288,408 $1,417,249 $1,558,974 $1,714,871 $1,886,358
Net decrease in revenue $(200,000) $(200,000) $(200,000) $(200,000) $(200,000) $(200,000) $(200,000) $(200,000) $(200,000) $(200,000)
Net increase in Cost $(240,000) $(272,000) $(307,200) $(345,920) $(388,512) $(435,363) $(486,900) $(543,589) $(605,948) $(674,543)
Cost of Machinery $(1,500,000)
Installation and shipping cost $(200,000)
Salvage Value $200,000
Increase in Working Capital $(50,000) $(10,000) $(10,000) $(10,000) $(10,000) $(10,000) $(10,000) $(10,000) $(10,000) $(10,000) $140,000
Tax $(6,000) $(40,800) $(72,960) $(103,440) $(133,051) $(162,490) $(192,366) $(223,224) $(255,564) $(349,854)
Cash Flows $(1,750,000) $344,000 $357,200 $377,840 $405,440 $439,717 $480,555 $527,983 $582,160 $643,359 $1,001,961
Cumulative cash flow $(1,750,000) $(1,406,000) $(1,048,800) $(670,960) $(265,520) $174,197 $654,752 $1,182,735 $1,764,895 $2,408,253 $3,410,214
Item/Year 0 1 2 3 4 5 6 7 8 9 10
Cash Flows $(1,750,000) $344,000 $357,200 $377,840 $405,440 $439,717 $480,555 $527,983 $582,160 $643,359 $1,001,961
Discounting Factor (@11.55%) 1.0000 0.8965 0.8036 0.7204 0.6458 0.5790 0.5190 0.4653 0.4171 0.3739 0.3352
Present value of Cashflows $(1,750,000) $308,382 $287,060 $272,207 $261,847 $254,581 $249,417 $245,659 $242,821 $240,562 $335,857
Cumulative cash flow $(1,750,000) $(1,441,618) $(1,154,558) $(882,351) $(620,504) $(365,923) $(116,507) $129,152 $371,973 $612,535 $948,392
NPV 948,392$
IRR 21.49%
Payback (years) 4.60
Discounted Payback (years) 6.47
Taxable Income
Cash Flows
Present value of Cashflows
CORPORATE FINANCIAL MANAGEMENT
5
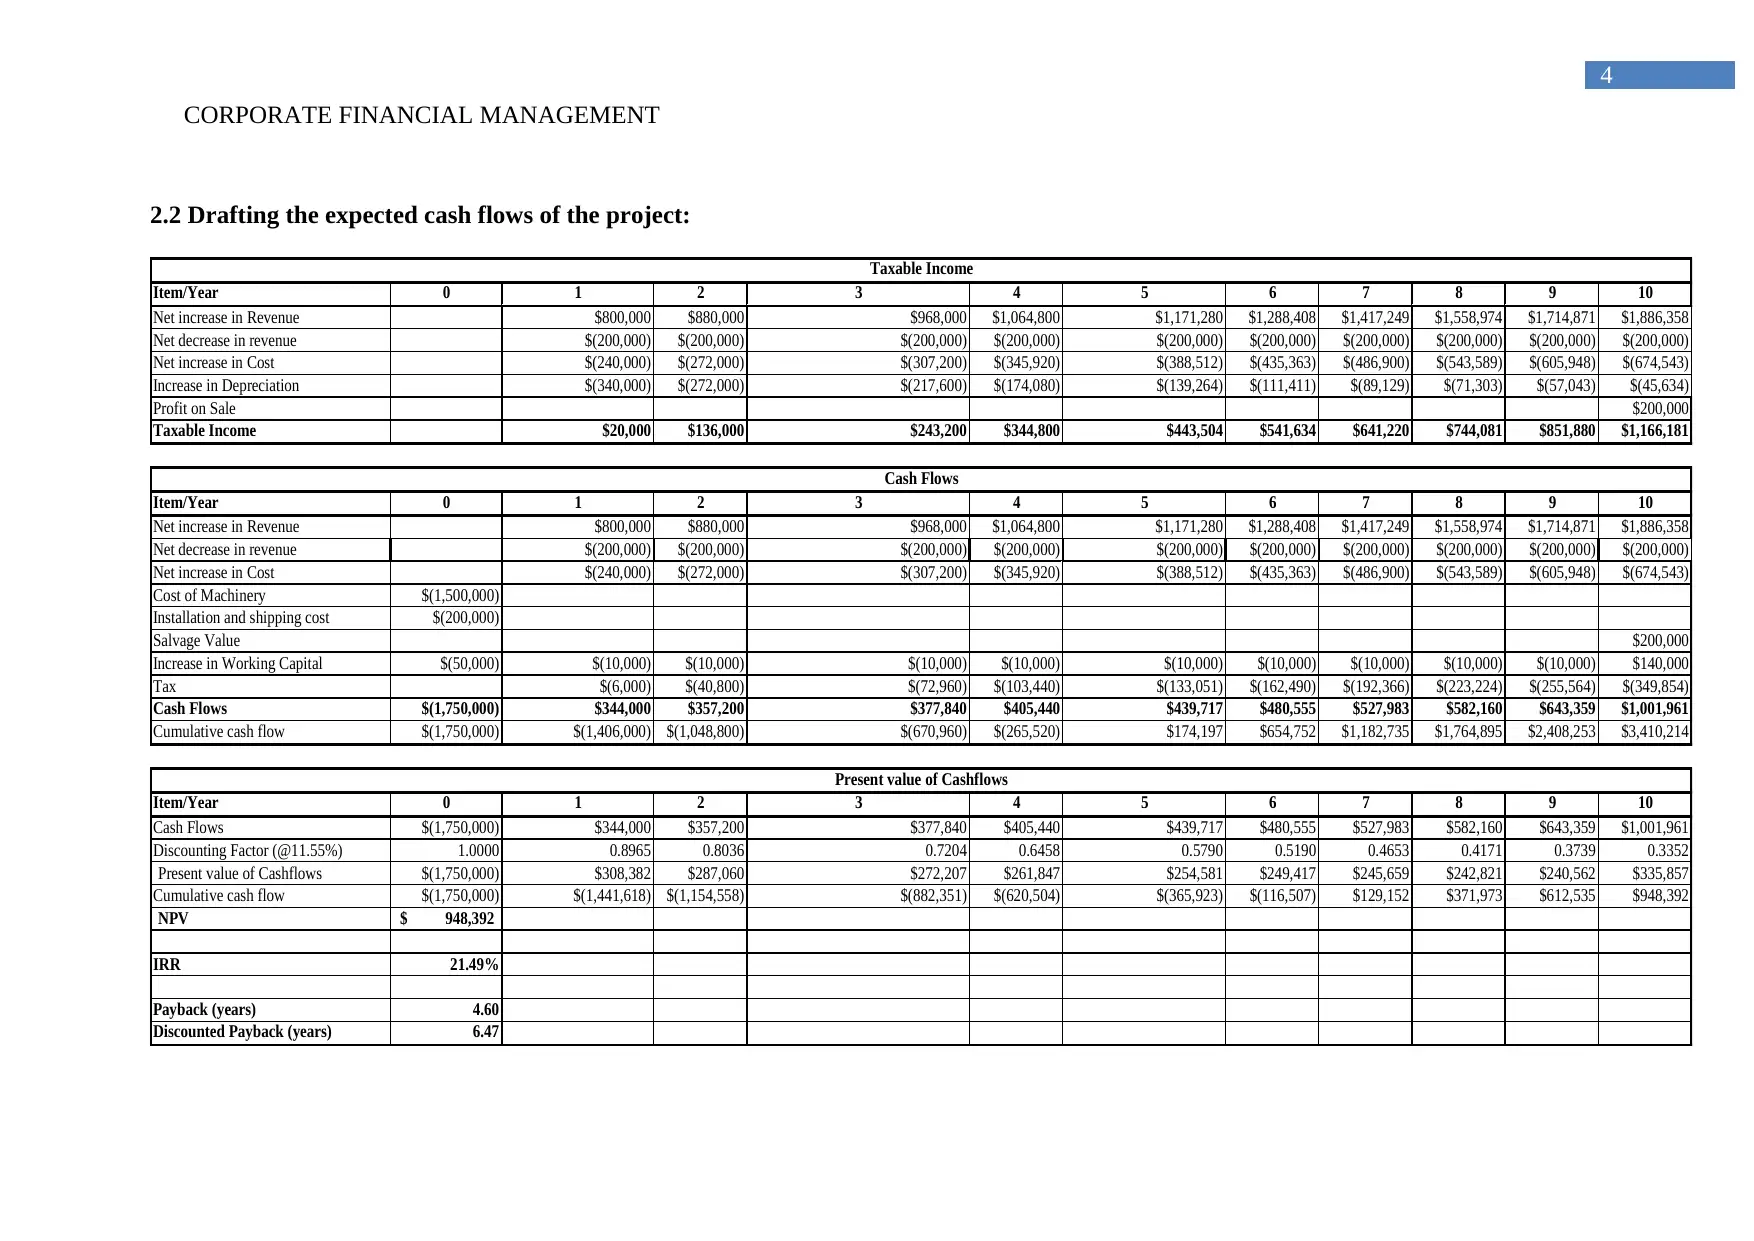
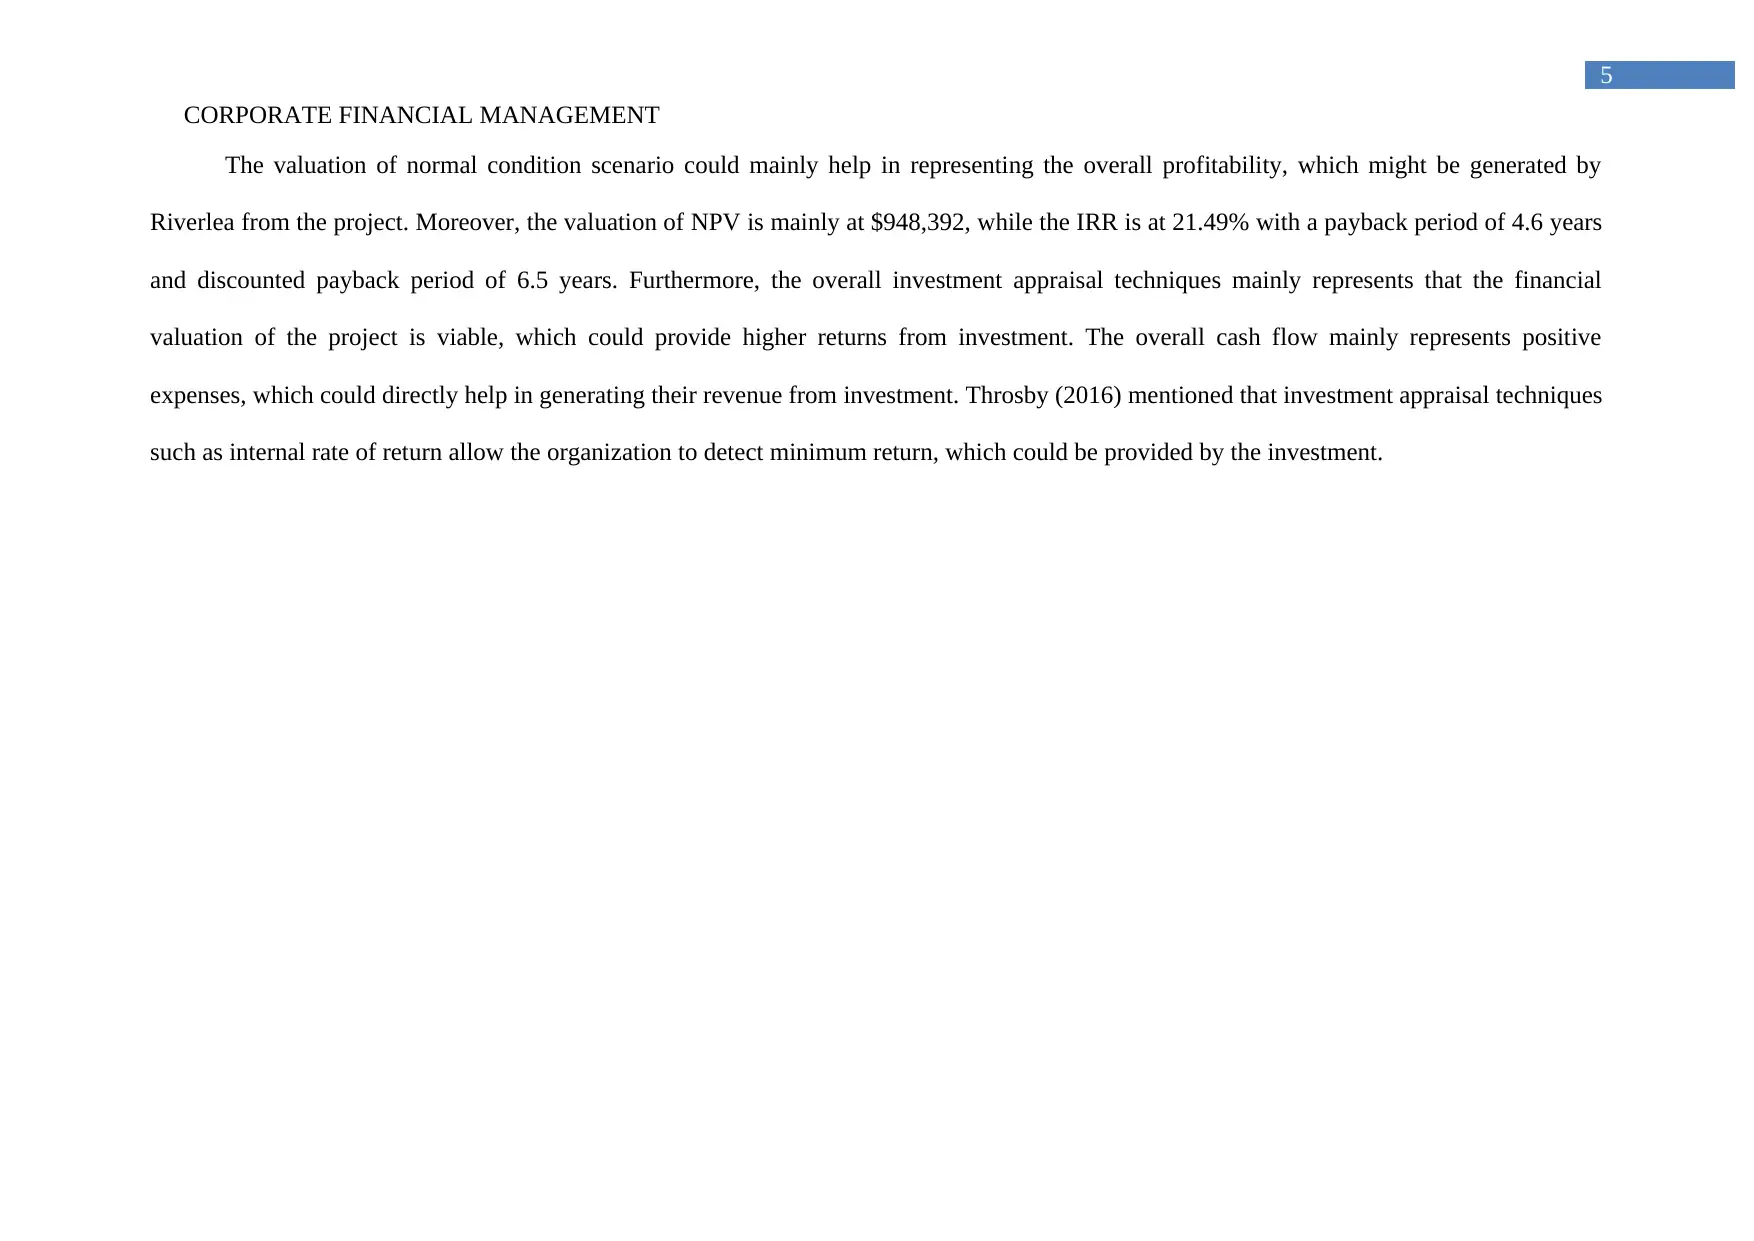
The valuation of normal condition scenario could mainly help in representing the overall profitability, which might be generated by
Riverlea from the project. Moreover, the valuation of NPV is mainly at $948,392, while the IRR is at 21.49% with a payback period of 4.6 years
and discounted payback period of 6.5 years. Furthermore, the overall investment appraisal techniques mainly represents that the financial
valuation of the project is viable, which could provide higher returns from investment. The overall cash flow mainly represents positive
expenses, which could directly help in generating their revenue from investment. Throsby (2016) mentioned that investment appraisal techniques
such as internal rate of return allow the organization to detect minimum return, which could be provided by the investment.
5
The valuation of normal condition scenario could mainly help in representing the overall profitability, which might be generated by
Riverlea from the project. Moreover, the valuation of NPV is mainly at $948,392, while the IRR is at 21.49% with a payback period of 4.6 years
and discounted payback period of 6.5 years. Furthermore, the overall investment appraisal techniques mainly represents that the financial
valuation of the project is viable, which could provide higher returns from investment. The overall cash flow mainly represents positive
expenses, which could directly help in generating their revenue from investment. Throsby (2016) mentioned that investment appraisal techniques
such as internal rate of return allow the organization to detect minimum return, which could be provided by the investment.
⊘ This is a preview!⊘
Do you want full access?
Subscribe today to unlock all pages.
Trusted by 1+ million students worldwide
CORPORATE FINANCIAL MANAGEMENT
6
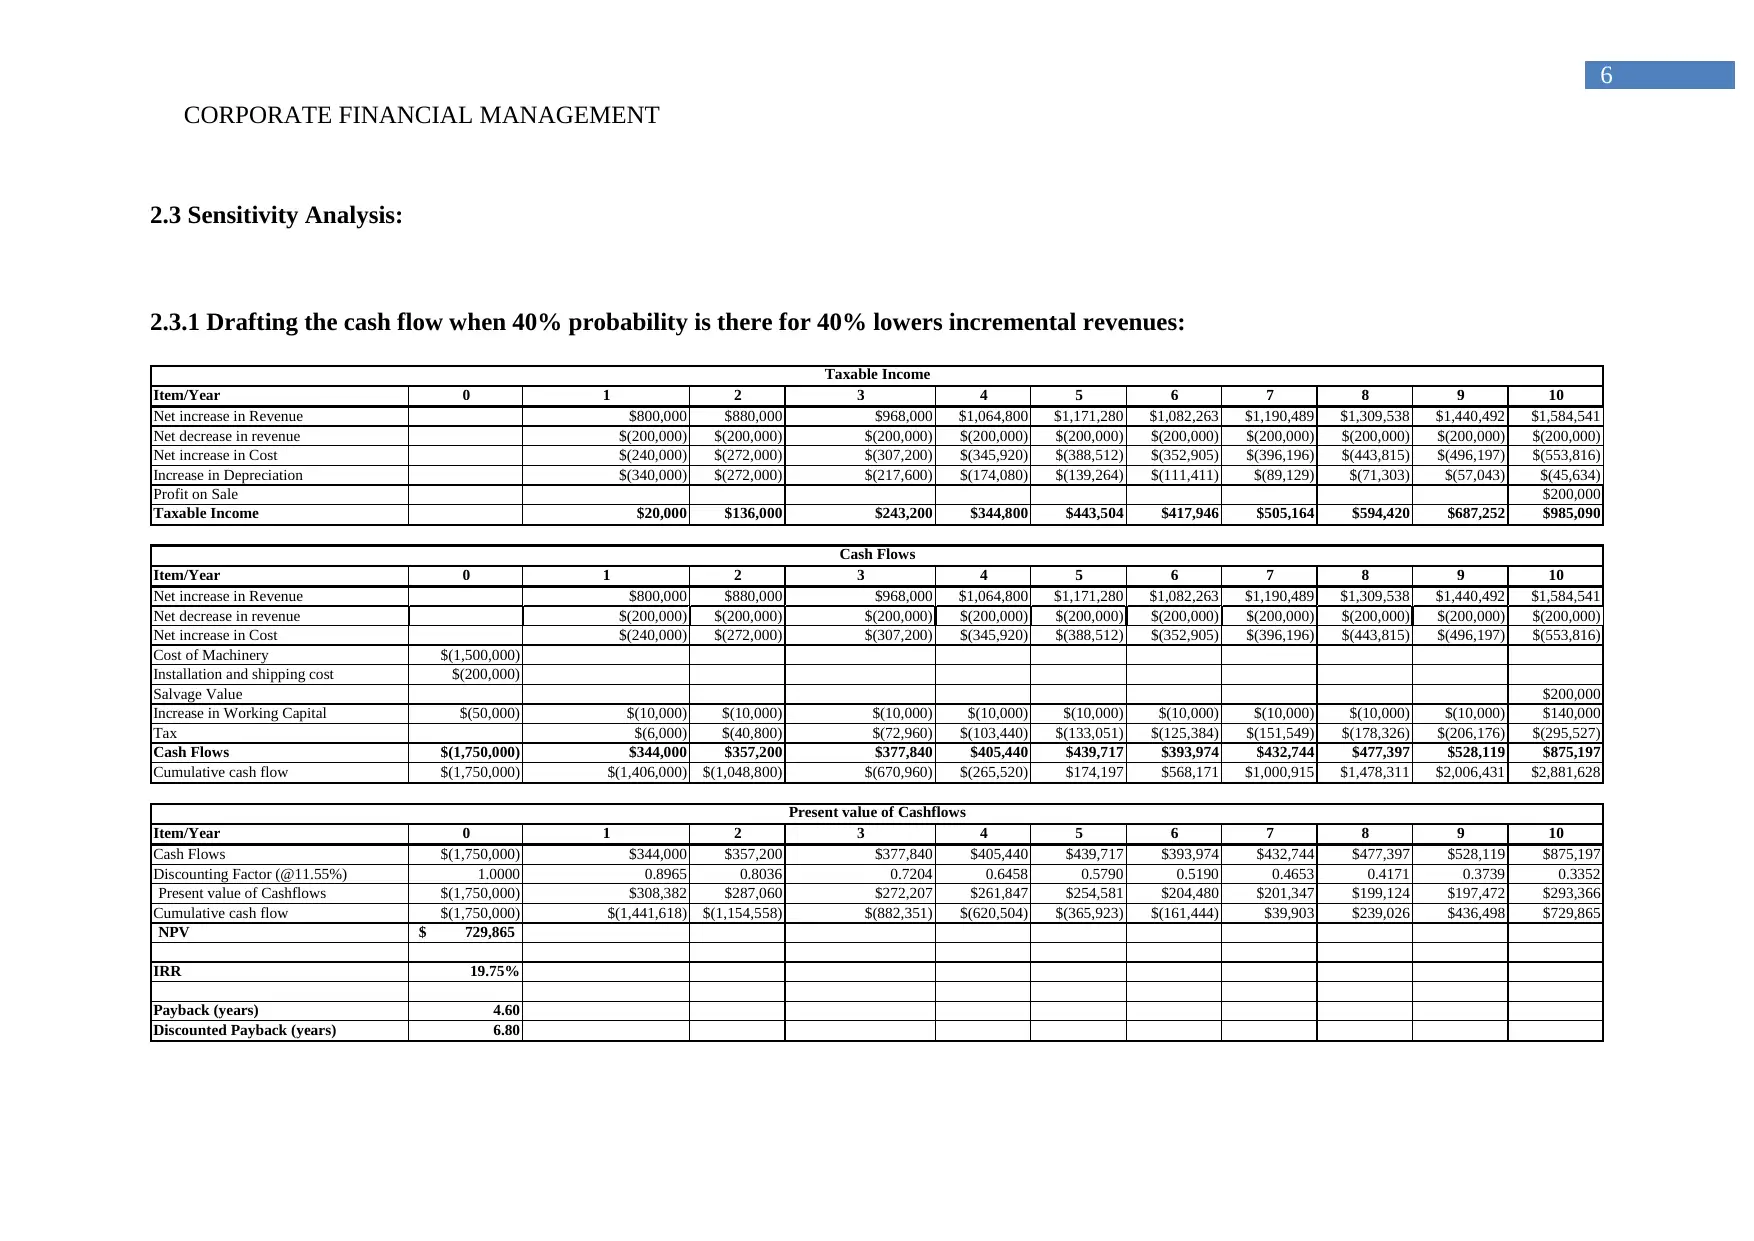
2.3 Sensitivity Analysis:
2.3.1 Drafting the cash flow when 40% probability is there for 40% lowers incremental revenues:
Item/Year 0 1 2 3 4 5 6 7 8 9 10
Net increase in Revenue $800,000 $880,000 $968,000 $1,064,800 $1,171,280 $1,082,263 $1,190,489 $1,309,538 $1,440,492 $1,584,541
Net decrease in revenue $(200,000) $(200,000) $(200,000) $(200,000) $(200,000) $(200,000) $(200,000) $(200,000) $(200,000) $(200,000)
Net increase in Cost $(240,000) $(272,000) $(307,200) $(345,920) $(388,512) $(352,905) $(396,196) $(443,815) $(496,197) $(553,816)
Increase in Depreciation $(340,000) $(272,000) $(217,600) $(174,080) $(139,264) $(111,411) $(89,129) $(71,303) $(57,043) $(45,634)
Profit on Sale $200,000
Taxable Income $20,000 $136,000 $243,200 $344,800 $443,504 $417,946 $505,164 $594,420 $687,252 $985,090
Item/Year 0 1 2 3 4 5 6 7 8 9 10
Net increase in Revenue $800,000 $880,000 $968,000 $1,064,800 $1,171,280 $1,082,263 $1,190,489 $1,309,538 $1,440,492 $1,584,541
Net decrease in revenue $(200,000) $(200,000) $(200,000) $(200,000) $(200,000) $(200,000) $(200,000) $(200,000) $(200,000) $(200,000)
Net increase in Cost $(240,000) $(272,000) $(307,200) $(345,920) $(388,512) $(352,905) $(396,196) $(443,815) $(496,197) $(553,816)
Cost of Machinery $(1,500,000)
Installation and shipping cost $(200,000)
Salvage Value $200,000
Increase in Working Capital $(50,000) $(10,000) $(10,000) $(10,000) $(10,000) $(10,000) $(10,000) $(10,000) $(10,000) $(10,000) $140,000
Tax $(6,000) $(40,800) $(72,960) $(103,440) $(133,051) $(125,384) $(151,549) $(178,326) $(206,176) $(295,527)
Cash Flows $(1,750,000) $344,000 $357,200 $377,840 $405,440 $439,717 $393,974 $432,744 $477,397 $528,119 $875,197
Cumulative cash flow $(1,750,000) $(1,406,000) $(1,048,800) $(670,960) $(265,520) $174,197 $568,171 $1,000,915 $1,478,311 $2,006,431 $2,881,628
Item/Year 0 1 2 3 4 5 6 7 8 9 10
Cash Flows $(1,750,000) $344,000 $357,200 $377,840 $405,440 $439,717 $393,974 $432,744 $477,397 $528,119 $875,197
Discounting Factor (@11.55%) 1.0000 0.8965 0.8036 0.7204 0.6458 0.5790 0.5190 0.4653 0.4171 0.3739 0.3352
Present value of Cashflows $(1,750,000) $308,382 $287,060 $272,207 $261,847 $254,581 $204,480 $201,347 $199,124 $197,472 $293,366
Cumulative cash flow $(1,750,000) $(1,441,618) $(1,154,558) $(882,351) $(620,504) $(365,923) $(161,444) $39,903 $239,026 $436,498 $729,865
NPV 729,865$
IRR 19.75%
Payback (years) 4.60
Discounted Payback (years) 6.80
Taxable Income
Cash Flows
Present value of Cashflows
6
2.3 Sensitivity Analysis:
2.3.1 Drafting the cash flow when 40% probability is there for 40% lowers incremental revenues:
Item/Year 0 1 2 3 4 5 6 7 8 9 10
Net increase in Revenue $800,000 $880,000 $968,000 $1,064,800 $1,171,280 $1,082,263 $1,190,489 $1,309,538 $1,440,492 $1,584,541
Net decrease in revenue $(200,000) $(200,000) $(200,000) $(200,000) $(200,000) $(200,000) $(200,000) $(200,000) $(200,000) $(200,000)
Net increase in Cost $(240,000) $(272,000) $(307,200) $(345,920) $(388,512) $(352,905) $(396,196) $(443,815) $(496,197) $(553,816)
Increase in Depreciation $(340,000) $(272,000) $(217,600) $(174,080) $(139,264) $(111,411) $(89,129) $(71,303) $(57,043) $(45,634)
Profit on Sale $200,000
Taxable Income $20,000 $136,000 $243,200 $344,800 $443,504 $417,946 $505,164 $594,420 $687,252 $985,090
Item/Year 0 1 2 3 4 5 6 7 8 9 10
Net increase in Revenue $800,000 $880,000 $968,000 $1,064,800 $1,171,280 $1,082,263 $1,190,489 $1,309,538 $1,440,492 $1,584,541
Net decrease in revenue $(200,000) $(200,000) $(200,000) $(200,000) $(200,000) $(200,000) $(200,000) $(200,000) $(200,000) $(200,000)
Net increase in Cost $(240,000) $(272,000) $(307,200) $(345,920) $(388,512) $(352,905) $(396,196) $(443,815) $(496,197) $(553,816)
Cost of Machinery $(1,500,000)
Installation and shipping cost $(200,000)
Salvage Value $200,000
Increase in Working Capital $(50,000) $(10,000) $(10,000) $(10,000) $(10,000) $(10,000) $(10,000) $(10,000) $(10,000) $(10,000) $140,000
Tax $(6,000) $(40,800) $(72,960) $(103,440) $(133,051) $(125,384) $(151,549) $(178,326) $(206,176) $(295,527)
Cash Flows $(1,750,000) $344,000 $357,200 $377,840 $405,440 $439,717 $393,974 $432,744 $477,397 $528,119 $875,197
Cumulative cash flow $(1,750,000) $(1,406,000) $(1,048,800) $(670,960) $(265,520) $174,197 $568,171 $1,000,915 $1,478,311 $2,006,431 $2,881,628
Item/Year 0 1 2 3 4 5 6 7 8 9 10
Cash Flows $(1,750,000) $344,000 $357,200 $377,840 $405,440 $439,717 $393,974 $432,744 $477,397 $528,119 $875,197
Discounting Factor (@11.55%) 1.0000 0.8965 0.8036 0.7204 0.6458 0.5790 0.5190 0.4653 0.4171 0.3739 0.3352
Present value of Cashflows $(1,750,000) $308,382 $287,060 $272,207 $261,847 $254,581 $204,480 $201,347 $199,124 $197,472 $293,366
Cumulative cash flow $(1,750,000) $(1,441,618) $(1,154,558) $(882,351) $(620,504) $(365,923) $(161,444) $39,903 $239,026 $436,498 $729,865
NPV 729,865$
IRR 19.75%
Payback (years) 4.60
Discounted Payback (years) 6.80
Taxable Income
Cash Flows
Present value of Cashflows
Paraphrase This Document
Need a fresh take? Get an instant paraphrase of this document with our AI Paraphraser
CORPORATE FINANCIAL MANAGEMENT
7
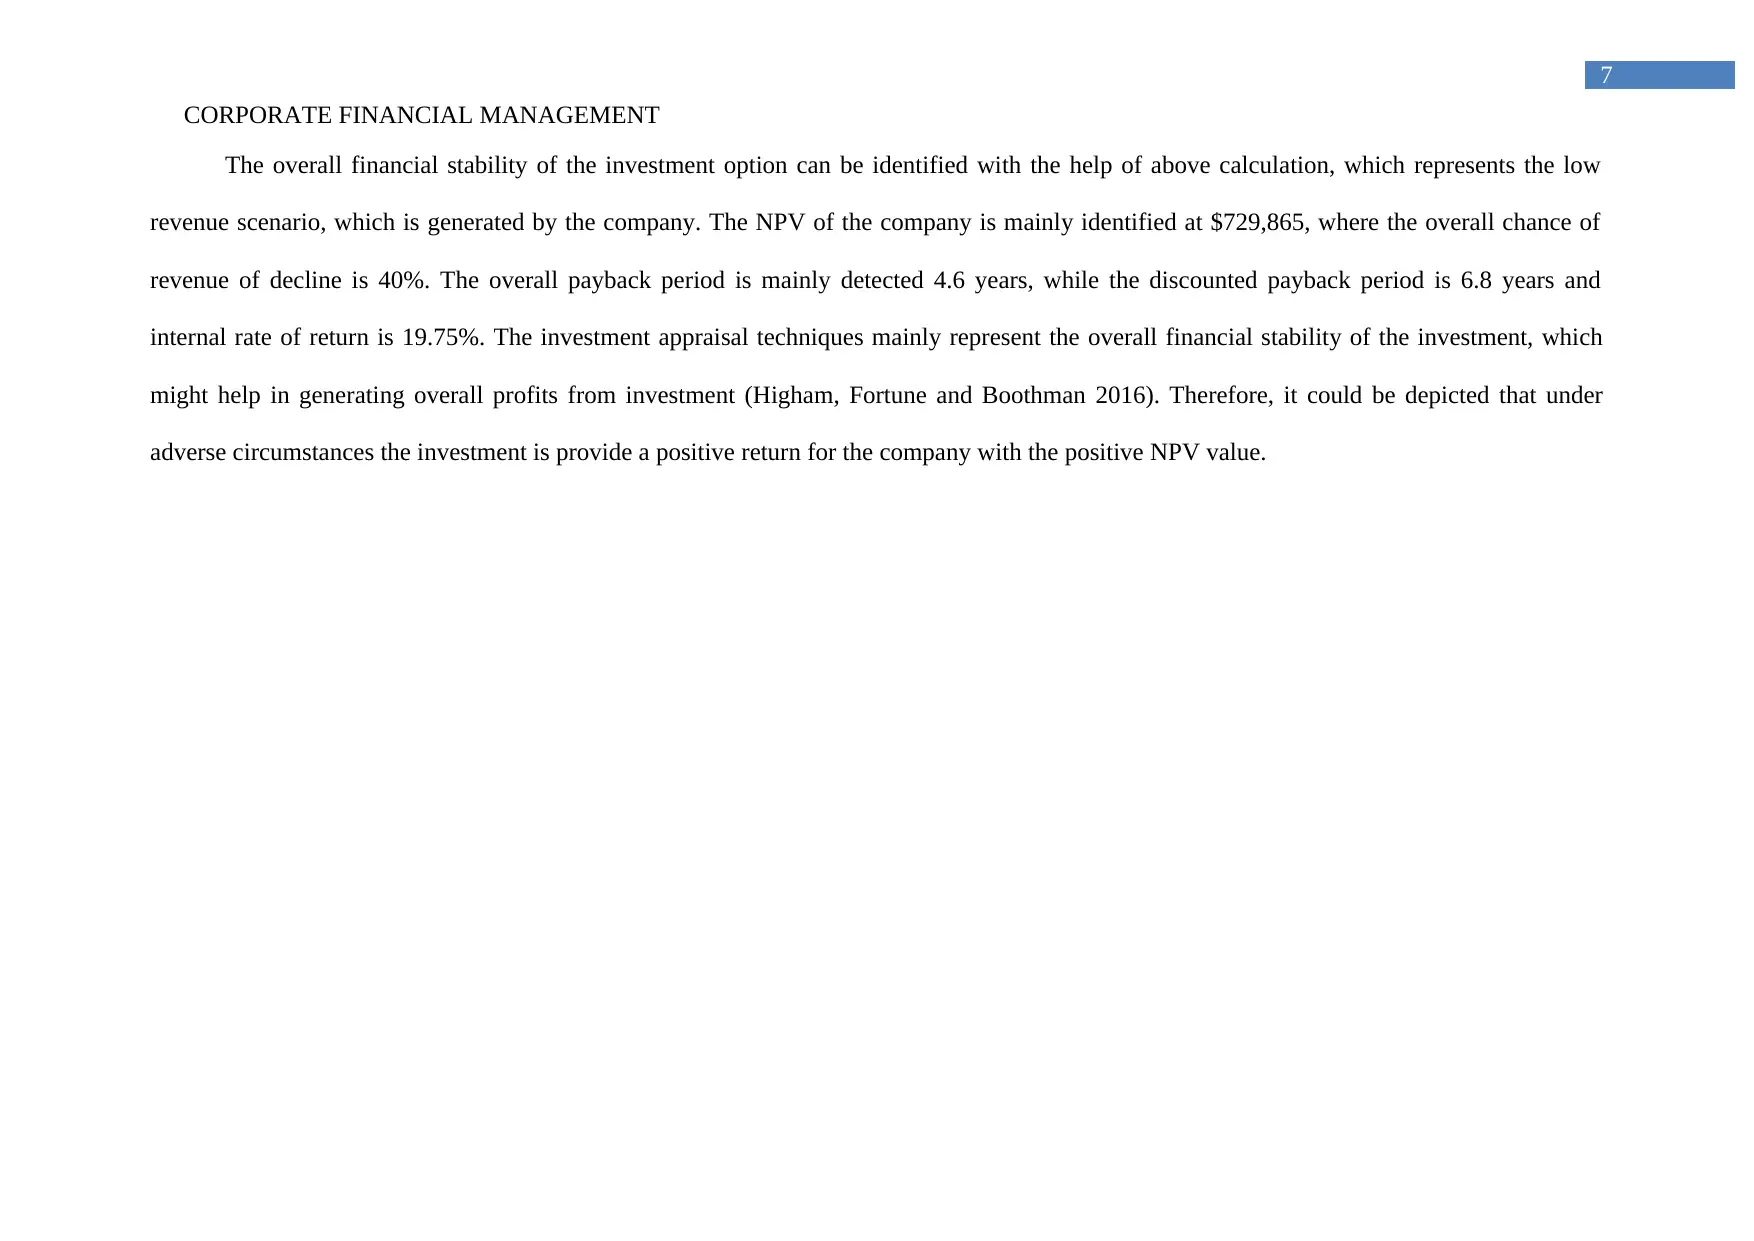
The overall financial stability of the investment option can be identified with the help of above calculation, which represents the low
revenue scenario, which is generated by the company. The NPV of the company is mainly identified at $729,865, where the overall chance of
revenue of decline is 40%. The overall payback period is mainly detected 4.6 years, while the discounted payback period is 6.8 years and
internal rate of return is 19.75%. The investment appraisal techniques mainly represent the overall financial stability of the investment, which
might help in generating overall profits from investment (Higham, Fortune and Boothman 2016). Therefore, it could be depicted that under
adverse circumstances the investment is provide a positive return for the company with the positive NPV value.
7
The overall financial stability of the investment option can be identified with the help of above calculation, which represents the low
revenue scenario, which is generated by the company. The NPV of the company is mainly identified at $729,865, where the overall chance of
revenue of decline is 40%. The overall payback period is mainly detected 4.6 years, while the discounted payback period is 6.8 years and
internal rate of return is 19.75%. The investment appraisal techniques mainly represent the overall financial stability of the investment, which
might help in generating overall profits from investment (Higham, Fortune and Boothman 2016). Therefore, it could be depicted that under
adverse circumstances the investment is provide a positive return for the company with the positive NPV value.
CORPORATE FINANCIAL MANAGEMENT
8
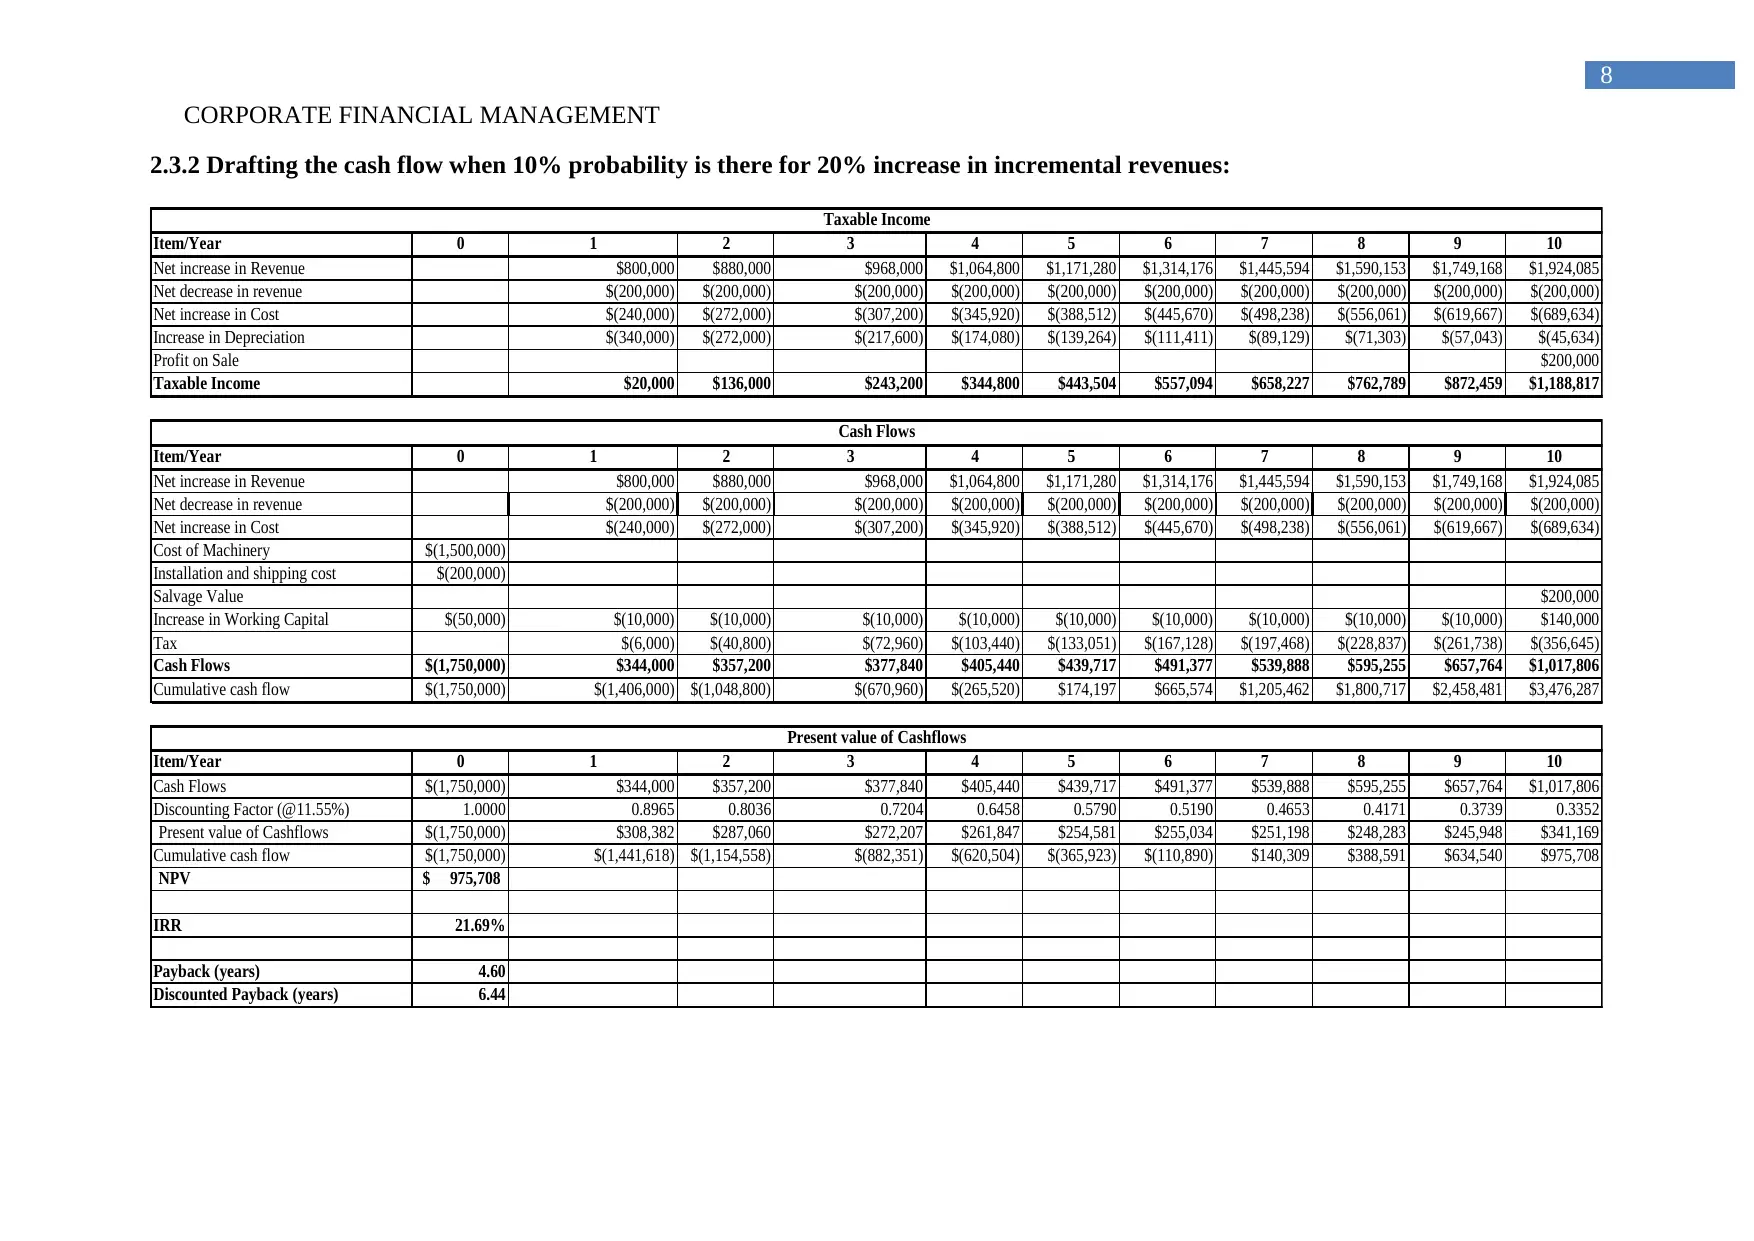
2.3.2 Drafting the cash flow when 10% probability is there for 20% increase in incremental revenues:
Item/Year 0 1 2 3 4 5 6 7 8 9 10
Net increase in Revenue $800,000 $880,000 $968,000 $1,064,800 $1,171,280 $1,314,176 $1,445,594 $1,590,153 $1,749,168 $1,924,085
Net decrease in revenue $(200,000) $(200,000) $(200,000) $(200,000) $(200,000) $(200,000) $(200,000) $(200,000) $(200,000) $(200,000)
Net increase in Cost $(240,000) $(272,000) $(307,200) $(345,920) $(388,512) $(445,670) $(498,238) $(556,061) $(619,667) $(689,634)
Increase in Depreciation $(340,000) $(272,000) $(217,600) $(174,080) $(139,264) $(111,411) $(89,129) $(71,303) $(57,043) $(45,634)
Profit on Sale $200,000
Taxable Income $20,000 $136,000 $243,200 $344,800 $443,504 $557,094 $658,227 $762,789 $872,459 $1,188,817
Item/Year 0 1 2 3 4 5 6 7 8 9 10
Net increase in Revenue $800,000 $880,000 $968,000 $1,064,800 $1,171,280 $1,314,176 $1,445,594 $1,590,153 $1,749,168 $1,924,085
Net decrease in revenue $(200,000) $(200,000) $(200,000) $(200,000) $(200,000) $(200,000) $(200,000) $(200,000) $(200,000) $(200,000)
Net increase in Cost $(240,000) $(272,000) $(307,200) $(345,920) $(388,512) $(445,670) $(498,238) $(556,061) $(619,667) $(689,634)
Cost of Machinery $(1,500,000)
Installation and shipping cost $(200,000)
Salvage Value $200,000
Increase in Working Capital $(50,000) $(10,000) $(10,000) $(10,000) $(10,000) $(10,000) $(10,000) $(10,000) $(10,000) $(10,000) $140,000
Tax $(6,000) $(40,800) $(72,960) $(103,440) $(133,051) $(167,128) $(197,468) $(228,837) $(261,738) $(356,645)
Cash Flows $(1,750,000) $344,000 $357,200 $377,840 $405,440 $439,717 $491,377 $539,888 $595,255 $657,764 $1,017,806
Cumulative cash flow $(1,750,000) $(1,406,000) $(1,048,800) $(670,960) $(265,520) $174,197 $665,574 $1,205,462 $1,800,717 $2,458,481 $3,476,287
Item/Year 0 1 2 3 4 5 6 7 8 9 10
Cash Flows $(1,750,000) $344,000 $357,200 $377,840 $405,440 $439,717 $491,377 $539,888 $595,255 $657,764 $1,017,806
Discounting Factor (@11.55%) 1.0000 0.8965 0.8036 0.7204 0.6458 0.5790 0.5190 0.4653 0.4171 0.3739 0.3352
Present value of Cashflows $(1,750,000) $308,382 $287,060 $272,207 $261,847 $254,581 $255,034 $251,198 $248,283 $245,948 $341,169
Cumulative cash flow $(1,750,000) $(1,441,618) $(1,154,558) $(882,351) $(620,504) $(365,923) $(110,890) $140,309 $388,591 $634,540 $975,708
NPV 975,708$
IRR 21.69%
Payback (years) 4.60
Discounted Payback (years) 6.44
Taxable Income
Cash Flows
Present value of Cashflows
8
2.3.2 Drafting the cash flow when 10% probability is there for 20% increase in incremental revenues:
Item/Year 0 1 2 3 4 5 6 7 8 9 10
Net increase in Revenue $800,000 $880,000 $968,000 $1,064,800 $1,171,280 $1,314,176 $1,445,594 $1,590,153 $1,749,168 $1,924,085
Net decrease in revenue $(200,000) $(200,000) $(200,000) $(200,000) $(200,000) $(200,000) $(200,000) $(200,000) $(200,000) $(200,000)
Net increase in Cost $(240,000) $(272,000) $(307,200) $(345,920) $(388,512) $(445,670) $(498,238) $(556,061) $(619,667) $(689,634)
Increase in Depreciation $(340,000) $(272,000) $(217,600) $(174,080) $(139,264) $(111,411) $(89,129) $(71,303) $(57,043) $(45,634)
Profit on Sale $200,000
Taxable Income $20,000 $136,000 $243,200 $344,800 $443,504 $557,094 $658,227 $762,789 $872,459 $1,188,817
Item/Year 0 1 2 3 4 5 6 7 8 9 10
Net increase in Revenue $800,000 $880,000 $968,000 $1,064,800 $1,171,280 $1,314,176 $1,445,594 $1,590,153 $1,749,168 $1,924,085
Net decrease in revenue $(200,000) $(200,000) $(200,000) $(200,000) $(200,000) $(200,000) $(200,000) $(200,000) $(200,000) $(200,000)
Net increase in Cost $(240,000) $(272,000) $(307,200) $(345,920) $(388,512) $(445,670) $(498,238) $(556,061) $(619,667) $(689,634)
Cost of Machinery $(1,500,000)
Installation and shipping cost $(200,000)
Salvage Value $200,000
Increase in Working Capital $(50,000) $(10,000) $(10,000) $(10,000) $(10,000) $(10,000) $(10,000) $(10,000) $(10,000) $(10,000) $140,000
Tax $(6,000) $(40,800) $(72,960) $(103,440) $(133,051) $(167,128) $(197,468) $(228,837) $(261,738) $(356,645)
Cash Flows $(1,750,000) $344,000 $357,200 $377,840 $405,440 $439,717 $491,377 $539,888 $595,255 $657,764 $1,017,806
Cumulative cash flow $(1,750,000) $(1,406,000) $(1,048,800) $(670,960) $(265,520) $174,197 $665,574 $1,205,462 $1,800,717 $2,458,481 $3,476,287
Item/Year 0 1 2 3 4 5 6 7 8 9 10
Cash Flows $(1,750,000) $344,000 $357,200 $377,840 $405,440 $439,717 $491,377 $539,888 $595,255 $657,764 $1,017,806
Discounting Factor (@11.55%) 1.0000 0.8965 0.8036 0.7204 0.6458 0.5790 0.5190 0.4653 0.4171 0.3739 0.3352
Present value of Cashflows $(1,750,000) $308,382 $287,060 $272,207 $261,847 $254,581 $255,034 $251,198 $248,283 $245,948 $341,169
Cumulative cash flow $(1,750,000) $(1,441,618) $(1,154,558) $(882,351) $(620,504) $(365,923) $(110,890) $140,309 $388,591 $634,540 $975,708
NPV 975,708$
IRR 21.69%
Payback (years) 4.60
Discounted Payback (years) 6.44
Taxable Income
Cash Flows
Present value of Cashflows
⊘ This is a preview!⊘
Do you want full access?
Subscribe today to unlock all pages.
Trusted by 1+ million students worldwide
CORPORATE FINANCIAL MANAGEMENT
9
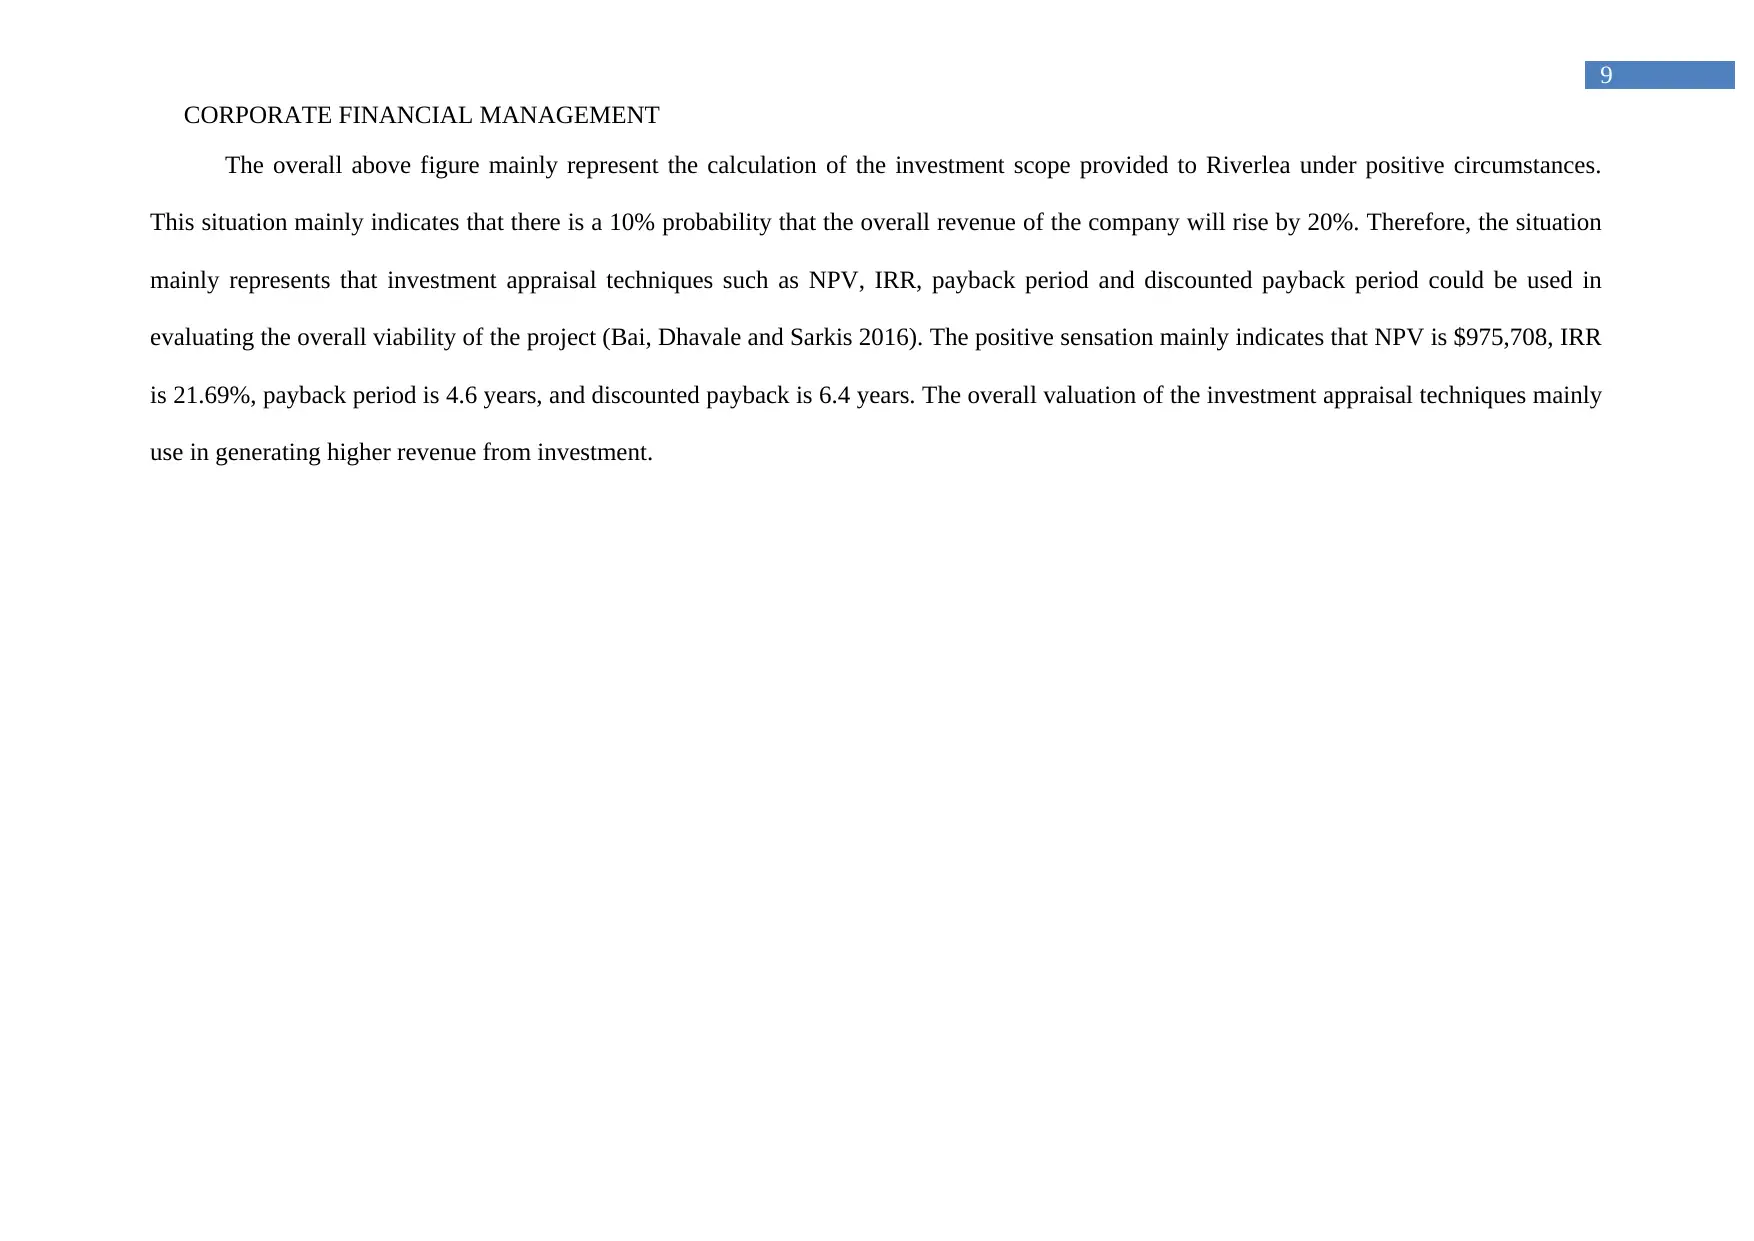
The overall above figure mainly represent the calculation of the investment scope provided to Riverlea under positive circumstances.
This situation mainly indicates that there is a 10% probability that the overall revenue of the company will rise by 20%. Therefore, the situation
mainly represents that investment appraisal techniques such as NPV, IRR, payback period and discounted payback period could be used in
evaluating the overall viability of the project (Bai, Dhavale and Sarkis 2016). The positive sensation mainly indicates that NPV is $975,708, IRR
is 21.69%, payback period is 4.6 years, and discounted payback is 6.4 years. The overall valuation of the investment appraisal techniques mainly
use in generating higher revenue from investment.
9
The overall above figure mainly represent the calculation of the investment scope provided to Riverlea under positive circumstances.
This situation mainly indicates that there is a 10% probability that the overall revenue of the company will rise by 20%. Therefore, the situation
mainly represents that investment appraisal techniques such as NPV, IRR, payback period and discounted payback period could be used in
evaluating the overall viability of the project (Bai, Dhavale and Sarkis 2016). The positive sensation mainly indicates that NPV is $975,708, IRR
is 21.69%, payback period is 4.6 years, and discounted payback is 6.4 years. The overall valuation of the investment appraisal techniques mainly
use in generating higher revenue from investment.
Paraphrase This Document
Need a fresh take? Get an instant paraphrase of this document with our AI Paraphraser
CORPORATE FINANCIAL MANAGEMENT
10
3. Concussion and Recommendations:
From the overall evaluation of the investment opportunity, which is presented to
Riverlea is a viable approach. In addition, the overall investment analysis is mainly
conducted on different scenarios, where the range of income that could be presented from
investment is depicted. The investment appraisal techniques mainly represent the overall
financial stability of the new project, which could increase firm value in future. Therefore, it
is advisable to Riverlea to commence with the production of confectionaries in their
production function.
Part 2:
1. Introduction:
The relevant evaluation is mainly conducted on the share price movement of Riverlea
after the announcement of extra income that will be generated in near future. In addition, the
overall valuation could mainly indicate overall impact of the announcement, which is
conducted on the share price of the company. Relevant calculation is mainly conducted to
detect the probability of the share price value after the announcement.
CORPORATE FINANCIAL MANAGEMENT
11
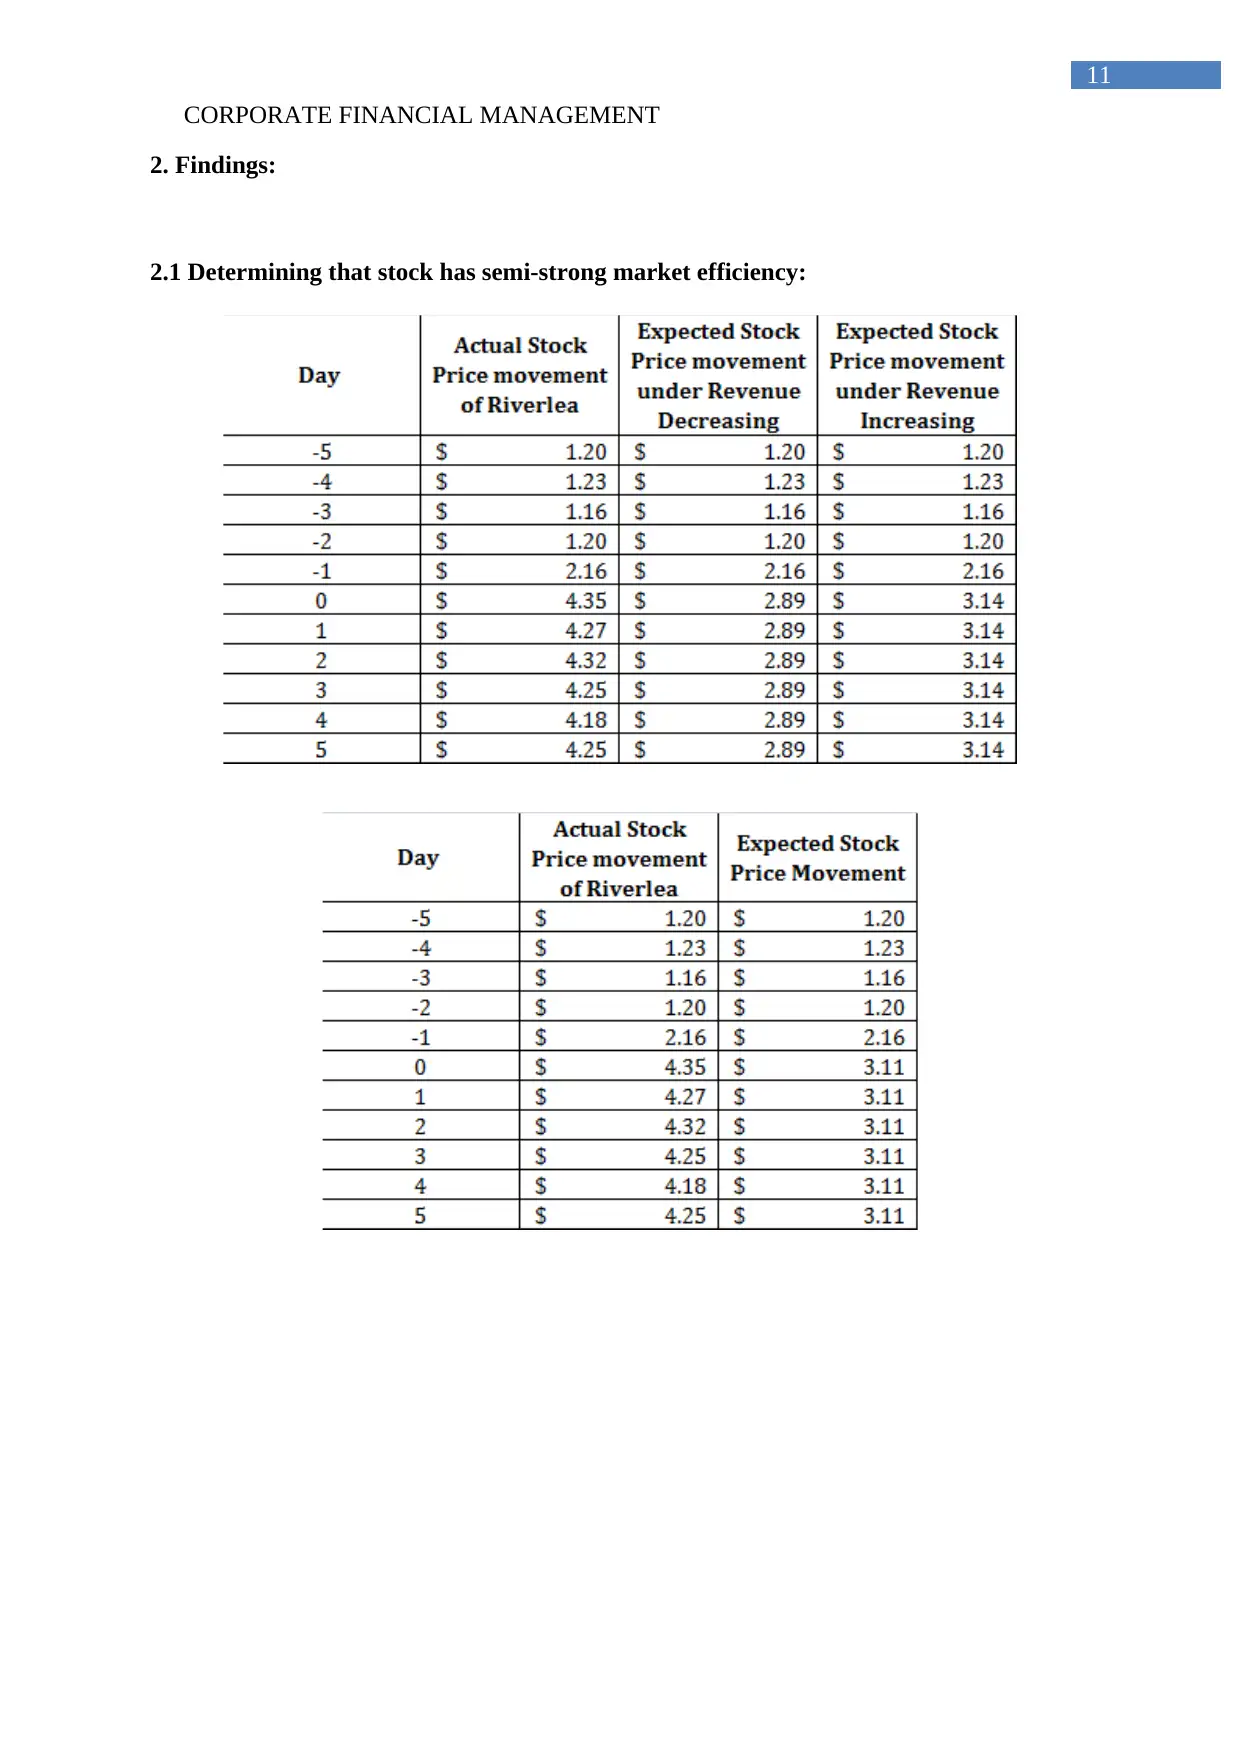
2. Findings:
2.1 Determining that stock has semi-strong market efficiency:
11
2. Findings:
2.1 Determining that stock has semi-strong market efficiency:
⊘ This is a preview!⊘
Do you want full access?
Subscribe today to unlock all pages.
Trusted by 1+ million students worldwide
1 out of 16
Related Documents


Your All-in-One AI-Powered Toolkit for Academic Success.
+13062052269
info@desklib.com
Available 24*7 on WhatsApp / Email
![[object Object]](/_next/static/media/star-bottom.7253800d.svg)
Unlock your academic potential
Copyright © 2020–2026 A2Z Services. All Rights Reserved. Developed and managed by ZUCOL.