Corporate Finance Solutions
VerifiedAdded on 2020/01/06
|29
|6957
|55
Report
AI Summary
This report provides solutions to a corporate finance assignment. It covers several key topics, including portfolio theory, where the annualized return, risk profiles of different securities (Zoom Plc, Munch Plc, Market Index, and 3-month government bills), and the impact of correlation coefficients are analyzed. The report also delves into the time value of money, calculating future and present values and making investment decisions based on these calculations. Furthermore, it explores behavioral finance concepts such as overconfidence and overoptimism, contrasting them with traditional finance approaches. Finally, the report discusses the efficient market hypothesis and how market information and company-specific news affect share prices.

CORPORATE FINANCE
1
1
Paraphrase This Document
Need a fresh take? Get an instant paraphrase of this document with our AI Paraphraser

TABLE OF CONTENTS
QUESTION 1.......................................................................................................................................3
A) Calculation of annualized return.................................................................................................3
B) Reasons for differences in risk and return profile of securities..................................................4
C) Graphical presentation................................................................................................................4
D) Re-calculation of risk and returns of two set portfolio at two different correlation coefficient 6
E) Understanding of risk and return and the importance of correlation coefficient........................7
QUESTION 2.......................................................................................................................................8
A) (1) Computation of future value ................................................................................................8
2. Calculation of present value........................................................................................................9
3. Appropriate decisions..................................................................................................................9
2(B) Required calculations............................................................................................................10
(1) ..................................................................................................................................................10
(2) ..................................................................................................................................................10
(3) ..................................................................................................................................................10
(4)...................................................................................................................................................11
2(C) (1) Behavioural finance concepts..........................................................................................11
(2) Discuss how an investor practices traditional finance to challenge each three concepts.........12
QUESTION 3.....................................................................................................................................12
REFERENCES...................................................................................................................................14
APPENDIX........................................................................................................................................16
2

INDEX OF TABLES
Table 1: Calculation of annualised return ............................................................................................4
Table 2: Calculation of portfolio risk and return .................................................................................7
Table 3: Calculation of portfolio risk and return .................................................................................8
Table 4: Calculation of monthly instalments .....................................................................................11
Table 5: Calculations of monthly payment after re-finance ..............................................................11
Table 6: Calculation to pay the mortgage after re-finance ................................................................12
Table 7: Calculation of additional cash need to borrow as re-financing ...........................................12
3
⊘ This is a preview!⊘
Do you want full access?
Subscribe today to unlock all pages.
Trusted by 1+ million students worldwide
QUESTION 1
Portfolio theory is a quantitative analysis which demonstrates the way in which an investor
can diversify their investment portfolio so as to minimize their risk and maximize returns. With the
help of this, capitalists can decide an optimum portfolio which will yield higher returns to them.
This theory comprises of four facets that are valuation of individual security by making risk and
return evaluation, assets allocation, portfolio optimization and performance measurement (Byers,
Groth and Sakao, 2015). According to the theory, share capital expected return includes both
dividend and capital appreciation (increase in stock price). However, yield on debt instrument
comprises of capital appreciation due to fall in interest rate, timely instalment payments and
repayment of principal amount at the time of maturity. On contrary to this, risk indicates the
possibility of variability in return which is highly based upon historical volatility (Thompson,
2016). This theory states that investors can hold a diversified portfolio by investing funds in
different securities in which the possibility of risk and return is different. By this, investor can make
qualitative decisions in order to get higher returns on investment (Chen, 2016). This task will make
risk and return analysis that is associated in a low cost airline, Zoom Plc., national chain of high
street cafes and bistros, Munch Plc., Market Index and three-month government bills as well.
A) Calculation of annualized return
As name implies, the amount of profit which an investor can earn on their securities during
one year is called as an annualised return (Altman and et.al., 2014). It is important for an investor to
determine the possibility of yield on their potential investment.
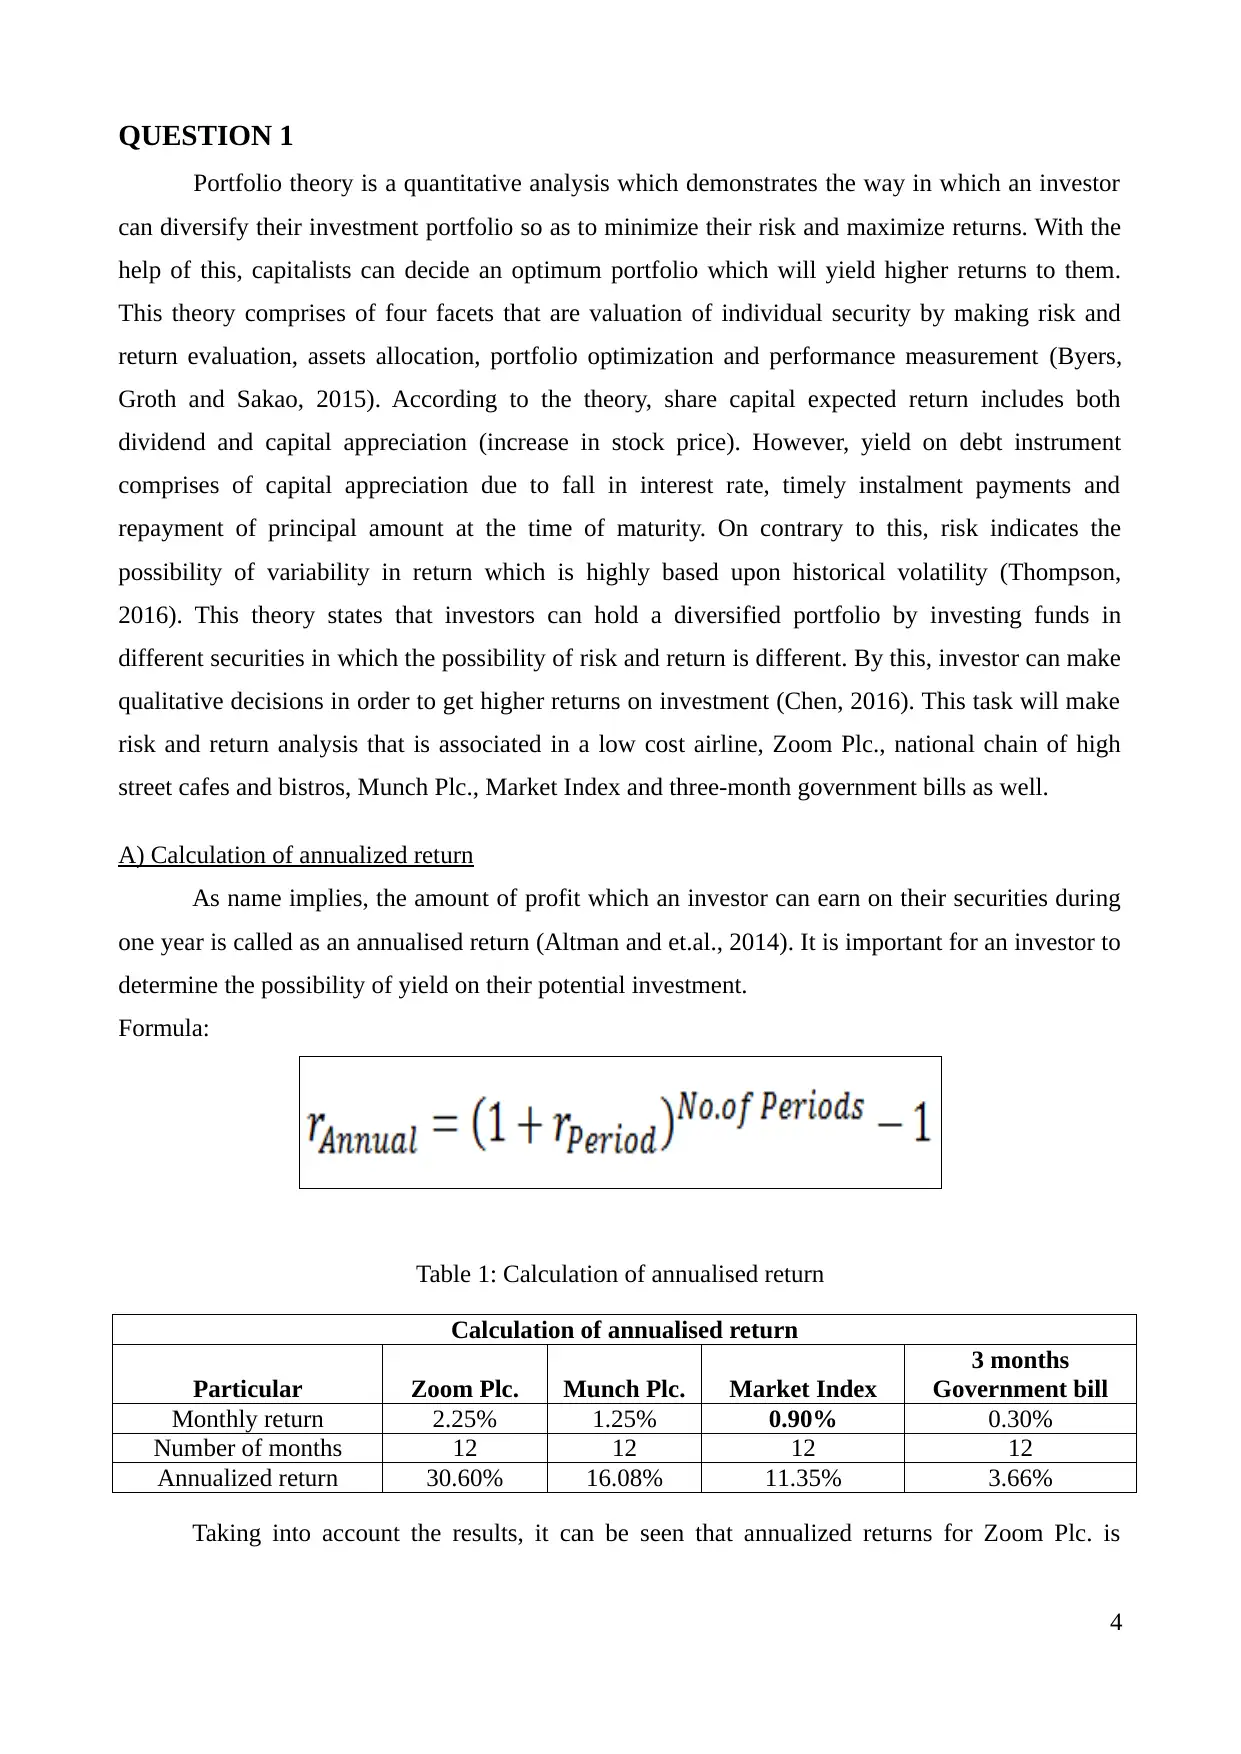
Formula:
Table 1: Calculation of annualised return
Calculation of annualised return
Particular Zoom Plc. Munch Plc. Market Index
3 months
Government bill
Monthly return 2.25% 1.25% 0.90% 0.30%
Number of months 12 12 12 12
Annualized return 30.60% 16.08% 11.35% 3.66%
Taking into account the results, it can be seen that annualized returns for Zoom Plc. is
4
Portfolio theory is a quantitative analysis which demonstrates the way in which an investor
can diversify their investment portfolio so as to minimize their risk and maximize returns. With the
help of this, capitalists can decide an optimum portfolio which will yield higher returns to them.
This theory comprises of four facets that are valuation of individual security by making risk and
return evaluation, assets allocation, portfolio optimization and performance measurement (Byers,
Groth and Sakao, 2015). According to the theory, share capital expected return includes both
dividend and capital appreciation (increase in stock price). However, yield on debt instrument
comprises of capital appreciation due to fall in interest rate, timely instalment payments and
repayment of principal amount at the time of maturity. On contrary to this, risk indicates the
possibility of variability in return which is highly based upon historical volatility (Thompson,
2016). This theory states that investors can hold a diversified portfolio by investing funds in
different securities in which the possibility of risk and return is different. By this, investor can make
qualitative decisions in order to get higher returns on investment (Chen, 2016). This task will make
risk and return analysis that is associated in a low cost airline, Zoom Plc., national chain of high
street cafes and bistros, Munch Plc., Market Index and three-month government bills as well.
A) Calculation of annualized return
As name implies, the amount of profit which an investor can earn on their securities during
one year is called as an annualised return (Altman and et.al., 2014). It is important for an investor to
determine the possibility of yield on their potential investment.
Formula:
Table 1: Calculation of annualised return
Calculation of annualised return
Particular Zoom Plc. Munch Plc. Market Index
3 months
Government bill
Monthly return 2.25% 1.25% 0.90% 0.30%
Number of months 12 12 12 12
Annualized return 30.60% 16.08% 11.35% 3.66%
Taking into account the results, it can be seen that annualized returns for Zoom Plc. is
4
Paraphrase This Document
Need a fresh take? Get an instant paraphrase of this document with our AI Paraphraser
comparatively greater to 30.60%. However, in Munch Plc., Market Index and 3-month government
bills, yield possibilities are 16.08%, 11.35% and 3.66% respectively. Henceforth, it can be said that
investment in Zoom Plc. will deliver higher returns to the potential investors as compared to other
securities. Although, it provides a basic idea about future returns, but still, it has several limitation.
One of the most important drawback is, it cannot be ensured that money can be reinvested at same
rate of interest in the next month. It may either increase or decrease over the next period. Thus, in
such a case, it does not provide realistic and valid results to the investors.
B) Reasons for differences in risk and return profile of securities
Risk indicates the possibility that actual returns of security may be lower than expected
however, return is the chance of future profit or yield on securities. In other words, variability in
anticipated return represents the total risk involved in securities (Kresta and Tichy, 2012). With
respect to the scenario, individual and market risk and return profile are affected by the external
volatility such as economic recession, inflation, political instability, industrial growth, scams,
changes in government policies and interest rate. However, on the other hand, securities
unsystematic risk comprises factors like business performance, managerial inefficiency, scarcity of
resource, strike, financial difficulties and uncertainty. Besides this, it is also influenced by the rate
of dividend and capital gain as well (Shim, 2013). On the contrary, government bill prices are
affected by the economic conditions, supply and demand forces as well as through monetary policy.
C) Graphical presentation
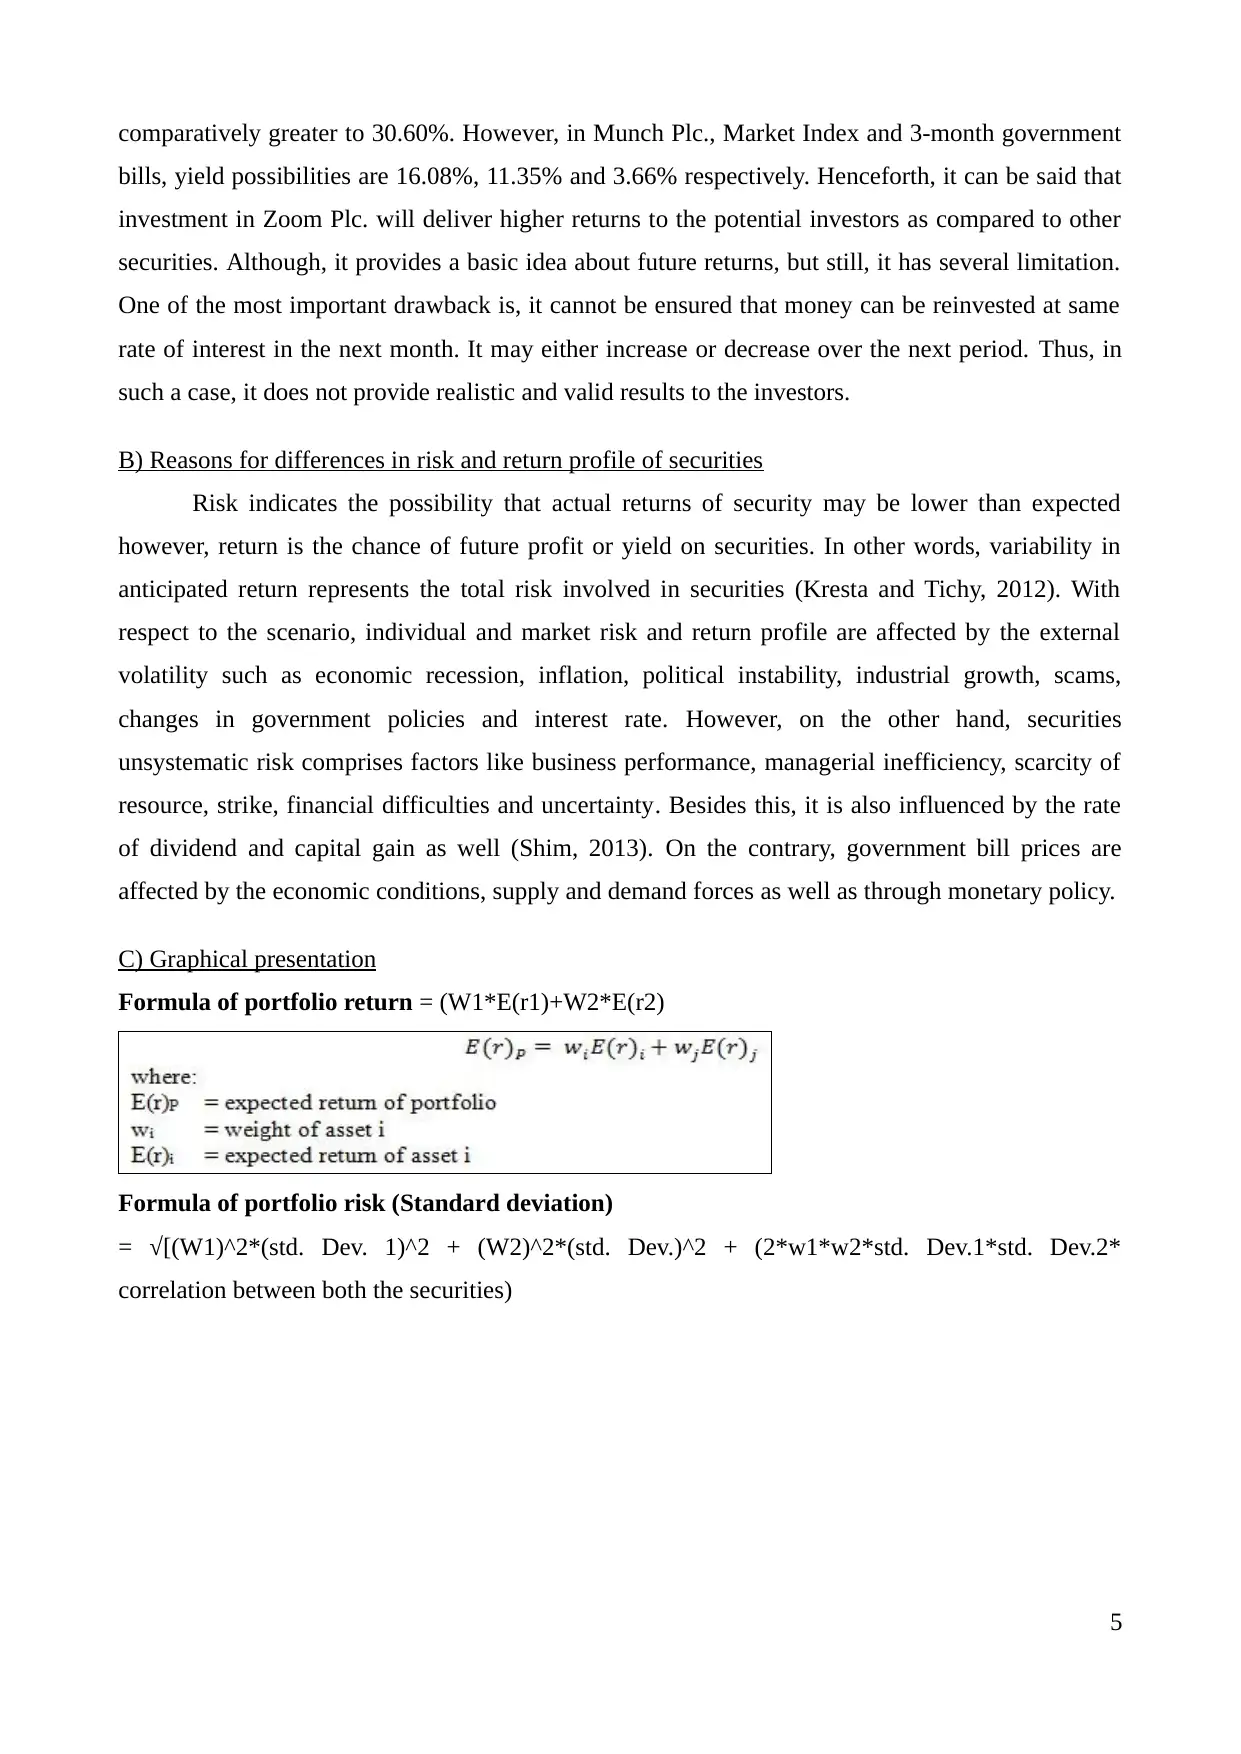
Formula of portfolio return = (W1*E(r1)+W2*E(r2)
Formula of portfolio risk (Standard deviation)
= √[(W1)^2*(std. Dev. 1)^2 + (W2)^2*(std. Dev.)^2 + (2*w1*w2*std. Dev.1*std. Dev.2*
correlation between both the securities)
5
bills, yield possibilities are 16.08%, 11.35% and 3.66% respectively. Henceforth, it can be said that
investment in Zoom Plc. will deliver higher returns to the potential investors as compared to other
securities. Although, it provides a basic idea about future returns, but still, it has several limitation.
One of the most important drawback is, it cannot be ensured that money can be reinvested at same
rate of interest in the next month. It may either increase or decrease over the next period. Thus, in
such a case, it does not provide realistic and valid results to the investors.
B) Reasons for differences in risk and return profile of securities
Risk indicates the possibility that actual returns of security may be lower than expected
however, return is the chance of future profit or yield on securities. In other words, variability in
anticipated return represents the total risk involved in securities (Kresta and Tichy, 2012). With
respect to the scenario, individual and market risk and return profile are affected by the external
volatility such as economic recession, inflation, political instability, industrial growth, scams,
changes in government policies and interest rate. However, on the other hand, securities
unsystematic risk comprises factors like business performance, managerial inefficiency, scarcity of
resource, strike, financial difficulties and uncertainty. Besides this, it is also influenced by the rate
of dividend and capital gain as well (Shim, 2013). On the contrary, government bill prices are
affected by the economic conditions, supply and demand forces as well as through monetary policy.
C) Graphical presentation
Formula of portfolio return = (W1*E(r1)+W2*E(r2)
Formula of portfolio risk (Standard deviation)
= √[(W1)^2*(std. Dev. 1)^2 + (W2)^2*(std. Dev.)^2 + (2*w1*w2*std. Dev.1*std. Dev.2*
correlation between both the securities)
5
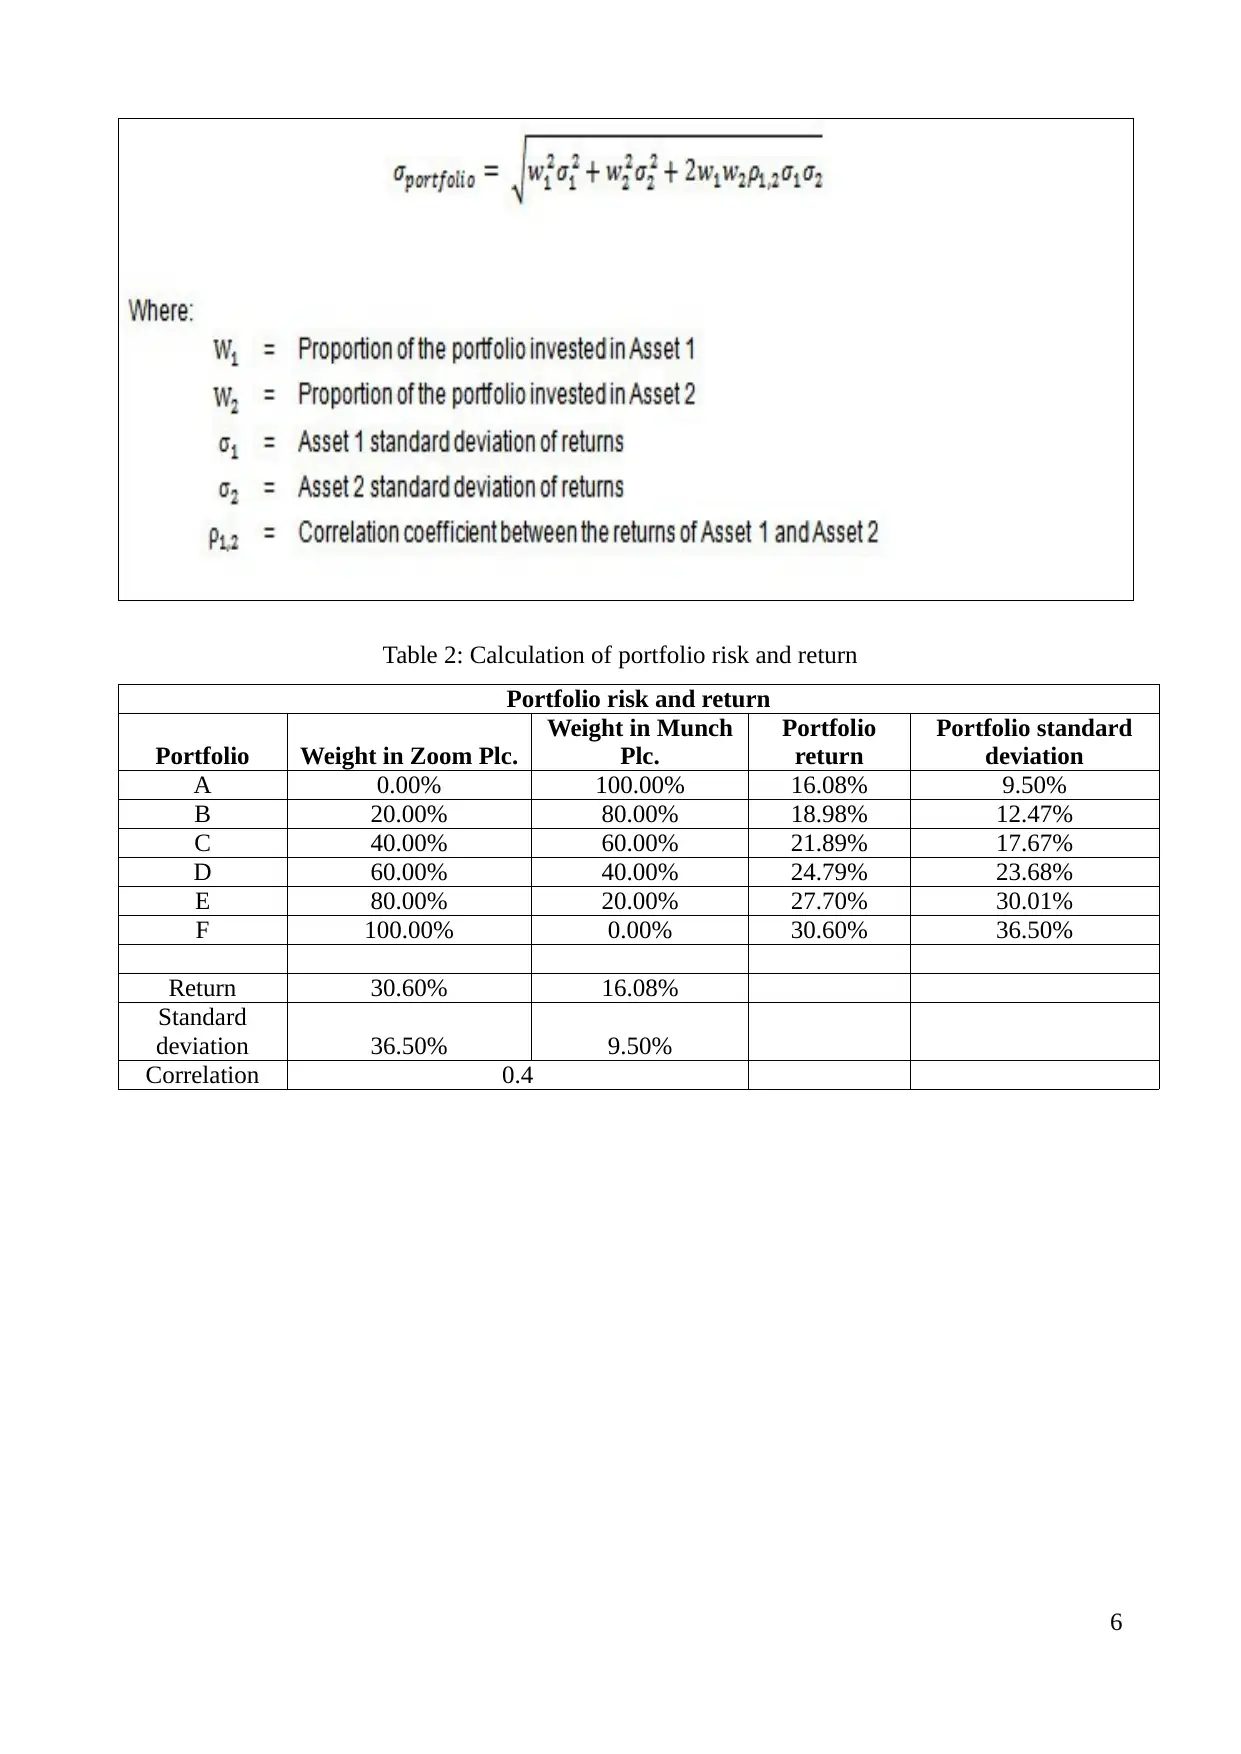
Table 2: Calculation of portfolio risk and return
Portfolio risk and return
Portfolio Weight in Zoom Plc.
Weight in Munch
Plc.
Portfolio
return
Portfolio standard
deviation
A 0.00% 100.00% 16.08% 9.50%
B 20.00% 80.00% 18.98% 12.47%
C 40.00% 60.00% 21.89% 17.67%
D 60.00% 40.00% 24.79% 23.68%
E 80.00% 20.00% 27.70% 30.01%
F 100.00% 0.00% 30.60% 36.50%
Return 30.60% 16.08%
Standard
deviation 36.50% 9.50%
Correlation 0.4
6
⊘ This is a preview!⊘
Do you want full access?
Subscribe today to unlock all pages.
Trusted by 1+ million students worldwide
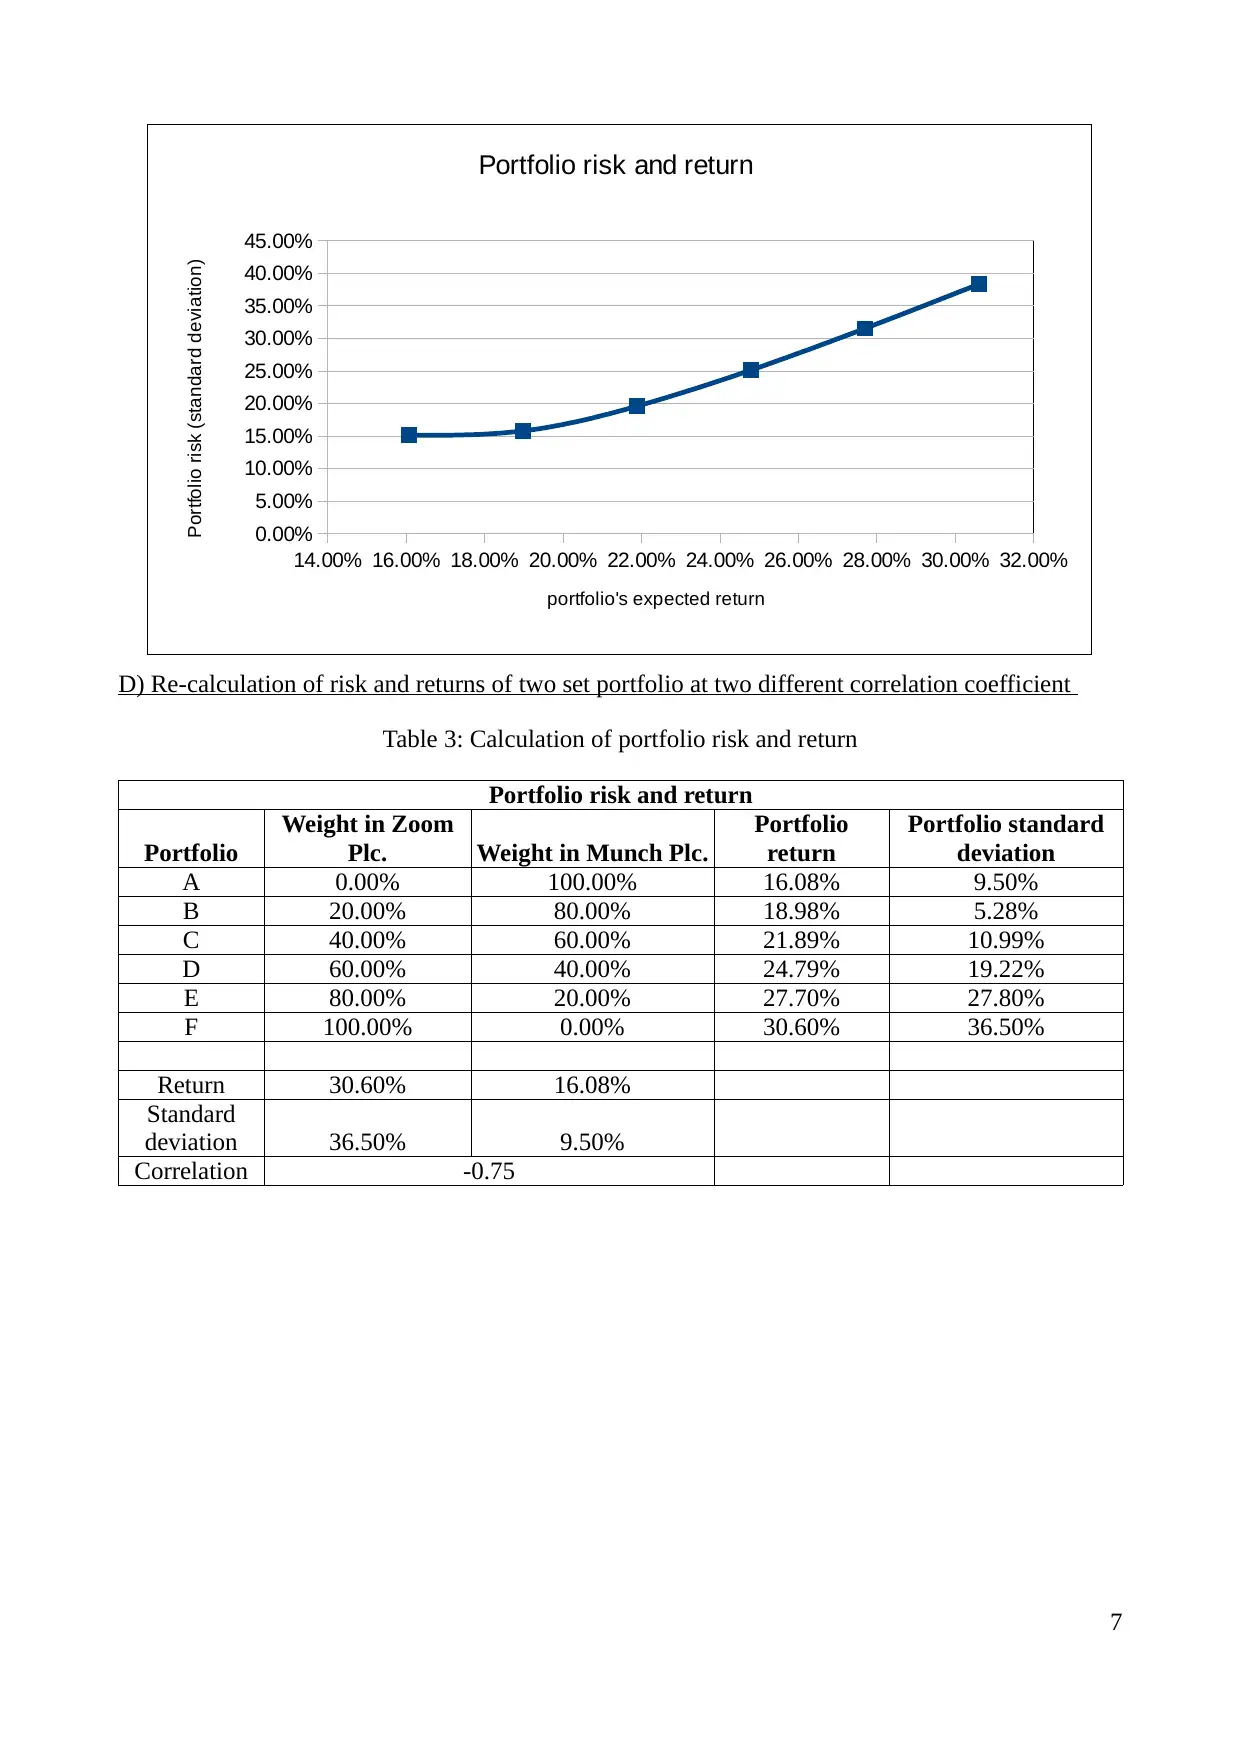
D) Re-calculation of risk and returns of two set portfolio at two different correlation coefficient
Table 3: Calculation of portfolio risk and return
Portfolio risk and return
Portfolio
Weight in Zoom
Plc. Weight in Munch Plc.
Portfolio
return
Portfolio standard
deviation
A 0.00% 100.00% 16.08% 9.50%
B 20.00% 80.00% 18.98% 5.28%
C 40.00% 60.00% 21.89% 10.99%
D 60.00% 40.00% 24.79% 19.22%
E 80.00% 20.00% 27.70% 27.80%
F 100.00% 0.00% 30.60% 36.50%
Return 30.60% 16.08%
Standard
deviation 36.50% 9.50%
Correlation -0.75
7
14.00% 16.00% 18.00% 20.00% 22.00% 24.00% 26.00% 28.00% 30.00% 32.00%
0.00%
5.00%
10.00%
15.00%
20.00%
25.00%
30.00%
35.00%
40.00%
45.00%
Portfolio risk and return
portfolio's expected return
Portfolio risk (standard deviation)
Paraphrase This Document
Need a fresh take? Get an instant paraphrase of this document with our AI Paraphraser

Optimal portfolio: As per the results found, it can be seen that minimum level of risk exists
when investors put their 100% money in Munch Plc. as at that level, portfolio's standard deviation
is 9.50% henceforth, for risk averse investors, it will be an optimal portfolio. On the contrary to this,
average risk and returns of both Zoom and Munch Plc. are 23.34% and 23.00% respectively.
Therefore, from the table, it can be said that combination “D” is an optimum level at which W1 is
60% and W2 is 40%. It is because, at this level, portfolio's expected returns and risk are 24.79% and
23.68% which indicate an acceptable or affordable level of risk.
D) Re-calculation of risk and returns of two set portfolio at two different correlation coefficient
Table 4: Calculation of portfolio risk and return
Portfolio risk and return
Portfolio
Weight in Zoom
Plc. Weight in Munch Plc.
Portfolio
return
Portfolio standard
deviation
A 0.00% 100.00% 16.08% 9.50%
B 20.00% 80.00% 18.98% 5.28%
C 40.00% 60.00% 21.89% 10.99%
D 60.00% 40.00% 24.79% 19.22%
E 80.00% 20.00% 27.70% 27.80%
F 100.00% 0.00% 30.60% 36.50%
Return 30.60% 16.08%
Standard
deviation 36.50% 9.50%
Correlation -0.75
8
14.00% 16.00% 18.00% 20.00% 22.00% 24.00% 26.00% 28.00% 30.00% 32.00%
0.00%
5.00%
10.00%
15.00%
20.00%
25.00%
30.00%
35.00%
40.00%
45.00%
Portfolio risk and return
portfolio's expected return
Portfolio risk (standard deviation)
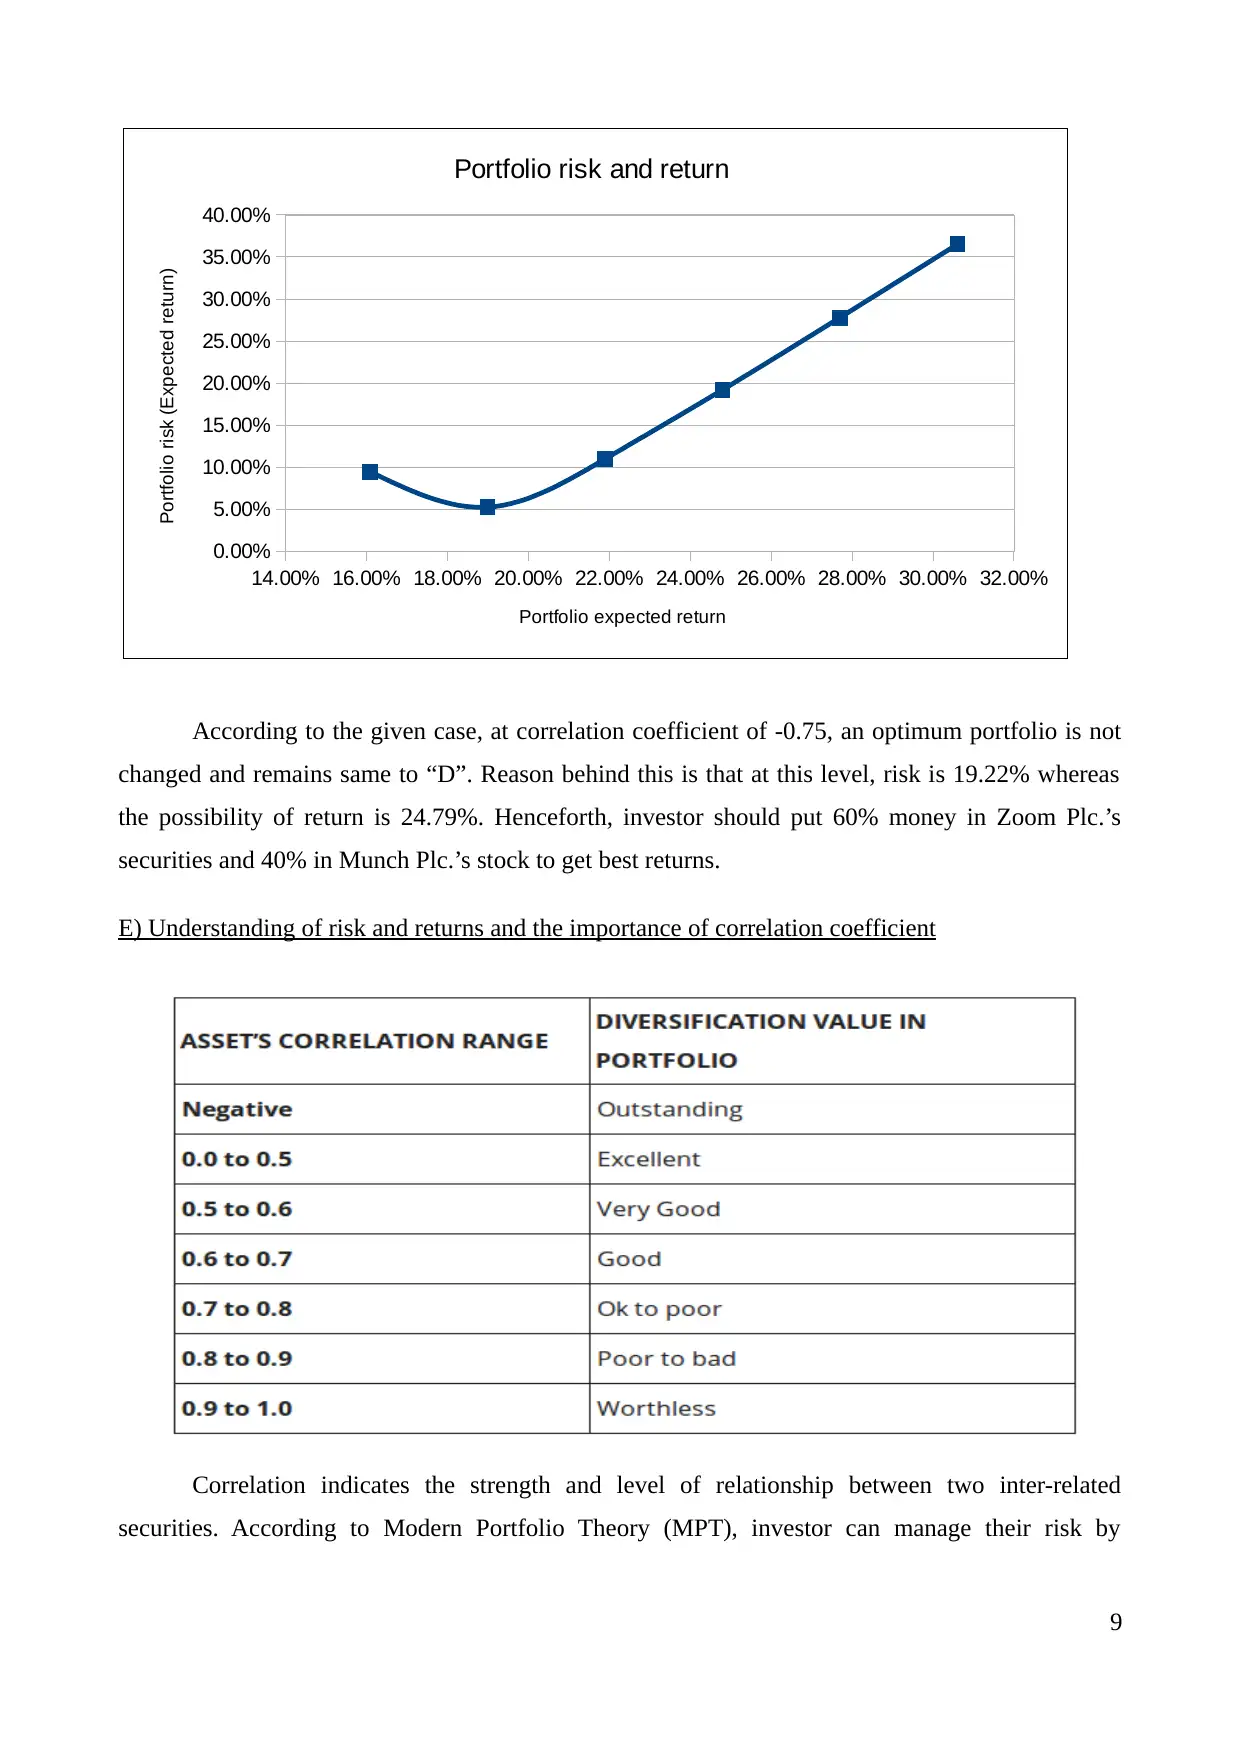
According to the given case, at correlation coefficient of -0.75, an optimum portfolio is not
changed and remains same to “D”. Reason behind this is that at this level, risk is 19.22% whereas
the possibility of return is 24.79%. Henceforth, investor should put 60% money in Zoom Plc.’s
securities and 40% in Munch Plc.’s stock to get best returns.
E) Understanding of risk and returns and the importance of correlation coefficient
Correlation indicates the strength and level of relationship between two inter-related
securities. According to Modern Portfolio Theory (MPT), investor can manage their risk by
9
14.00% 16.00% 18.00% 20.00% 22.00% 24.00% 26.00% 28.00% 30.00% 32.00%
0.00%
5.00%
10.00%
15.00%
20.00%
25.00%
30.00%
35.00%
40.00%
Portfolio risk and return
Portfolio expected return
Portfolio risk (Expected return)
⊘ This is a preview!⊘
Do you want full access?
Subscribe today to unlock all pages.
Trusted by 1+ million students worldwide
declining the correlation coefficient between returns of both; Zoom and Munch Plc.’s securities.
Goal of this is to create an optimum portfolio or efficient frontier by maximizing the expected
returns at a certain level of risk (Bangzheng and et.al., 2014). Its value ranges from +1 to -1 in
which positive 1 indicates that both securities are directly correlated whilst, -1 indicates that they
are related in an adverse direction.
It plays an important role while making portfolio decisions because as per the model,
capitalists must look for zero level correlations to limit their risk factor. On the other hand, high
value of negative correlation is not considered to be good because increase in one stock price will
decline the price of other securities of portfolio whereas high value of positive relation may also
bring high risk. It is because, if price of one stock gets decline then it will also decrease the price of
other securities. According to the scenario, it can vary from 0.4 to -0.75 due to different reasons.
One of the most important reasons is that portfolio risk can fluctuate due to market volatility and the
correlation is highly based upon it. Reason behind this is that it is computed by taking into account
the standard deviation of both Zoom and Munch Plc.’s share. Hence, at different values, correlation
will be different (Khan and et.al., 2015). Further, varying the possibility of potential returns on
different securities also have a great impact on the relationship between the securities and affect
portfolio decisions. As per the scenario, there is high level of negative correlation to -0.75 which is
not good because 100% increase in one security price will decrease other security's price by 75% or
vice-versa.
QUESTION 2
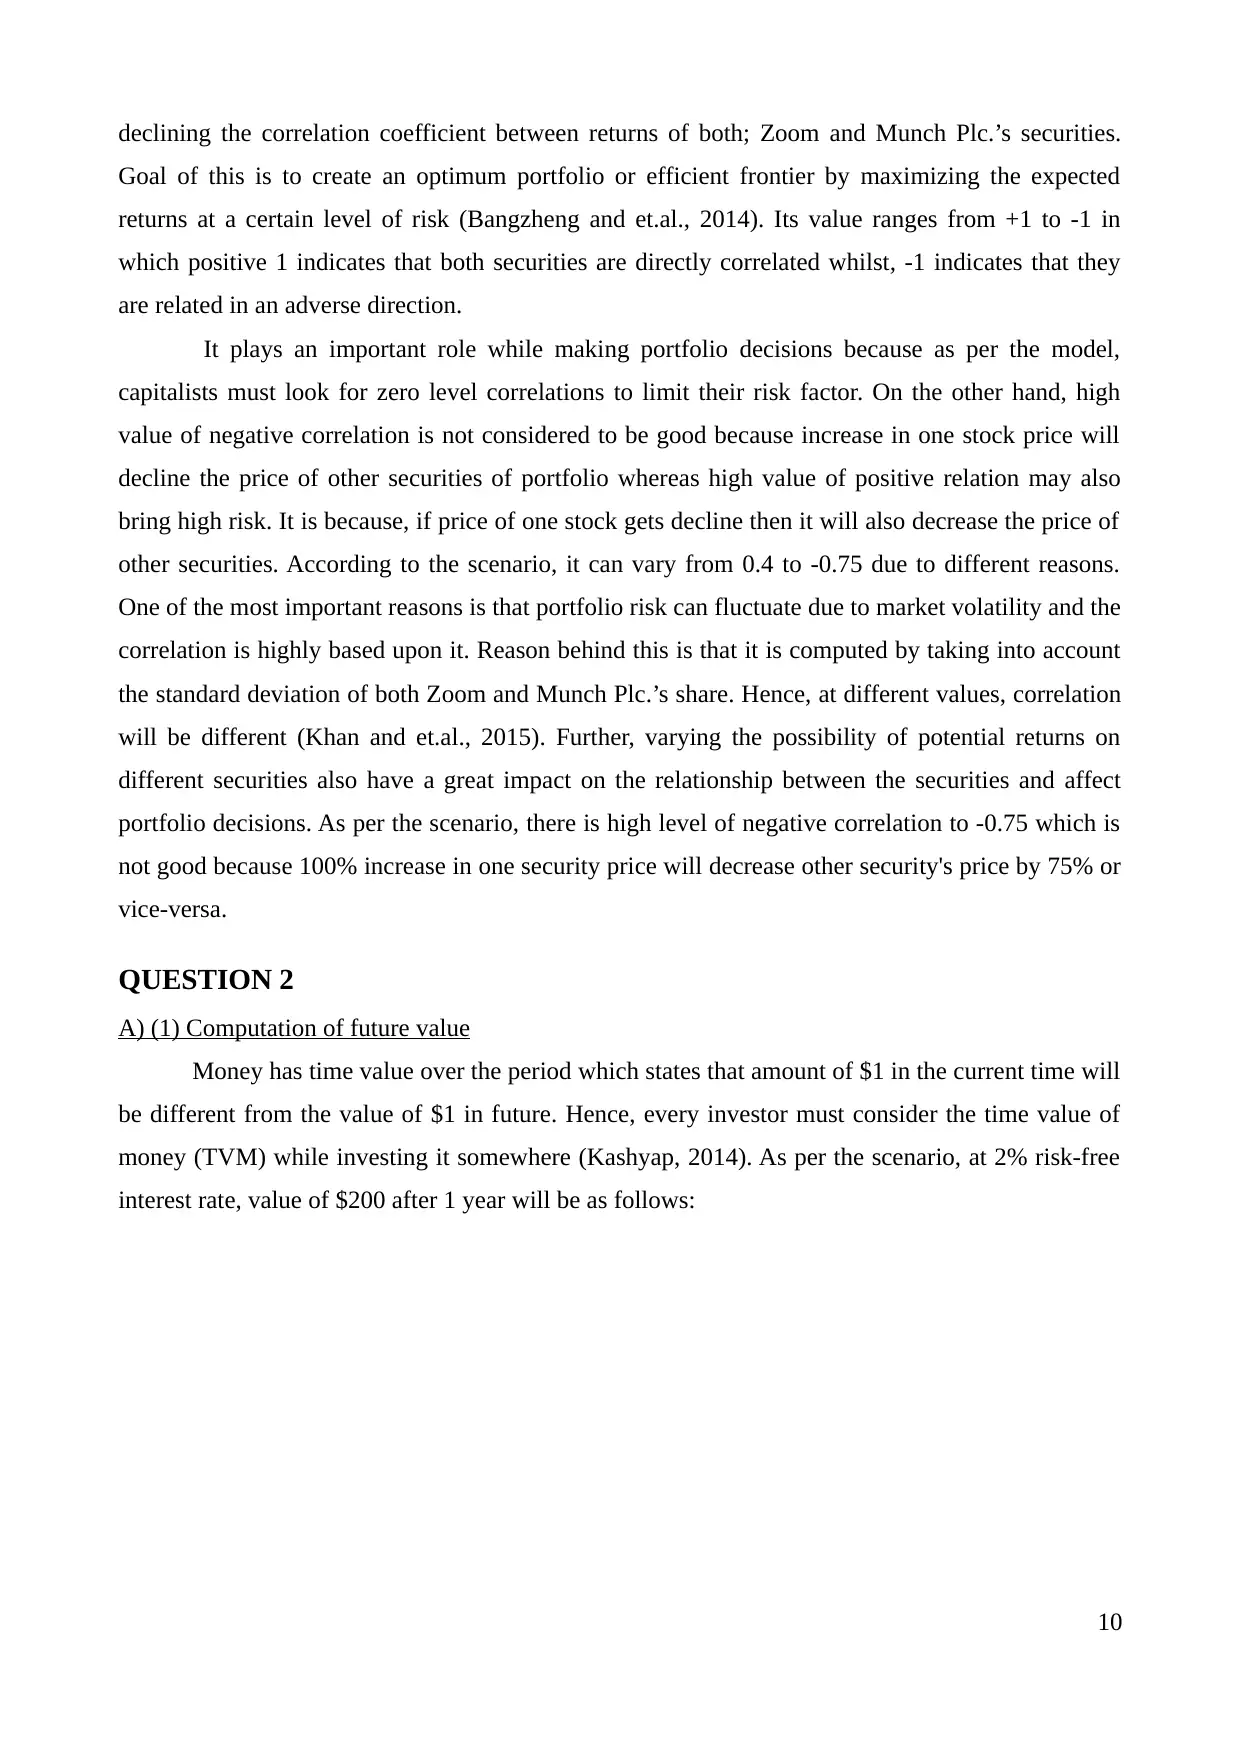
A) (1) Computation of future value
Money has time value over the period which states that amount of $1 in the current time will
be different from the value of $1 in future. Hence, every investor must consider the time value of
money (TVM) while investing it somewhere (Kashyap, 2014). As per the scenario, at 2% risk-free
interest rate, value of $200 after 1 year will be as follows:
10
Goal of this is to create an optimum portfolio or efficient frontier by maximizing the expected
returns at a certain level of risk (Bangzheng and et.al., 2014). Its value ranges from +1 to -1 in
which positive 1 indicates that both securities are directly correlated whilst, -1 indicates that they
are related in an adverse direction.
It plays an important role while making portfolio decisions because as per the model,
capitalists must look for zero level correlations to limit their risk factor. On the other hand, high
value of negative correlation is not considered to be good because increase in one stock price will
decline the price of other securities of portfolio whereas high value of positive relation may also
bring high risk. It is because, if price of one stock gets decline then it will also decrease the price of
other securities. According to the scenario, it can vary from 0.4 to -0.75 due to different reasons.
One of the most important reasons is that portfolio risk can fluctuate due to market volatility and the
correlation is highly based upon it. Reason behind this is that it is computed by taking into account
the standard deviation of both Zoom and Munch Plc.’s share. Hence, at different values, correlation
will be different (Khan and et.al., 2015). Further, varying the possibility of potential returns on
different securities also have a great impact on the relationship between the securities and affect
portfolio decisions. As per the scenario, there is high level of negative correlation to -0.75 which is
not good because 100% increase in one security price will decrease other security's price by 75% or
vice-versa.
QUESTION 2
A) (1) Computation of future value
Money has time value over the period which states that amount of $1 in the current time will
be different from the value of $1 in future. Hence, every investor must consider the time value of
money (TVM) while investing it somewhere (Kashyap, 2014). As per the scenario, at 2% risk-free
interest rate, value of $200 after 1 year will be as follows:
10
Paraphrase This Document
Need a fresh take? Get an instant paraphrase of this document with our AI Paraphraser
FV = $200*(1+2%)^1
= $204
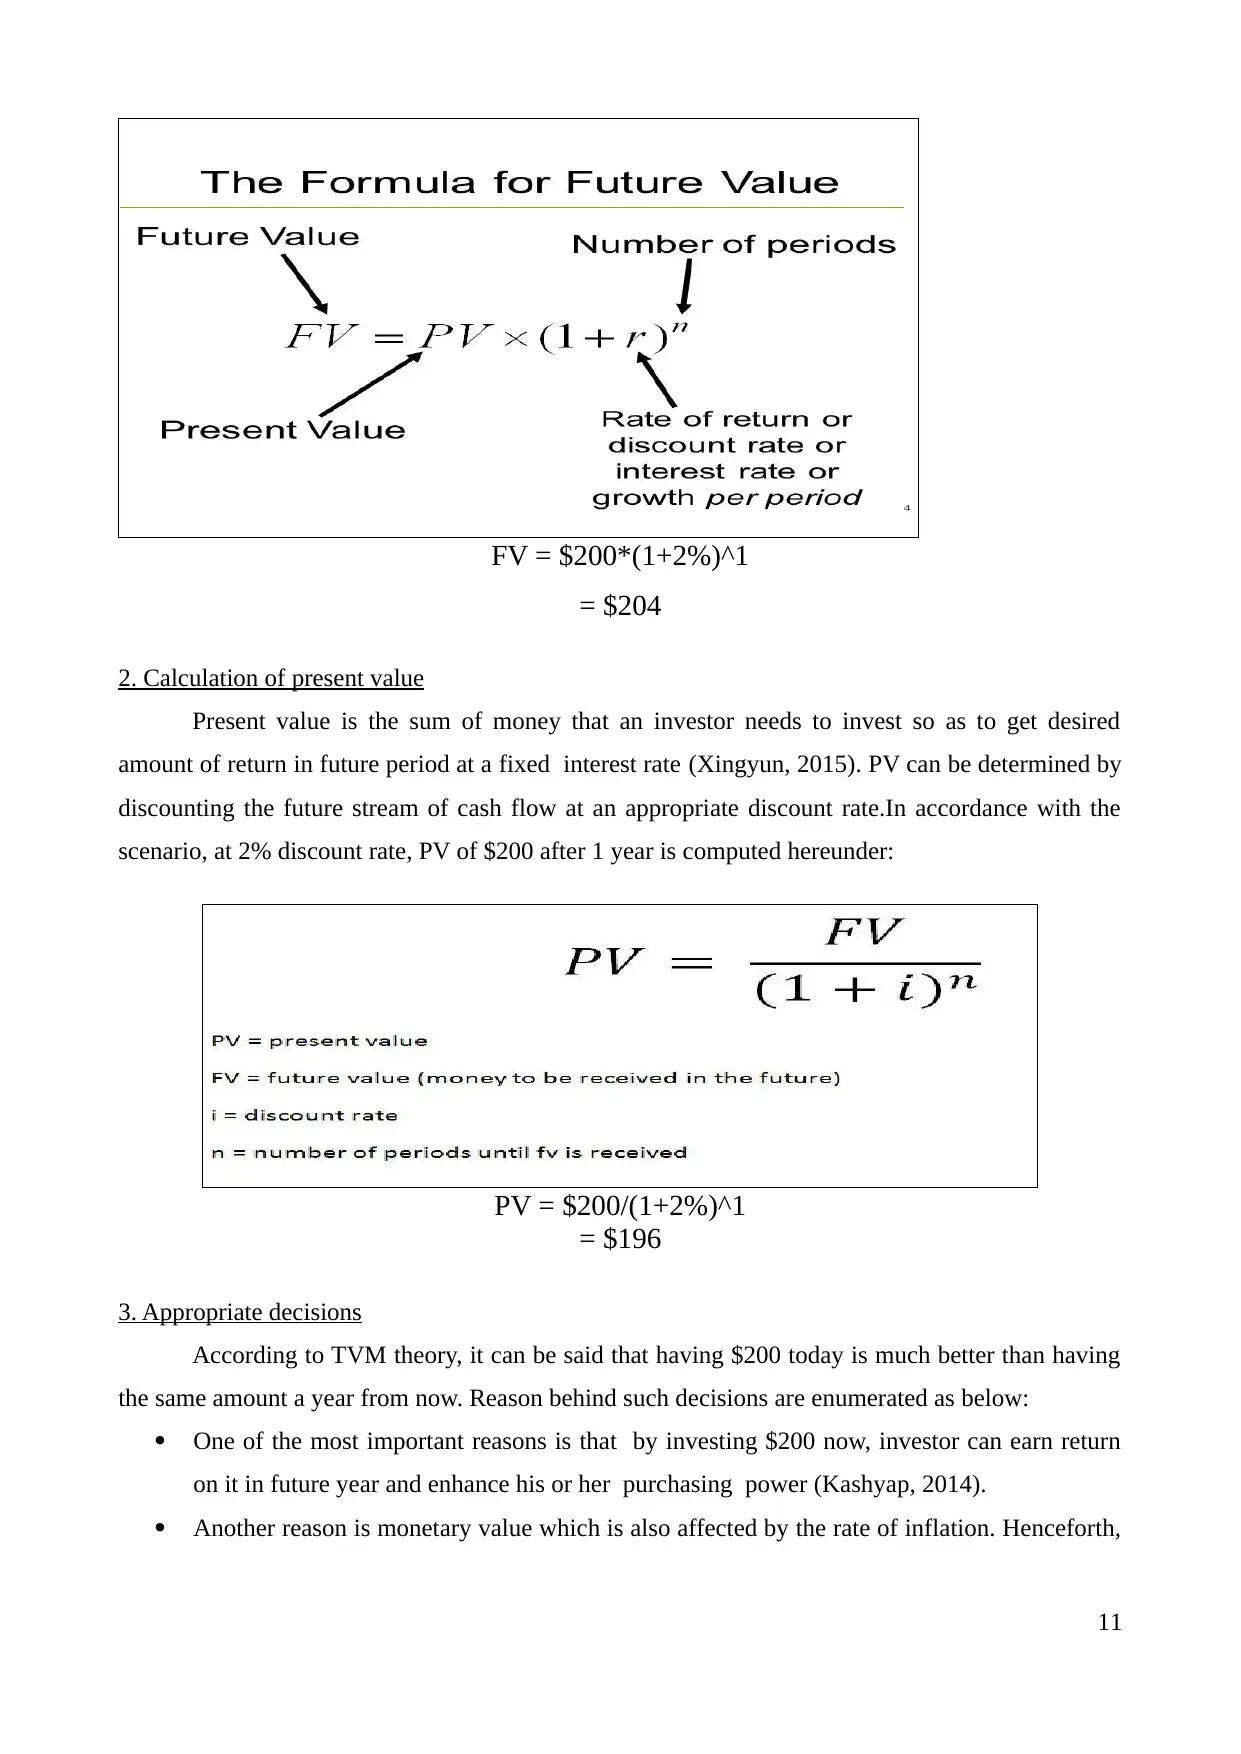
2. Calculation of present value
Present value is the sum of money that an investor needs to invest so as to get desired
amount of return in future period at a fixed interest rate (Xingyun, 2015). PV can be determined by
discounting the future stream of cash flow at an appropriate discount rate.In accordance with the
scenario, at 2% discount rate, PV of $200 after 1 year is computed hereunder:
PV = $200/(1+2%)^1
= $196
3. Appropriate decisions
According to TVM theory, it can be said that having $200 today is much better than having
the same amount a year from now. Reason behind such decisions are enumerated as below:
One of the most important reasons is that by investing $200 now, investor can earn return
on it in future year and enhance his or her purchasing power (Kashyap, 2014).
Another reason is monetary value which is also affected by the rate of inflation. Henceforth,
11
= $204
2. Calculation of present value
Present value is the sum of money that an investor needs to invest so as to get desired
amount of return in future period at a fixed interest rate (Xingyun, 2015). PV can be determined by
discounting the future stream of cash flow at an appropriate discount rate.In accordance with the
scenario, at 2% discount rate, PV of $200 after 1 year is computed hereunder:
PV = $200/(1+2%)^1
= $196
3. Appropriate decisions
According to TVM theory, it can be said that having $200 today is much better than having
the same amount a year from now. Reason behind such decisions are enumerated as below:
One of the most important reasons is that by investing $200 now, investor can earn return
on it in future year and enhance his or her purchasing power (Kashyap, 2014).
Another reason is monetary value which is also affected by the rate of inflation. Henceforth,
11
it can reduce the buying power of dollar over time and make it worthless in the forthcoming
period.
Lastly, with regard to FV, there is always risks involved which reflects that actual return may
be different than the expected return (Present and future value, 2012). However, there is no
risk involved in the present sum of money available to an investor.
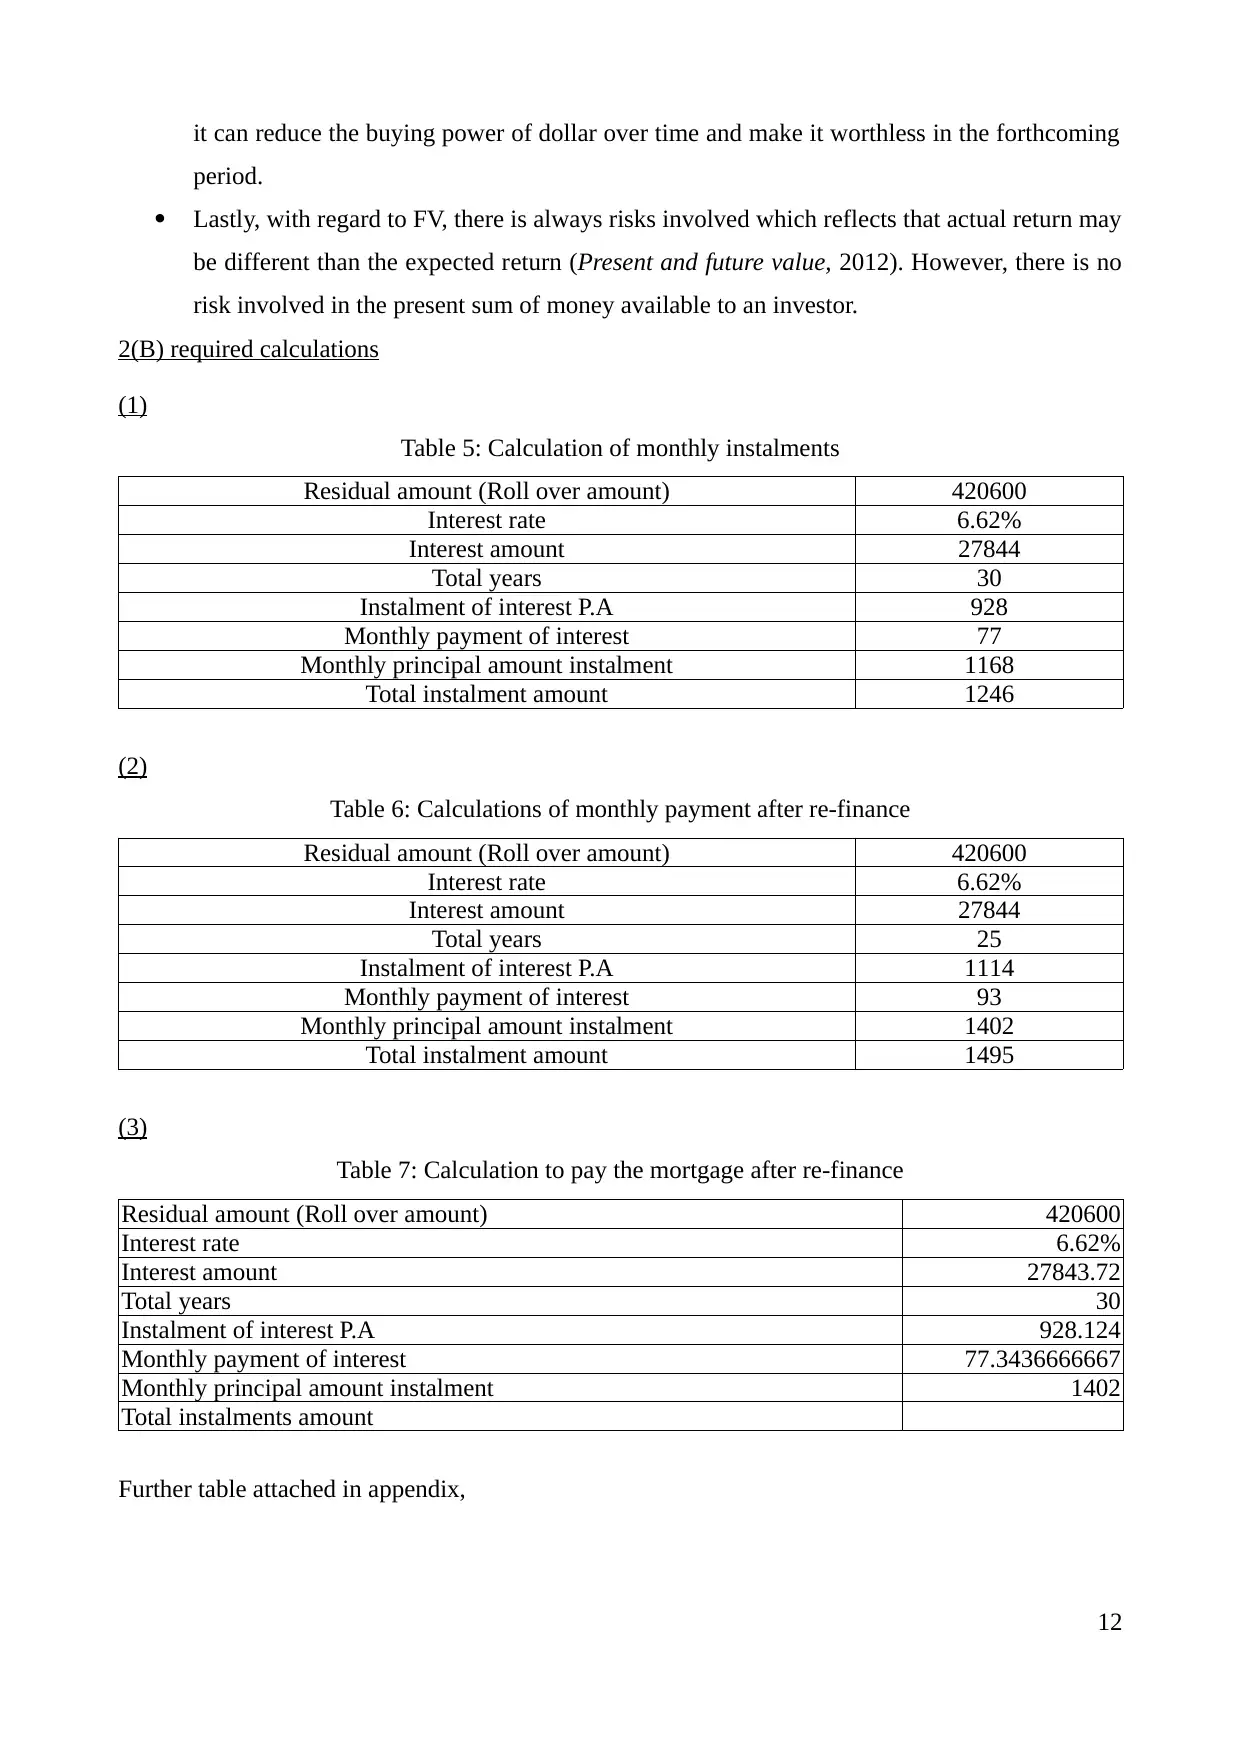
2(B) required calculations
(1)
Table 5: Calculation of monthly instalments
Residual amount (Roll over amount) 420600
Interest rate 6.62%
Interest amount 27844
Total years 30
Instalment of interest P.A 928
Monthly payment of interest 77
Monthly principal amount instalment 1168
Total instalment amount 1246
(2)
Table 6: Calculations of monthly payment after re-finance
Residual amount (Roll over amount) 420600
Interest rate 6.62%
Interest amount 27844
Total years 25
Instalment of interest P.A 1114
Monthly payment of interest 93
Monthly principal amount instalment 1402
Total instalment amount 1495
(3)
Table 7: Calculation to pay the mortgage after re-finance
Residual amount (Roll over amount) 420600
Interest rate 6.62%
Interest amount 27843.72
Total years 30
Instalment of interest P.A 928.124
Monthly payment of interest 77.3436666667
Monthly principal amount instalment 1402
Total instalments amount
Further table attached in appendix,
12
period.
Lastly, with regard to FV, there is always risks involved which reflects that actual return may
be different than the expected return (Present and future value, 2012). However, there is no
risk involved in the present sum of money available to an investor.
2(B) required calculations
(1)
Table 5: Calculation of monthly instalments
Residual amount (Roll over amount) 420600
Interest rate 6.62%
Interest amount 27844
Total years 30
Instalment of interest P.A 928
Monthly payment of interest 77
Monthly principal amount instalment 1168
Total instalment amount 1246
(2)
Table 6: Calculations of monthly payment after re-finance
Residual amount (Roll over amount) 420600
Interest rate 6.62%
Interest amount 27844
Total years 25
Instalment of interest P.A 1114
Monthly payment of interest 93
Monthly principal amount instalment 1402
Total instalment amount 1495
(3)
Table 7: Calculation to pay the mortgage after re-finance
Residual amount (Roll over amount) 420600
Interest rate 6.62%
Interest amount 27843.72
Total years 30
Instalment of interest P.A 928.124
Monthly payment of interest 77.3436666667
Monthly principal amount instalment 1402
Total instalments amount
Further table attached in appendix,
12
⊘ This is a preview!⊘
Do you want full access?
Subscribe today to unlock all pages.
Trusted by 1+ million students worldwide
1 out of 29
Related Documents


Your All-in-One AI-Powered Toolkit for Academic Success.
+13062052269
info@desklib.com
Available 24*7 on WhatsApp / Email
![[object Object]](/_next/static/media/star-bottom.7253800d.svg)
Unlock your academic potential
Copyright © 2020–2026 A2Z Services. All Rights Reserved. Developed and managed by ZUCOL.