Corporate Finance: Stock Analysis of Construction & Financial Ltd
VerifiedAdded on 2023/06/12
|9
|1347
|414
Report
AI Summary
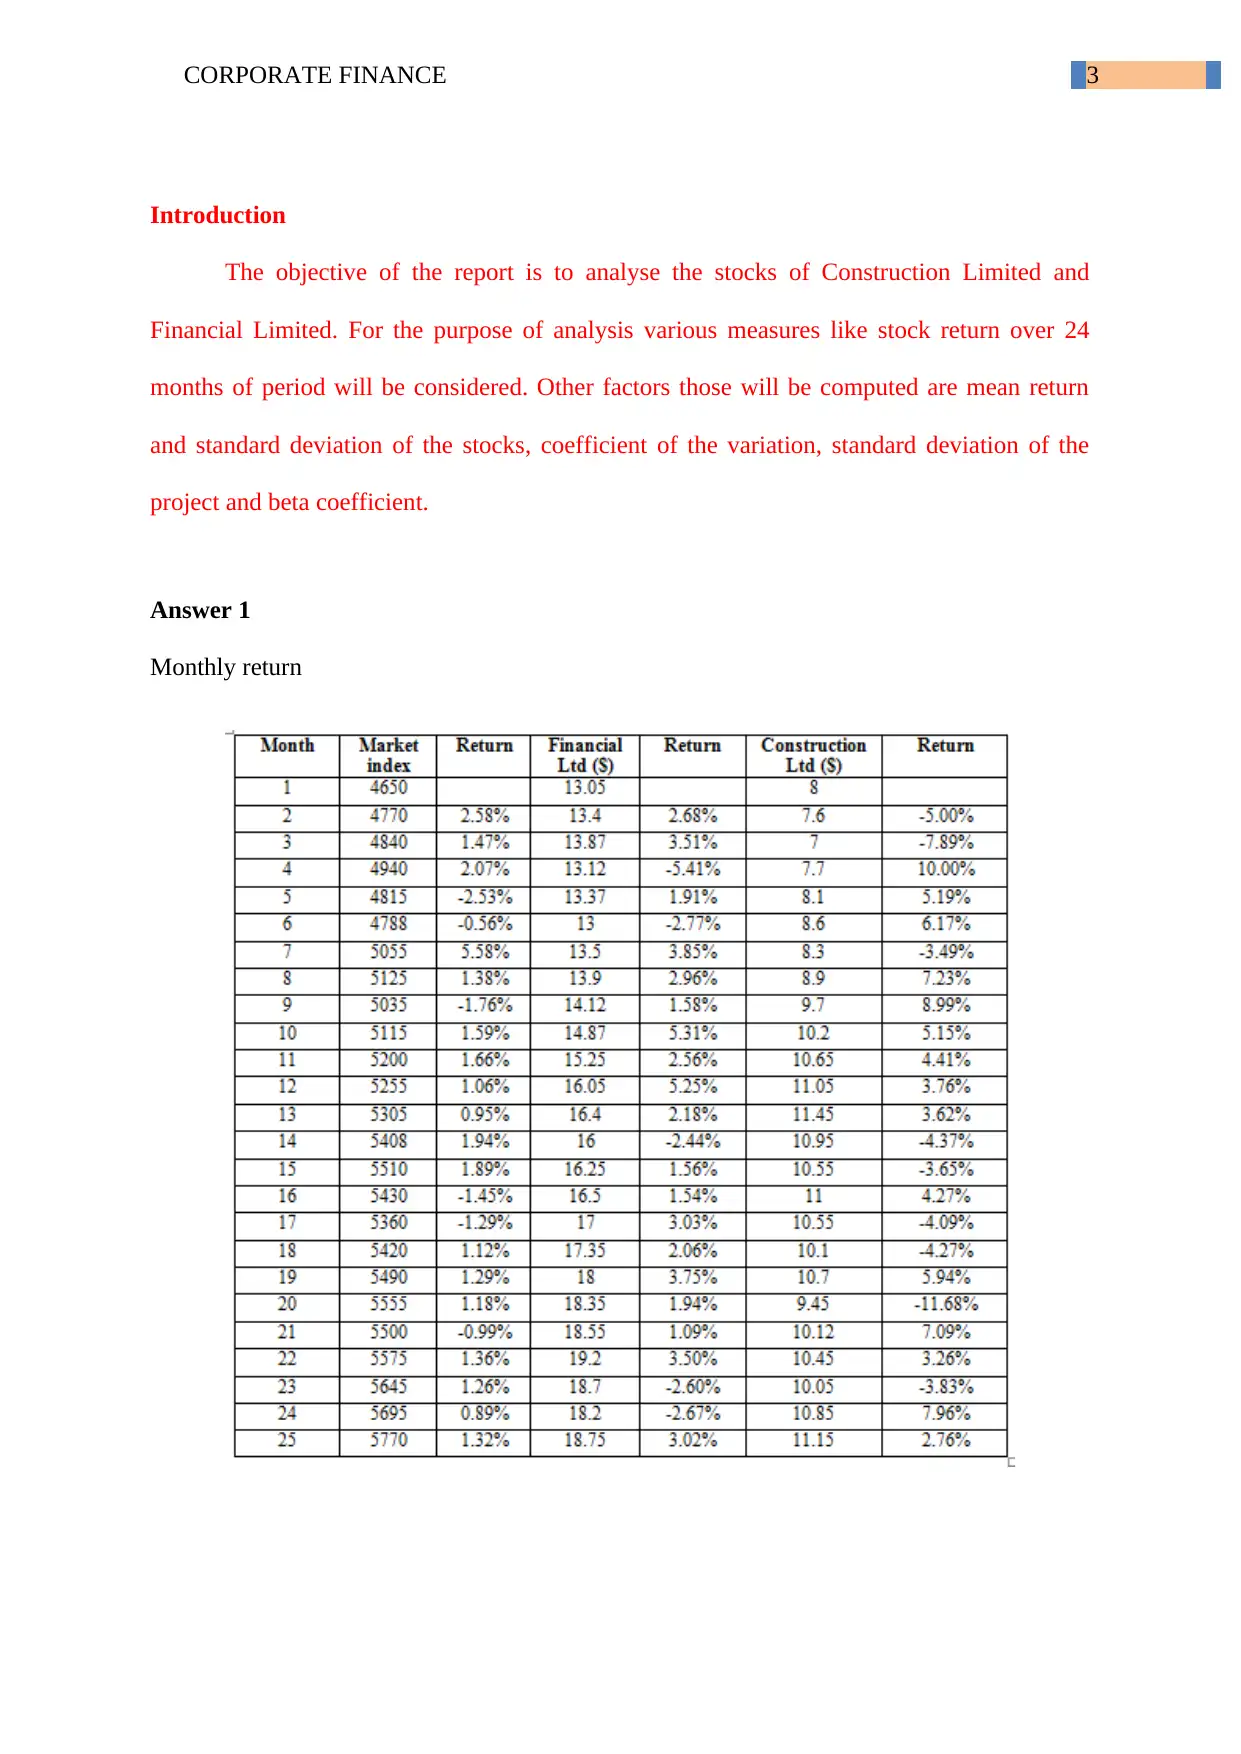
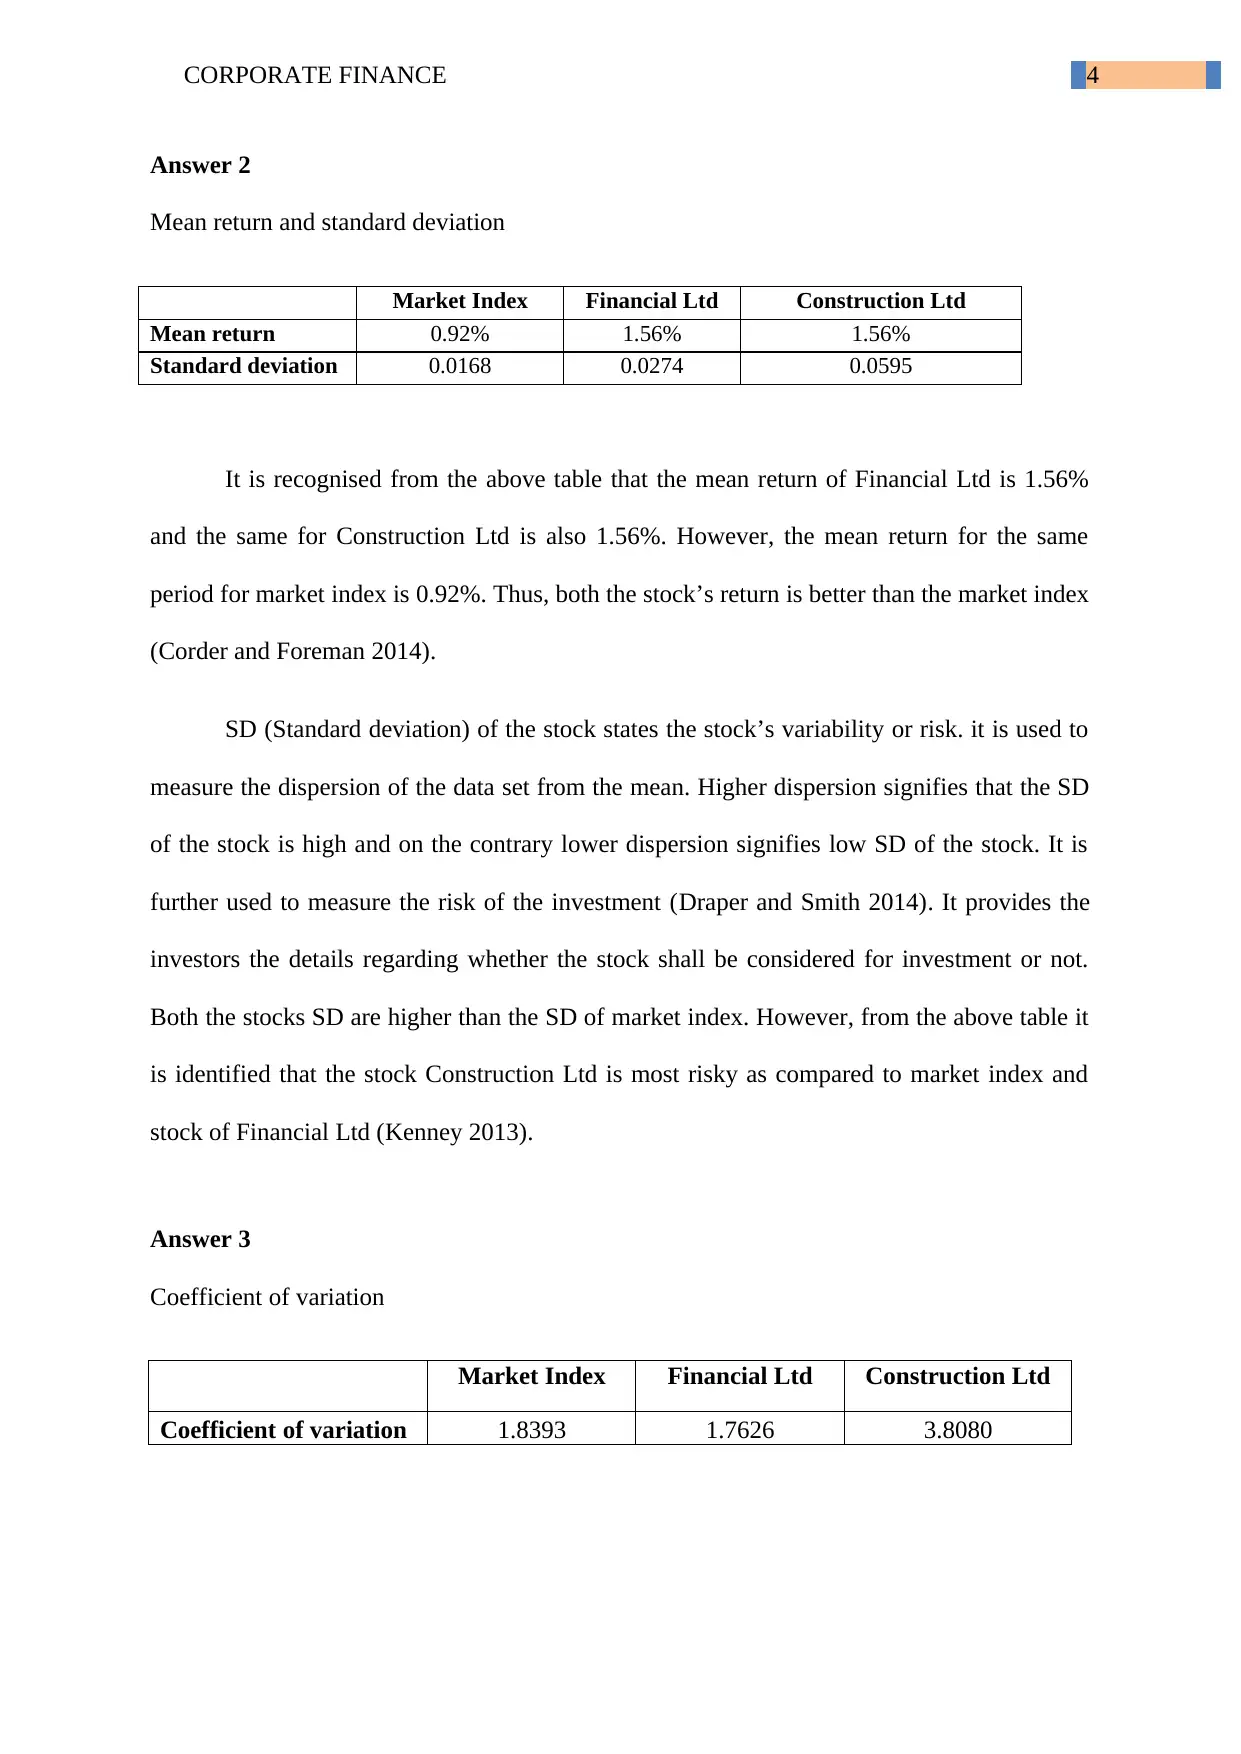
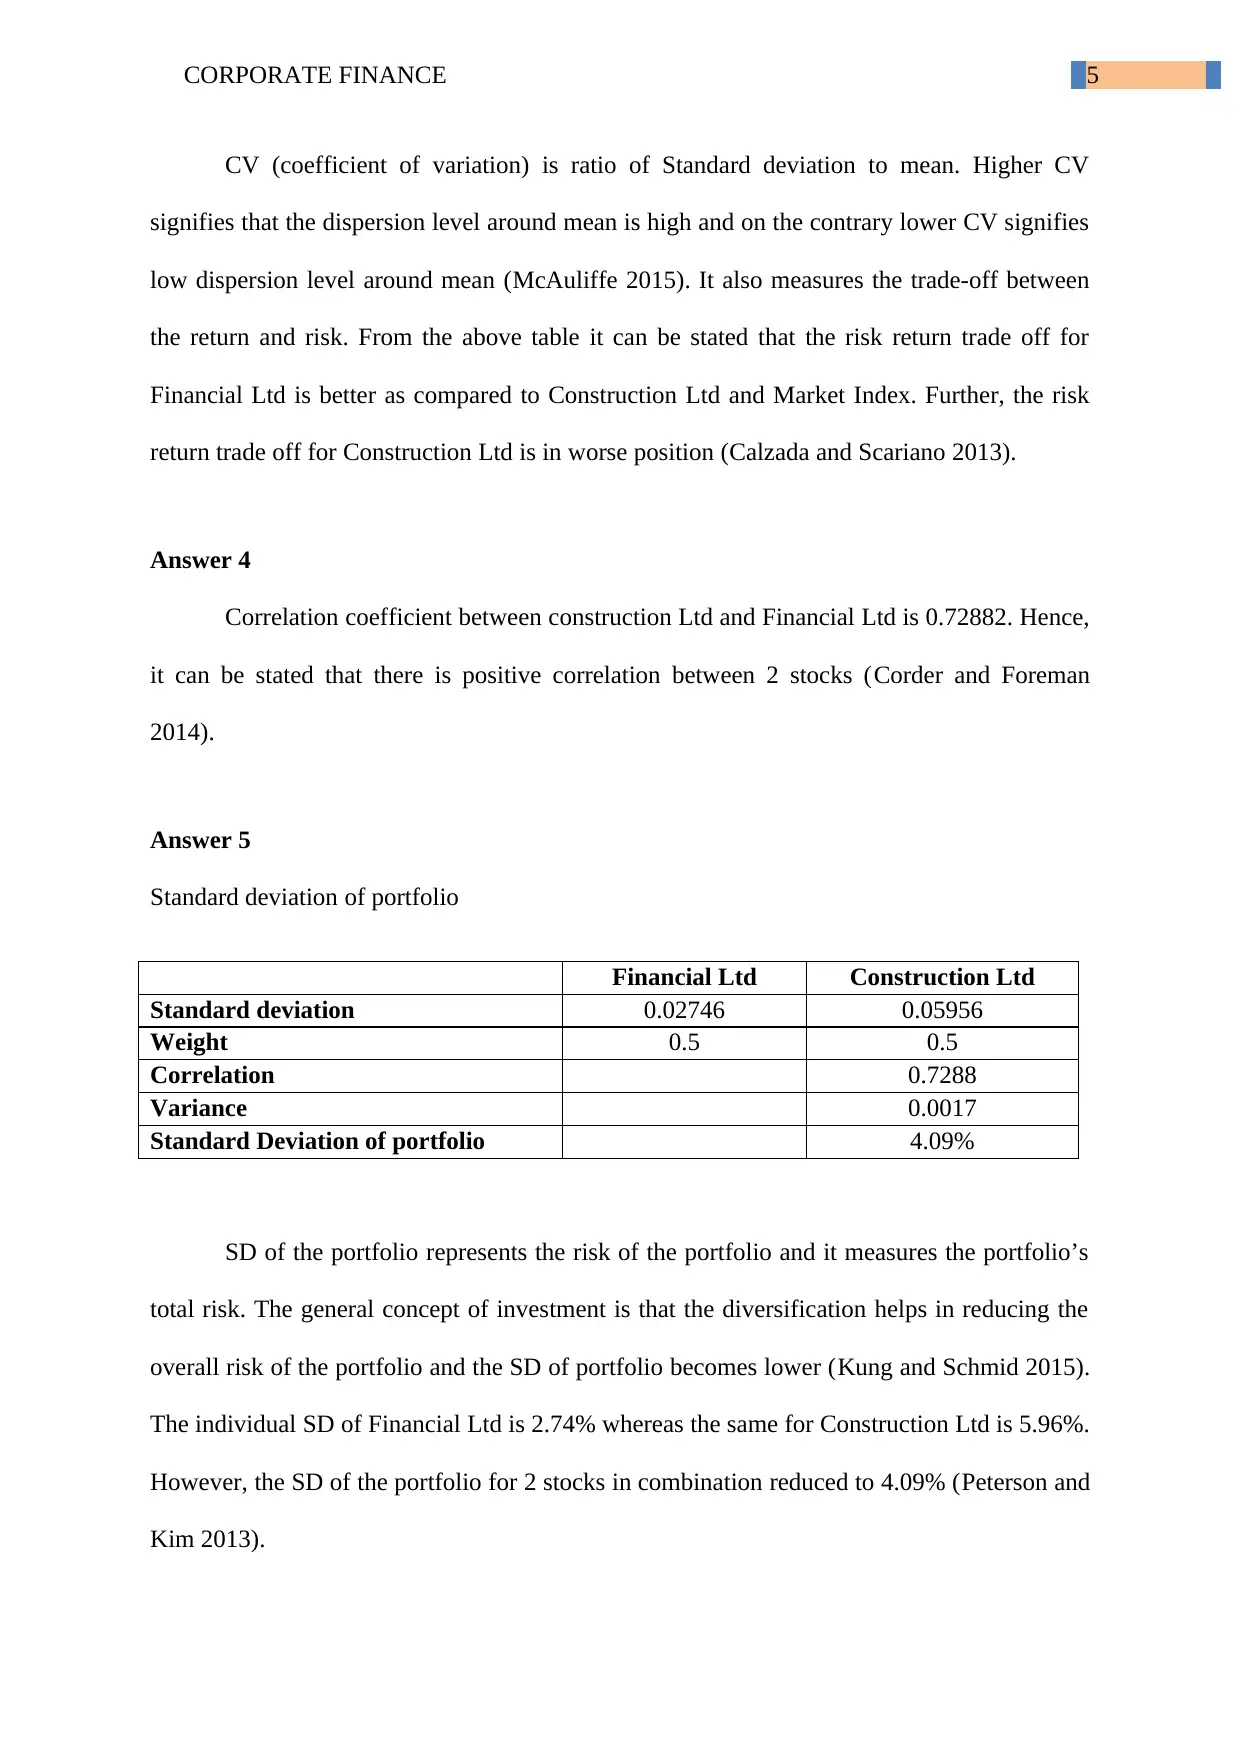
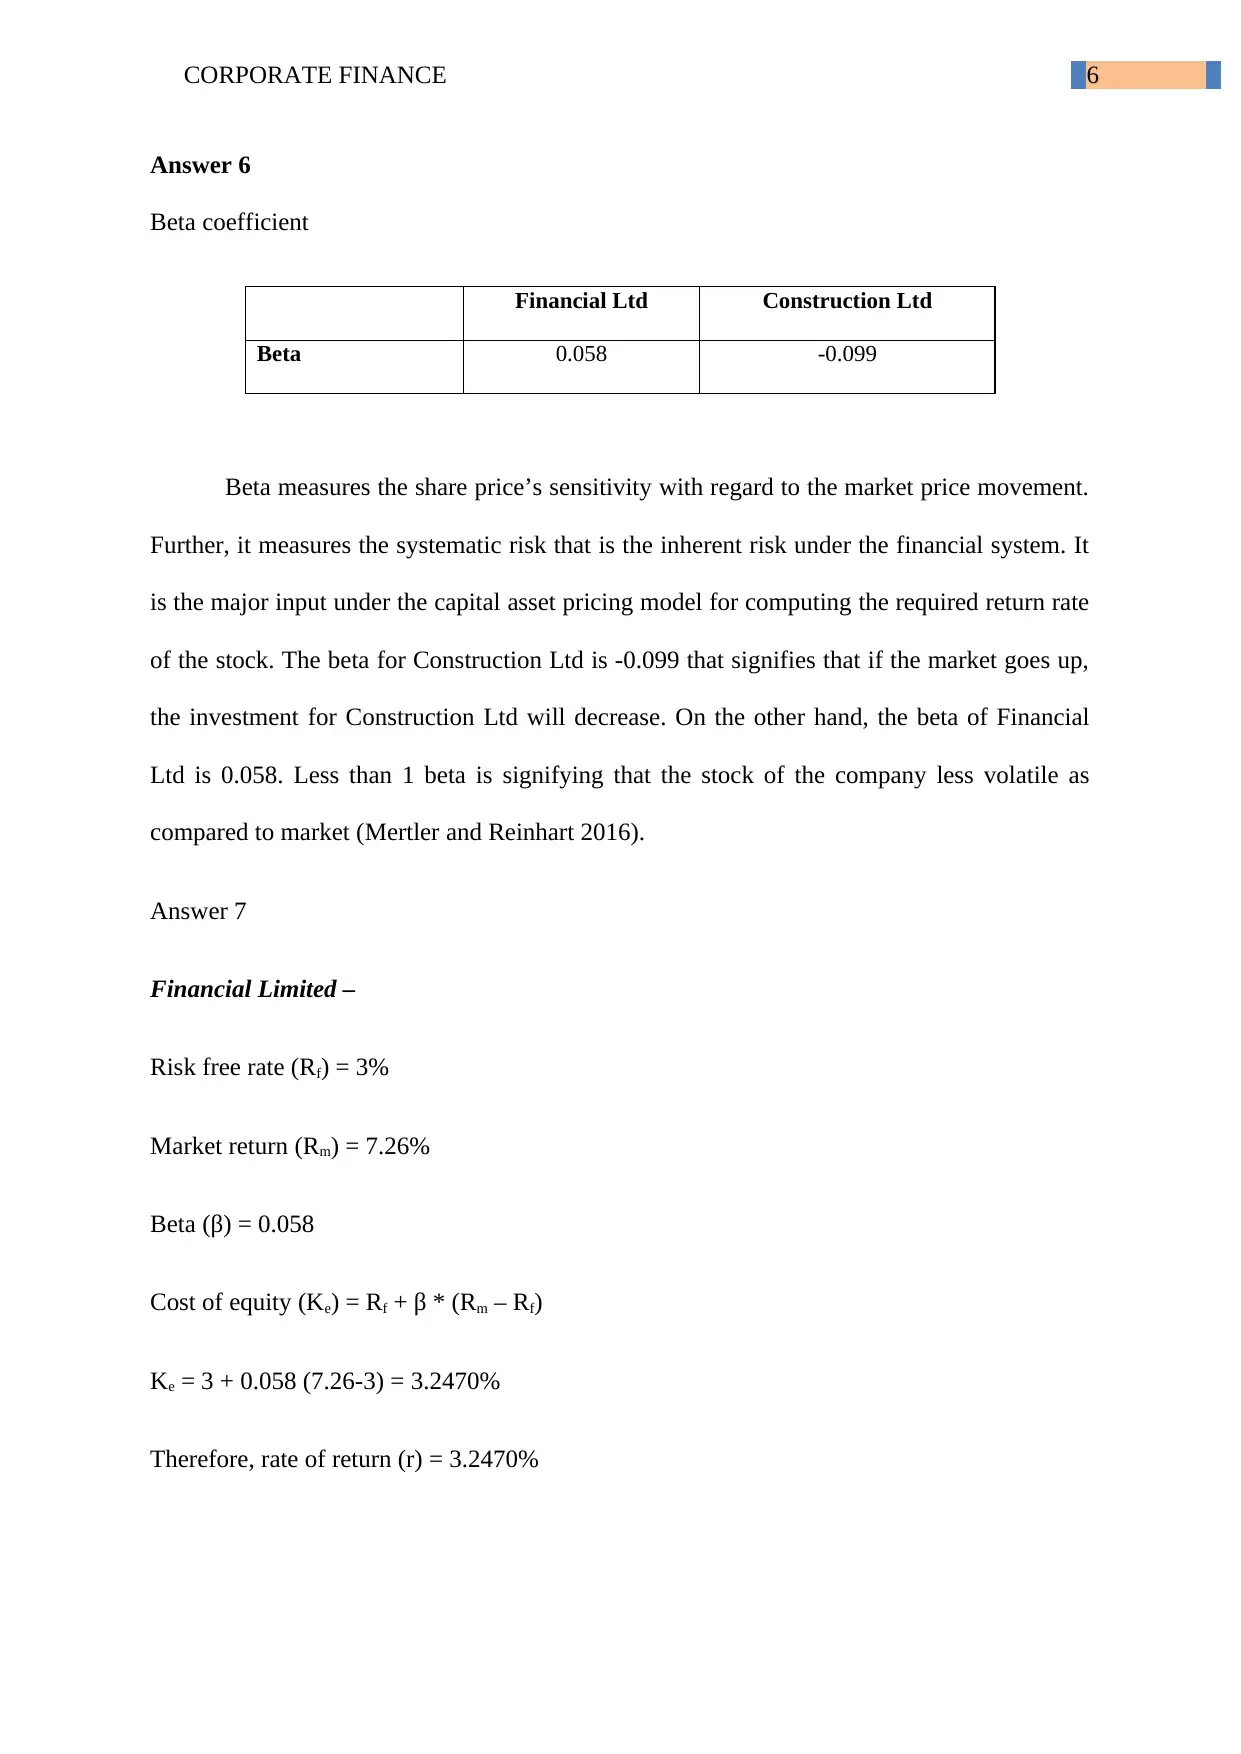
This report provides a detailed analysis of the stocks of Construction Limited and Financial Limited, utilizing various financial measures to assess their performance. The analysis includes calculating monthly stock returns over a 24-month period, determining mean returns and standard deviations for both stocks and the market index, and computing the coefficient of variation, standard deviation of a portfolio consisting of both stocks, and beta coefficients for each stock. The findings indicate that both stocks outperformed the market index in terms of mean return, but Construction Ltd is riskier than Financial Ltd. Furthermore, a positive correlation exists between the two stocks, and diversification by combining them in a portfolio reduces overall risk. The beta coefficients reveal the stocks' sensitivity to market movements, with Construction Ltd showing a negative correlation. Finally, the report calculates the cost of equity and stock values, suggesting both companies' shares are trading at a discount.

Running head: CORPORATE FINANCE
Corporate finance
Name of the student
Name of the university
Student ID
Author note
Corporate finance
Name of the student
Name of the university
Student ID
Author note
Paraphrase This Document
Need a fresh take? Get an instant paraphrase of this document with our AI Paraphraser

2CORPORATE FINANCE
Contents
Introduction................................................................................................................................3
Answer 1....................................................................................................................................3
Answer 2....................................................................................................................................3
Answer 3....................................................................................................................................4
Answer 4....................................................................................................................................5
Answer 5....................................................................................................................................5
Answer 6....................................................................................................................................5
Reference....................................................................................................................................8

3CORPORATE FINANCE
Introduction
The objective of the report is to analyse the stocks of Construction Limited and
Financial Limited. For the purpose of analysis various measures like stock return over 24
months of period will be considered. Other factors those will be computed are mean return
and standard deviation of the stocks, coefficient of the variation, standard deviation of the
project and beta coefficient.
Answer 1
Monthly return
⊘ This is a preview!⊘
Do you want full access?
Subscribe today to unlock all pages.

Trusted by 1+ million students worldwide

4CORPORATE FINANCE
Answer 2
Mean return and standard deviation
Market Index Financial Ltd Construction Ltd
Mean return 0.92% 1.56% 1.56%
Standard deviation 0.0168 0.0274 0.0595
It is recognised from the above table that the mean return of Financial Ltd is 1.56%
and the same for Construction Ltd is also 1.56%. However, the mean return for the same
period for market index is 0.92%. Thus, both the stock’s return is better than the market index
(Corder and Foreman 2014).
SD (Standard deviation) of the stock states the stock’s variability or risk. it is used to
measure the dispersion of the data set from the mean. Higher dispersion signifies that the SD
of the stock is high and on the contrary lower dispersion signifies low SD of the stock. It is
further used to measure the risk of the investment (Draper and Smith 2014). It provides the
investors the details regarding whether the stock shall be considered for investment or not.
Both the stocks SD are higher than the SD of market index. However, from the above table it
is identified that the stock Construction Ltd is most risky as compared to market index and
stock of Financial Ltd (Kenney 2013).
Answer 3
Coefficient of variation
Market Index Financial Ltd Construction Ltd
Coefficient of variation 1.8393 1.7626 3.8080
Paraphrase This Document
Need a fresh take? Get an instant paraphrase of this document with our AI Paraphraser

5CORPORATE FINANCE
CV (coefficient of variation) is ratio of Standard deviation to mean. Higher CV
signifies that the dispersion level around mean is high and on the contrary lower CV signifies
low dispersion level around mean (McAuliffe 2015). It also measures the trade-off between
the return and risk. From the above table it can be stated that the risk return trade off for
Financial Ltd is better as compared to Construction Ltd and Market Index. Further, the risk
return trade off for Construction Ltd is in worse position (Calzada and Scariano 2013).
Answer 4
Correlation coefficient between construction Ltd and Financial Ltd is 0.72882. Hence,
it can be stated that there is positive correlation between 2 stocks (Corder and Foreman
2014).
Answer 5
Standard deviation of portfolio
Financial Ltd Construction Ltd
Standard deviation 0.02746 0.05956
Weight 0.5 0.5
Correlation 0.7288
Variance 0.0017
Standard Deviation of portfolio 4.09%
SD of the portfolio represents the risk of the portfolio and it measures the portfolio’s
total risk. The general concept of investment is that the diversification helps in reducing the
overall risk of the portfolio and the SD of portfolio becomes lower (Kung and Schmid 2015).
The individual SD of Financial Ltd is 2.74% whereas the same for Construction Ltd is 5.96%.
However, the SD of the portfolio for 2 stocks in combination reduced to 4.09% (Peterson and
Kim 2013).

6CORPORATE FINANCE
Answer 6
Beta coefficient
Financial Ltd Construction Ltd
Beta 0.058 -0.099
Beta measures the share price’s sensitivity with regard to the market price movement.
Further, it measures the systematic risk that is the inherent risk under the financial system. It
is the major input under the capital asset pricing model for computing the required return rate
of the stock. The beta for Construction Ltd is -0.099 that signifies that if the market goes up,
the investment for Construction Ltd will decrease. On the other hand, the beta of Financial
Ltd is 0.058. Less than 1 beta is signifying that the stock of the company less volatile as
compared to market (Mertler and Reinhart 2016).
Answer 7
Financial Limited –
Risk free rate (Rf) = 3%
Market return (Rm) = 7.26%
Beta (β) = 0.058
Cost of equity (Ke) = Rf + β * (Rm – Rf)
Ke = 3 + 0.058 (7.26-3) = 3.2470%
Therefore, rate of return (r) = 3.2470%
⊘ This is a preview!⊘
Do you want full access?
Subscribe today to unlock all pages.

Trusted by 1+ million students worldwide

7CORPORATE FINANCE
Value of stock = D1 / (Re- g) where, D1 = Dividend for next year, g = growth rate, Re = rate of
return (Gleason, Bruce Johnson and Li 2013)
Therefore, stock value = 1.03 / (0.03247-0.04) = - $ 136.79
Share price = - $ 136.79
Construction Limited –
Risk free rate (Rf) = 3%
Market return (Rm) = 7.26%
Beta (β) = -0.099
Cost of equity (Ke) = Rf + β * (Rm – Rf)
Ke = 3 – 0.099 (7.26-3) = 2.578%
Therefore, rate of return (r) = 2.578%
Value of stock = D1 / (Re - g) where, D1 = Dividend for next year, g = growth rate, Re = rate of
return (Baresa, Bogdan and Ivanovic 2013)
Therefore, stock value = 0.62 / (0.02578-0.06) = - $ 18.12
It can be identified from the above calculation that both the company’s shares are
trading at discount. However, share price of Construction Ltd is high as compared to
Financial Ltd.
Paraphrase This Document
Need a fresh take? Get an instant paraphrase of this document with our AI Paraphraser

8CORPORATE FINANCE
Reference
Baresa, S., Bogdan, S. and Ivanovic, Z., 2013. Strategy of stock valuation by fundamental
analysis. UTMS Journal of Economics, 4(1), p.45.
Calzada, M.E. and Scariano, S.M., 2013. A synthetic control chart for the coefficient of
variation. Journal of Statistical Computation and Simulation, 83(5), pp.853-867.
Corder, G.W. and Foreman, D.I., 2014. Nonparametric statistics: A step-by-step approach.
John Wiley & Sons.
Draper, N.R. and Smith, H., 2014. Applied regression analysis(Vol. 326). John Wiley &
Sons.
Gleason, C.A., Bruce Johnson, W. and Li, H., 2013. Valuation model use and the price target
performance of sell‐side equity analysts. Contemporary Accounting Research, 30(1), pp.80-
115.
Kenney, J.F., 2013. Mathematics of statistics. D. Van Nostrand Company Inc; Toronto;
Princeton; New Jersey; London; New York,; Affiliated East-West Press Pvt-Ltd; New Delhi.
Kung, H. and Schmid, L., 2015. Innovation, growth, and asset prices. The Journal of
Finance, 70(3), pp.1001-1037.
McAuliffe, R.E., 2015. Coefficient of variation. Wiley Encyclopedia of Management.
Mertler, C.A. and Reinhart, R.V., 2016. Advanced and multivariate statistical methods:
Practical application and interpretation. Taylor & Francis.
Peterson, R.A. and Kim, Y., 2013. On the relationship between coefficient alpha and
composite reliability. Journal of Applied Psychology, 98(1), p.194.

9CORPORATE FINANCE
⊘ This is a preview!⊘
Do you want full access?
Subscribe today to unlock all pages.

Trusted by 1+ million students worldwide
1 out of 9
Related Documents

Your All-in-One AI-Powered Toolkit for Academic Success.
+13062052269
info@desklib.com
Available 24*7 on WhatsApp / Email
Unlock your academic potential
Copyright © 2020–2025 A2Z Services. All Rights Reserved. Developed and managed by ZUCOL.