Corporate Finance Analysis: Risk, Return, and Valuation of Stocks

Verified

Added on  2021/06/18

|8
|1199
|61
Homework Assignment
AI Summary
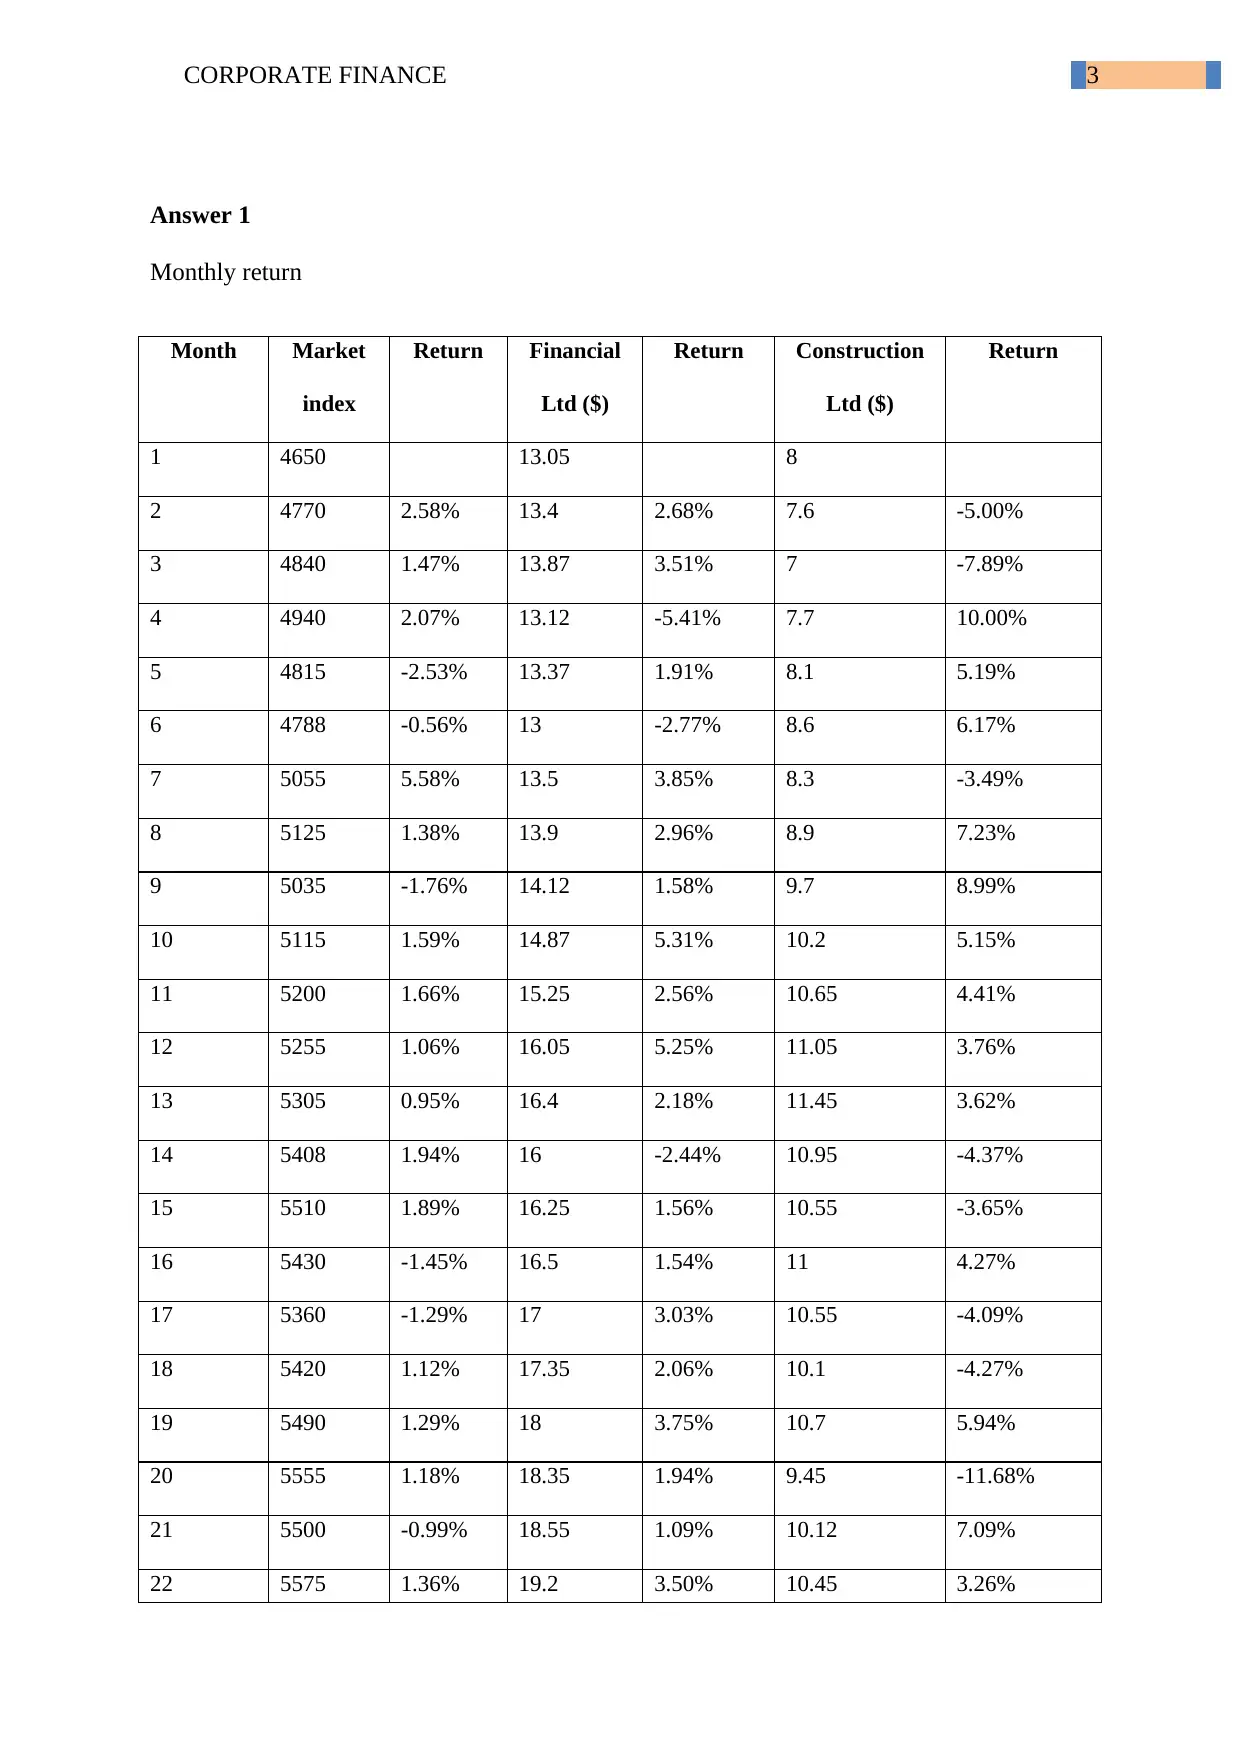
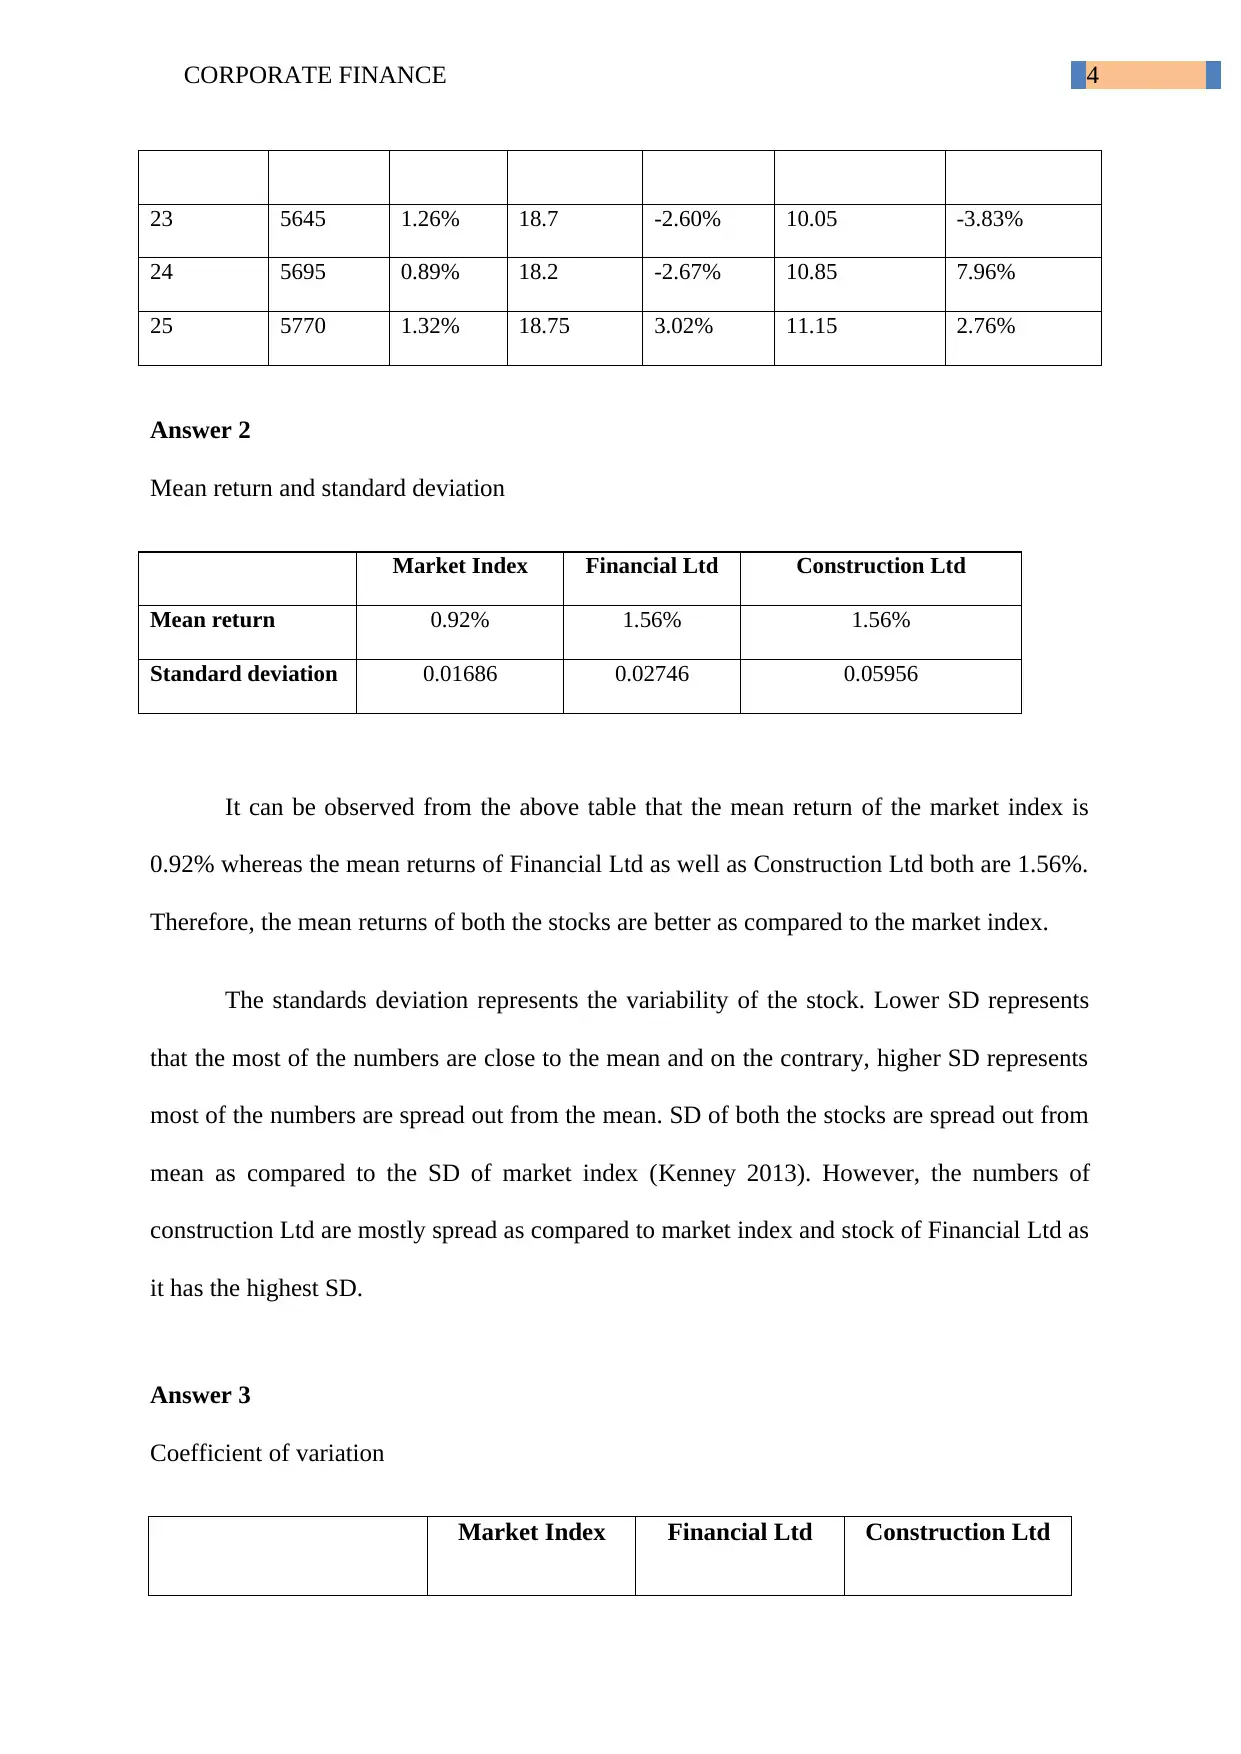
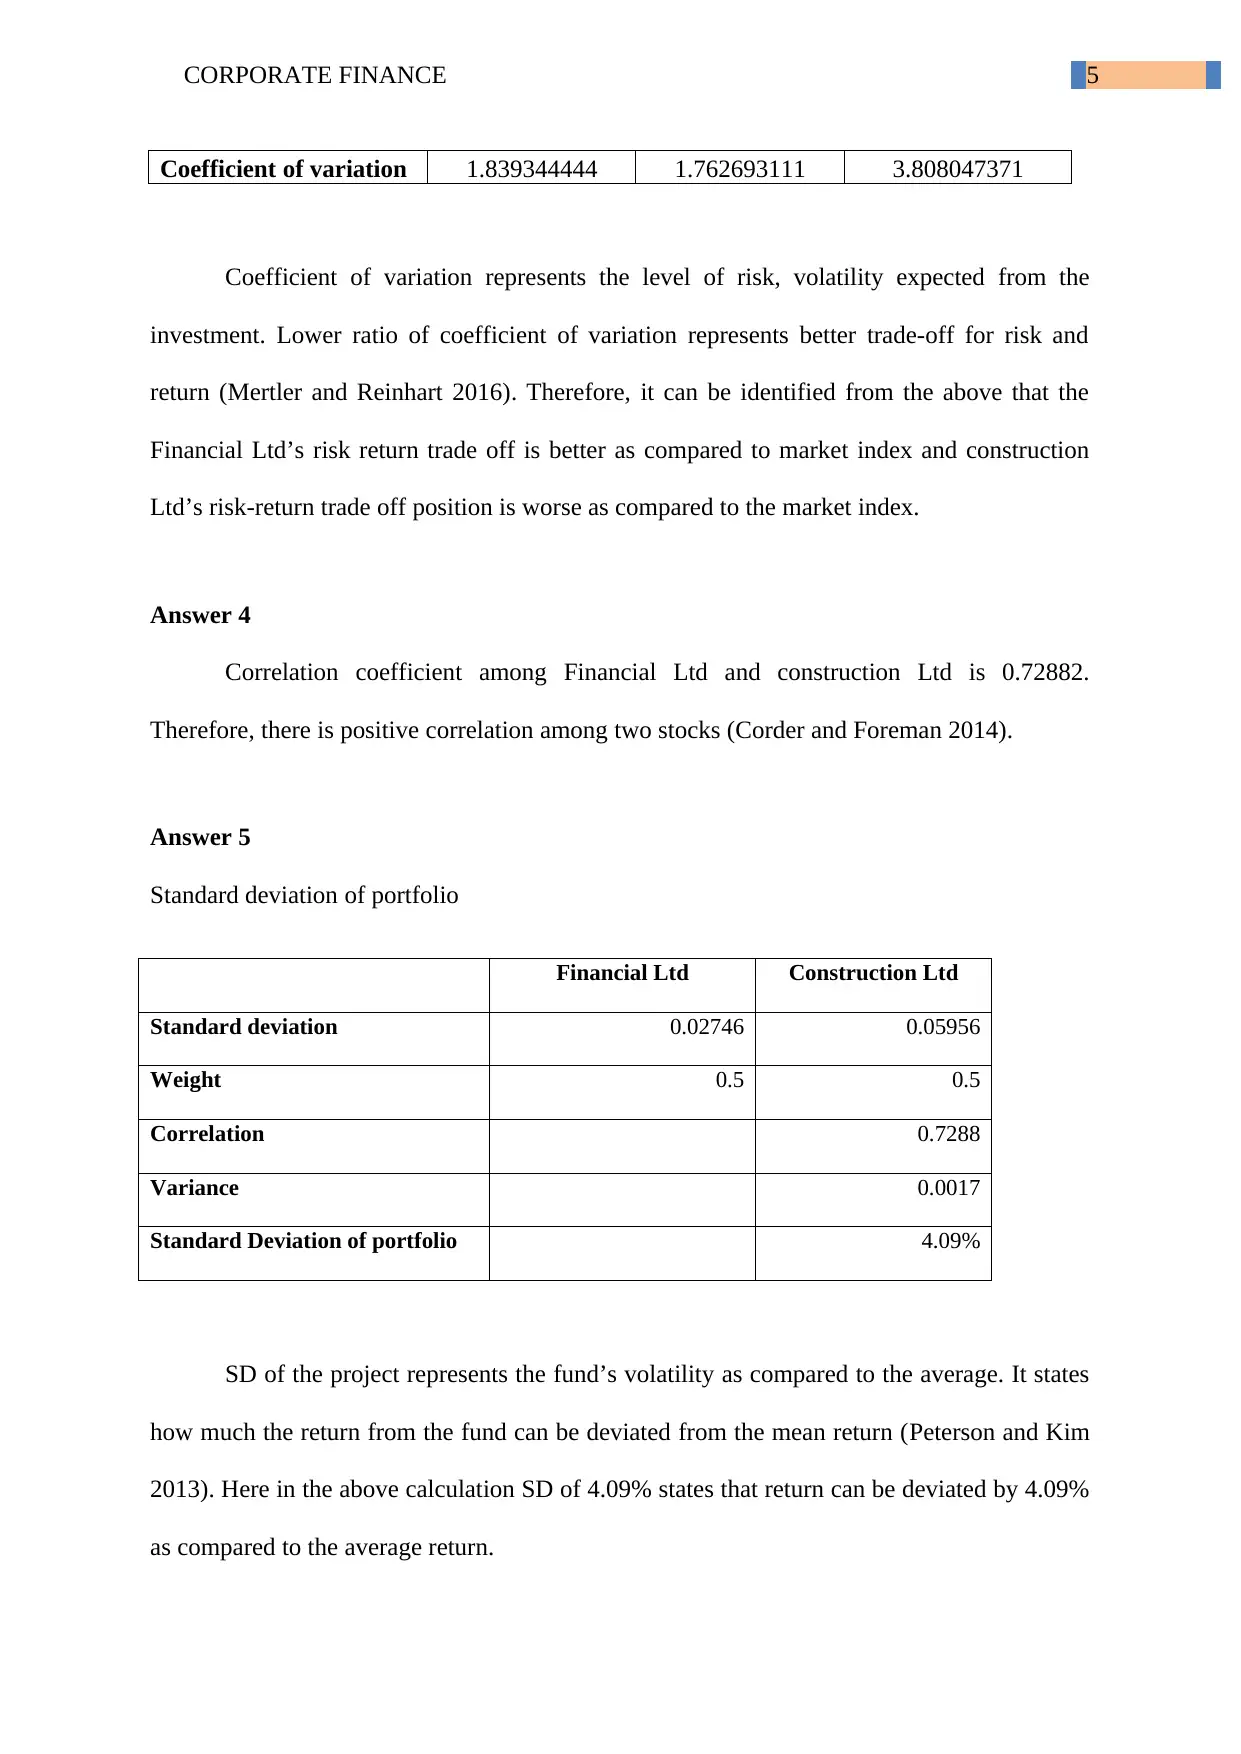
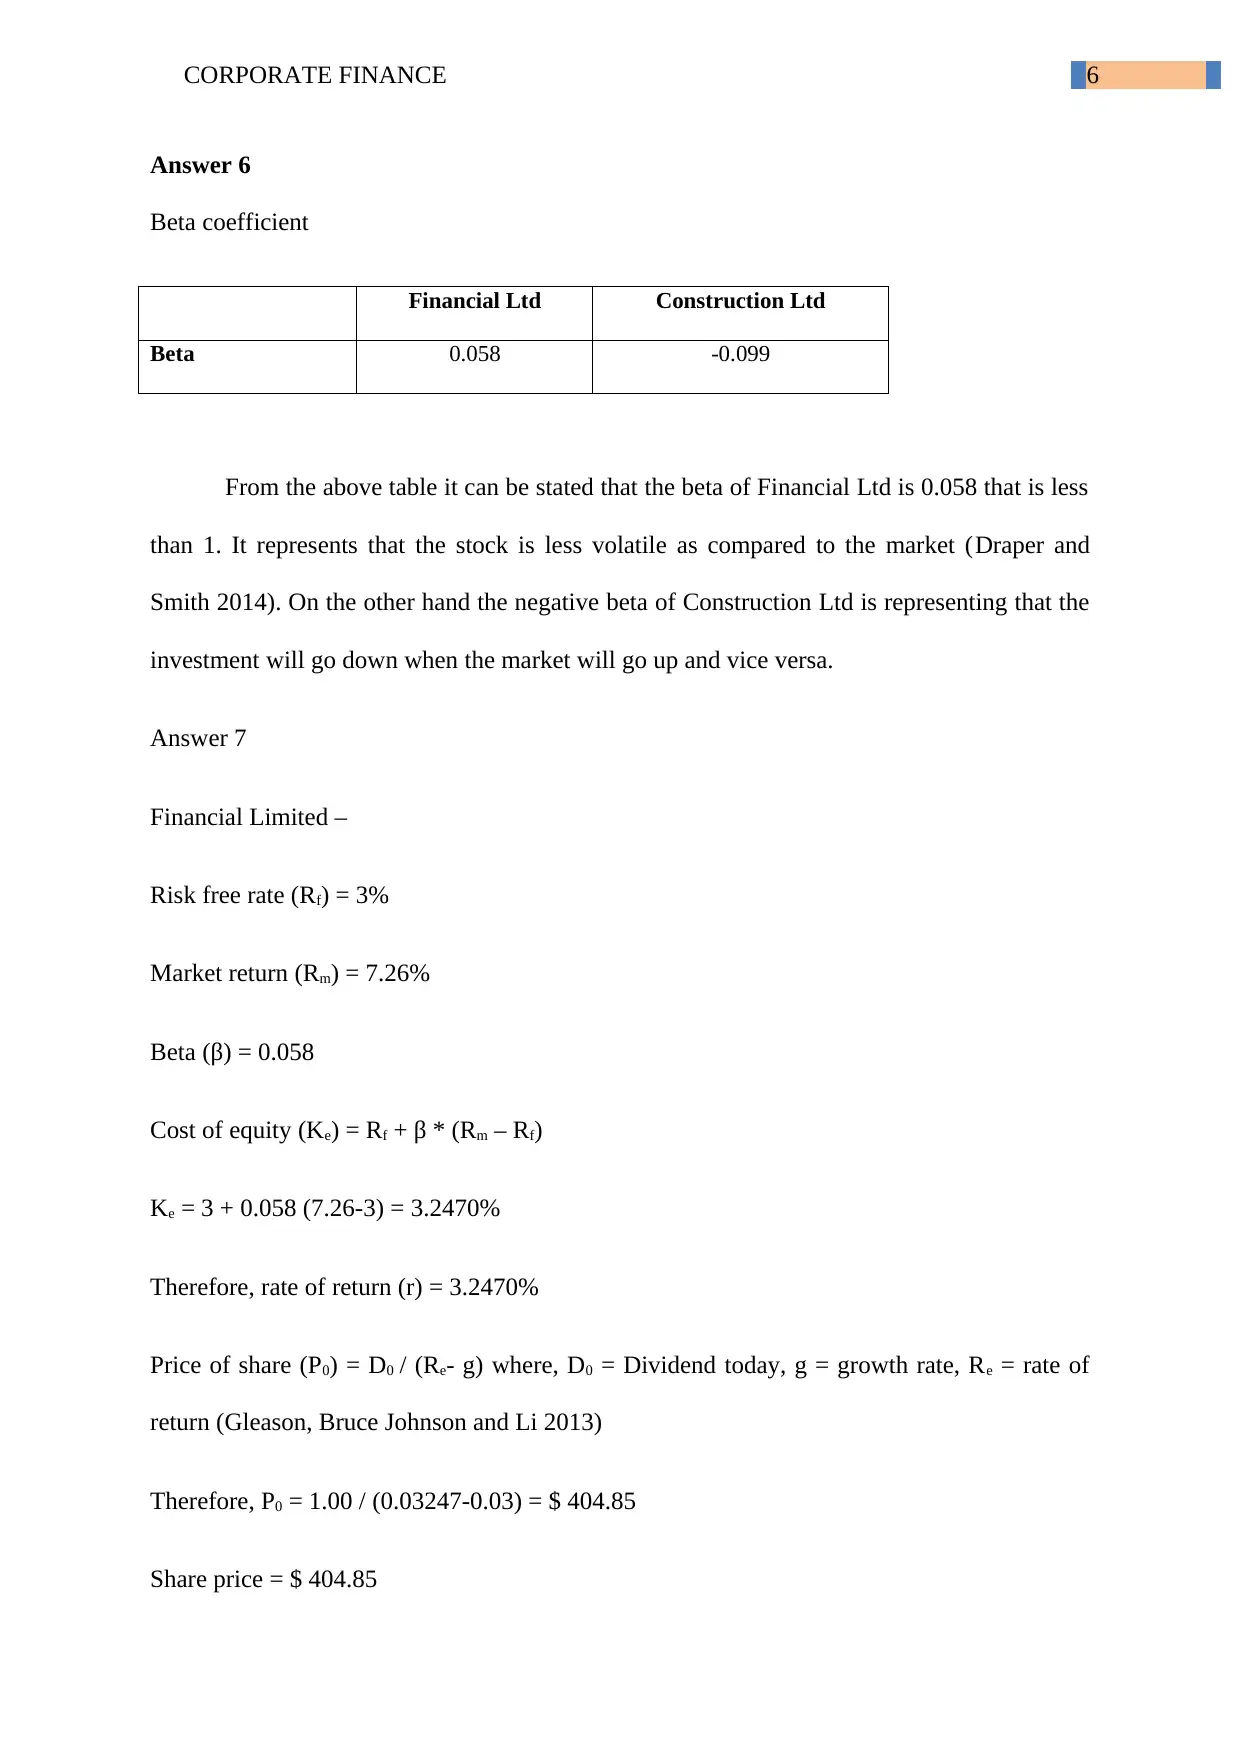
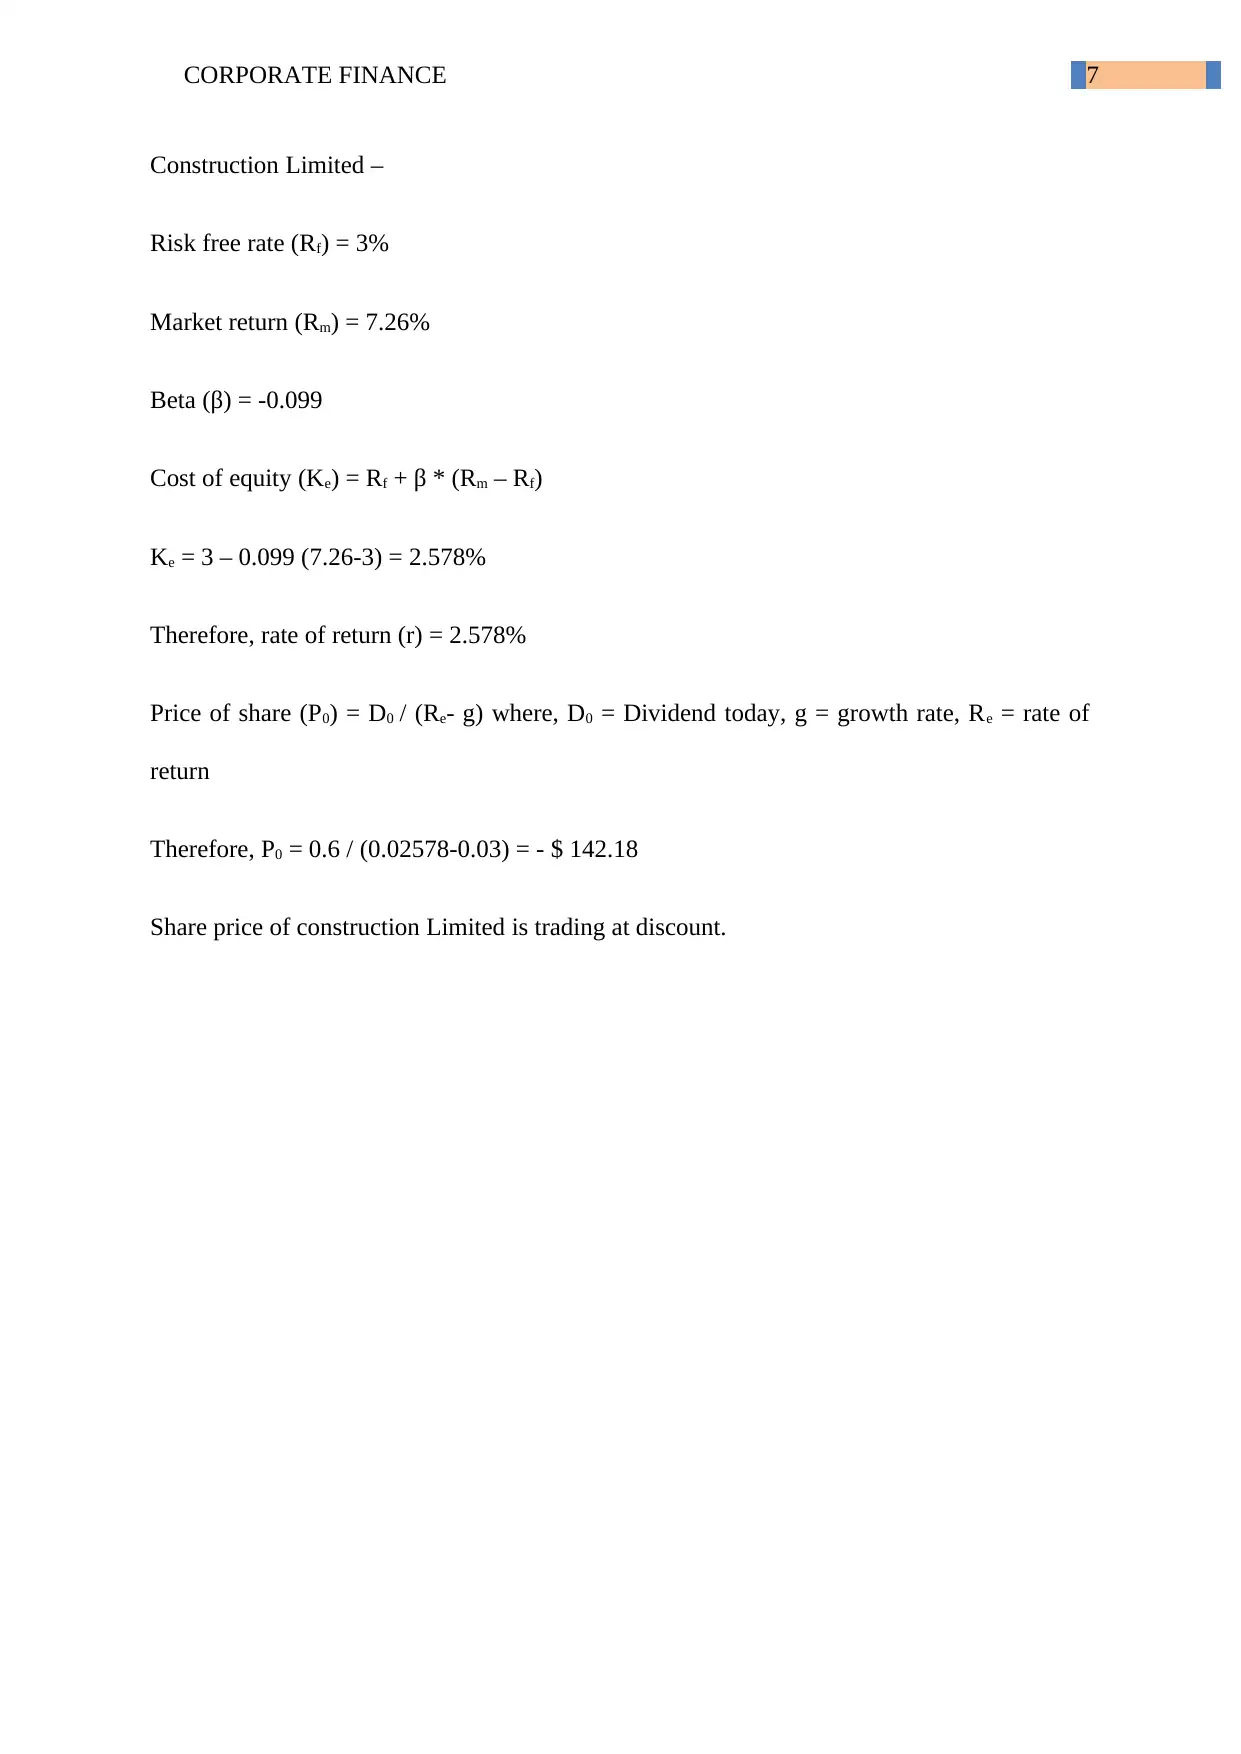
This homework assignment analyzes corporate finance concepts using provided financial data. The solution calculates monthly returns for market indices and two companies (Financial Ltd and Construction Ltd), determining mean returns, standard deviations, and coefficients of variation to assess risk and volatility. The assignment further explores correlation coefficients between the two companies, followed by the calculation of portfolio standard deviation and beta coefficients. Finally, the solution applies the Capital Asset Pricing Model (CAPM) to determine the cost of equity and the share price for both companies, including a discussion on the share price valuation and trading at discount. The assignment includes detailed calculations and interpretations of the financial metrics, demonstrating a comprehensive understanding of corporate finance principles.
tabler-icon-diamond-filled.svg

Contribute Materials

Your contribution can guide someone’s learning journey. Share your documents today.
Document Page
Running head: CORPORATE FINANCE
Corporate finance
Name of the student
Name of the university
Student ID
Author note
tabler-icon-diamond-filled.svg

Secure Best Marks with AI Grader

Need help grading? Try our AI Grader for instant feedback on your assignments.
Document Page
2CORPORATE FINANCE
Contents
Answer 1....................................................................................................................................3
Answer 2....................................................................................................................................4
Answer 3....................................................................................................................................4
Answer 4....................................................................................................................................5
Answer 5....................................................................................................................................5
Answer 6....................................................................................................................................6
Reference....................................................................................................................................8
Document Page
3CORPORATE FINANCE
Answer 1
Monthly return
Month Market
index
Return Financial
Ltd ($)
Return Construction
Ltd ($)
Return
1 4650 13.05 8
2 4770 2.58% 13.4 2.68% 7.6 -5.00%
3 4840 1.47% 13.87 3.51% 7 -7.89%
4 4940 2.07% 13.12 -5.41% 7.7 10.00%
5 4815 -2.53% 13.37 1.91% 8.1 5.19%
6 4788 -0.56% 13 -2.77% 8.6 6.17%
7 5055 5.58% 13.5 3.85% 8.3 -3.49%
8 5125 1.38% 13.9 2.96% 8.9 7.23%
9 5035 -1.76% 14.12 1.58% 9.7 8.99%
10 5115 1.59% 14.87 5.31% 10.2 5.15%
11 5200 1.66% 15.25 2.56% 10.65 4.41%
12 5255 1.06% 16.05 5.25% 11.05 3.76%
13 5305 0.95% 16.4 2.18% 11.45 3.62%
14 5408 1.94% 16 -2.44% 10.95 -4.37%
15 5510 1.89% 16.25 1.56% 10.55 -3.65%
16 5430 -1.45% 16.5 1.54% 11 4.27%
17 5360 -1.29% 17 3.03% 10.55 -4.09%
18 5420 1.12% 17.35 2.06% 10.1 -4.27%
19 5490 1.29% 18 3.75% 10.7 5.94%
20 5555 1.18% 18.35 1.94% 9.45 -11.68%
21 5500 -0.99% 18.55 1.09% 10.12 7.09%
22 5575 1.36% 19.2 3.50% 10.45 3.26%
Document Page
4CORPORATE FINANCE
23 5645 1.26% 18.7 -2.60% 10.05 -3.83%
24 5695 0.89% 18.2 -2.67% 10.85 7.96%
25 5770 1.32% 18.75 3.02% 11.15 2.76%
Answer 2
Mean return and standard deviation
Market Index Financial Ltd Construction Ltd
Mean return 0.92% 1.56% 1.56%
Standard deviation 0.01686 0.02746 0.05956
It can be observed from the above table that the mean return of the market index is
0.92% whereas the mean returns of Financial Ltd as well as Construction Ltd both are 1.56%.
Therefore, the mean returns of both the stocks are better as compared to the market index.
The standards deviation represents the variability of the stock. Lower SD represents
that the most of the numbers are close to the mean and on the contrary, higher SD represents
most of the numbers are spread out from the mean. SD of both the stocks are spread out from
mean as compared to the SD of market index (Kenney 2013). However, the numbers of
construction Ltd are mostly spread as compared to market index and stock of Financial Ltd as
it has the highest SD.
Answer 3
Coefficient of variation
Market Index Financial Ltd Construction Ltd
tabler-icon-diamond-filled.svg

Secure Best Marks with AI Grader

Need help grading? Try our AI Grader for instant feedback on your assignments.
Document Page
5CORPORATE FINANCE
Coefficient of variation 1.839344444 1.762693111 3.808047371
Coefficient of variation represents the level of risk, volatility expected from the
investment. Lower ratio of coefficient of variation represents better trade-off for risk and
return (Mertler and Reinhart 2016). Therefore, it can be identified from the above that the
Financial Ltd’s risk return trade off is better as compared to market index and construction
Ltd’s risk-return trade off position is worse as compared to the market index.
Answer 4
Correlation coefficient among Financial Ltd and construction Ltd is 0.72882.
Therefore, there is positive correlation among two stocks (Corder and Foreman 2014).
Answer 5
Standard deviation of portfolio
Financial Ltd Construction Ltd
Standard deviation 0.02746 0.05956
Weight 0.5 0.5
Correlation 0.7288
Variance 0.0017
Standard Deviation of portfolio 4.09%
SD of the project represents the fund’s volatility as compared to the average. It states
how much the return from the fund can be deviated from the mean return (Peterson and Kim
2013). Here in the above calculation SD of 4.09% states that return can be deviated by 4.09%
as compared to the average return.
Document Page
6CORPORATE FINANCE
Answer 6
Beta coefficient
Financial Ltd Construction Ltd
Beta 0.058 -0.099
From the above table it can be stated that the beta of Financial Ltd is 0.058 that is less
than 1. It represents that the stock is less volatile as compared to the market (Draper and
Smith 2014). On the other hand the negative beta of Construction Ltd is representing that the
investment will go down when the market will go up and vice versa.
Answer 7
Financial Limited –
Risk free rate (Rf) = 3%
Market return (Rm) = 7.26%
Beta (β) = 0.058
Cost of equity (Ke) = Rf + β * (Rm – Rf)
Ke = 3 + 0.058 (7.26-3) = 3.2470%
Therefore, rate of return (r) = 3.2470%
Price of share (P0) = D0 / (Re- g) where, D0 = Dividend today, g = growth rate, Re = rate of
return (Gleason, Bruce Johnson and Li 2013)
Therefore, P0 = 1.00 / (0.03247-0.03) = $ 404.85
Share price = $ 404.85
Document Page
7CORPORATE FINANCE
Construction Limited –
Risk free rate (Rf) = 3%
Market return (Rm) = 7.26%
Beta (β) = -0.099
Cost of equity (Ke) = Rf + β * (Rm – Rf)
Ke = 3 – 0.099 (7.26-3) = 2.578%
Therefore, rate of return (r) = 2.578%
Price of share (P0) = D0 / (Re- g) where, D0 = Dividend today, g = growth rate, Re = rate of
return
Therefore, P0 = 0.6 / (0.02578-0.03) = - $ 142.18
Share price of construction Limited is trading at discount.
tabler-icon-diamond-filled.svg

Paraphrase This Document

Need a fresh take? Get an instant paraphrase of this document with our AI Paraphraser
Document Page
8CORPORATE FINANCE
Reference
Corder, G.W. and Foreman, D.I., 2014. Nonparametric statistics: A step-by-step approach.
John Wiley & Sons.
Draper, N.R. and Smith, H., 2014. Applied regression analysis(Vol. 326). John Wiley &
Sons.
Gleason, C.A., Bruce Johnson, W. and Li, H., 2013. Valuation model use and the price target
performance of sellside equity analysts. Contemporary Accounting Research, 30(1), pp.80-
115.
Kenney, J.F., 2013. Mathematics of statistics. D. Van Nostrand Company Inc; Toronto;
Princeton; New Jersey; London; New York,; Affiliated East-West Press Pvt-Ltd; New Delhi.
Mertler, C.A. and Reinhart, R.V., 2016. Advanced and multivariate statistical methods:
Practical application and interpretation. Taylor & Francis.
Peterson, R.A. and Kim, Y., 2013. On the relationship between coefficient alpha and
composite reliability. Journal of Applied Psychology, 98(1), p.194.
chevron_up_icon
1 out of 8
circle_padding
hide_on_mobile
zoom_out_icon
logo.png

Your All-in-One AI-Powered Toolkit for Academic Success.

Available 24*7 on WhatsApp / Email

[object Object]