Corporate Finance Management and Governance: Financial Analysis Report

Verified

Added on  2020/10/22

|13
|2215
|104
Report
AI Summary
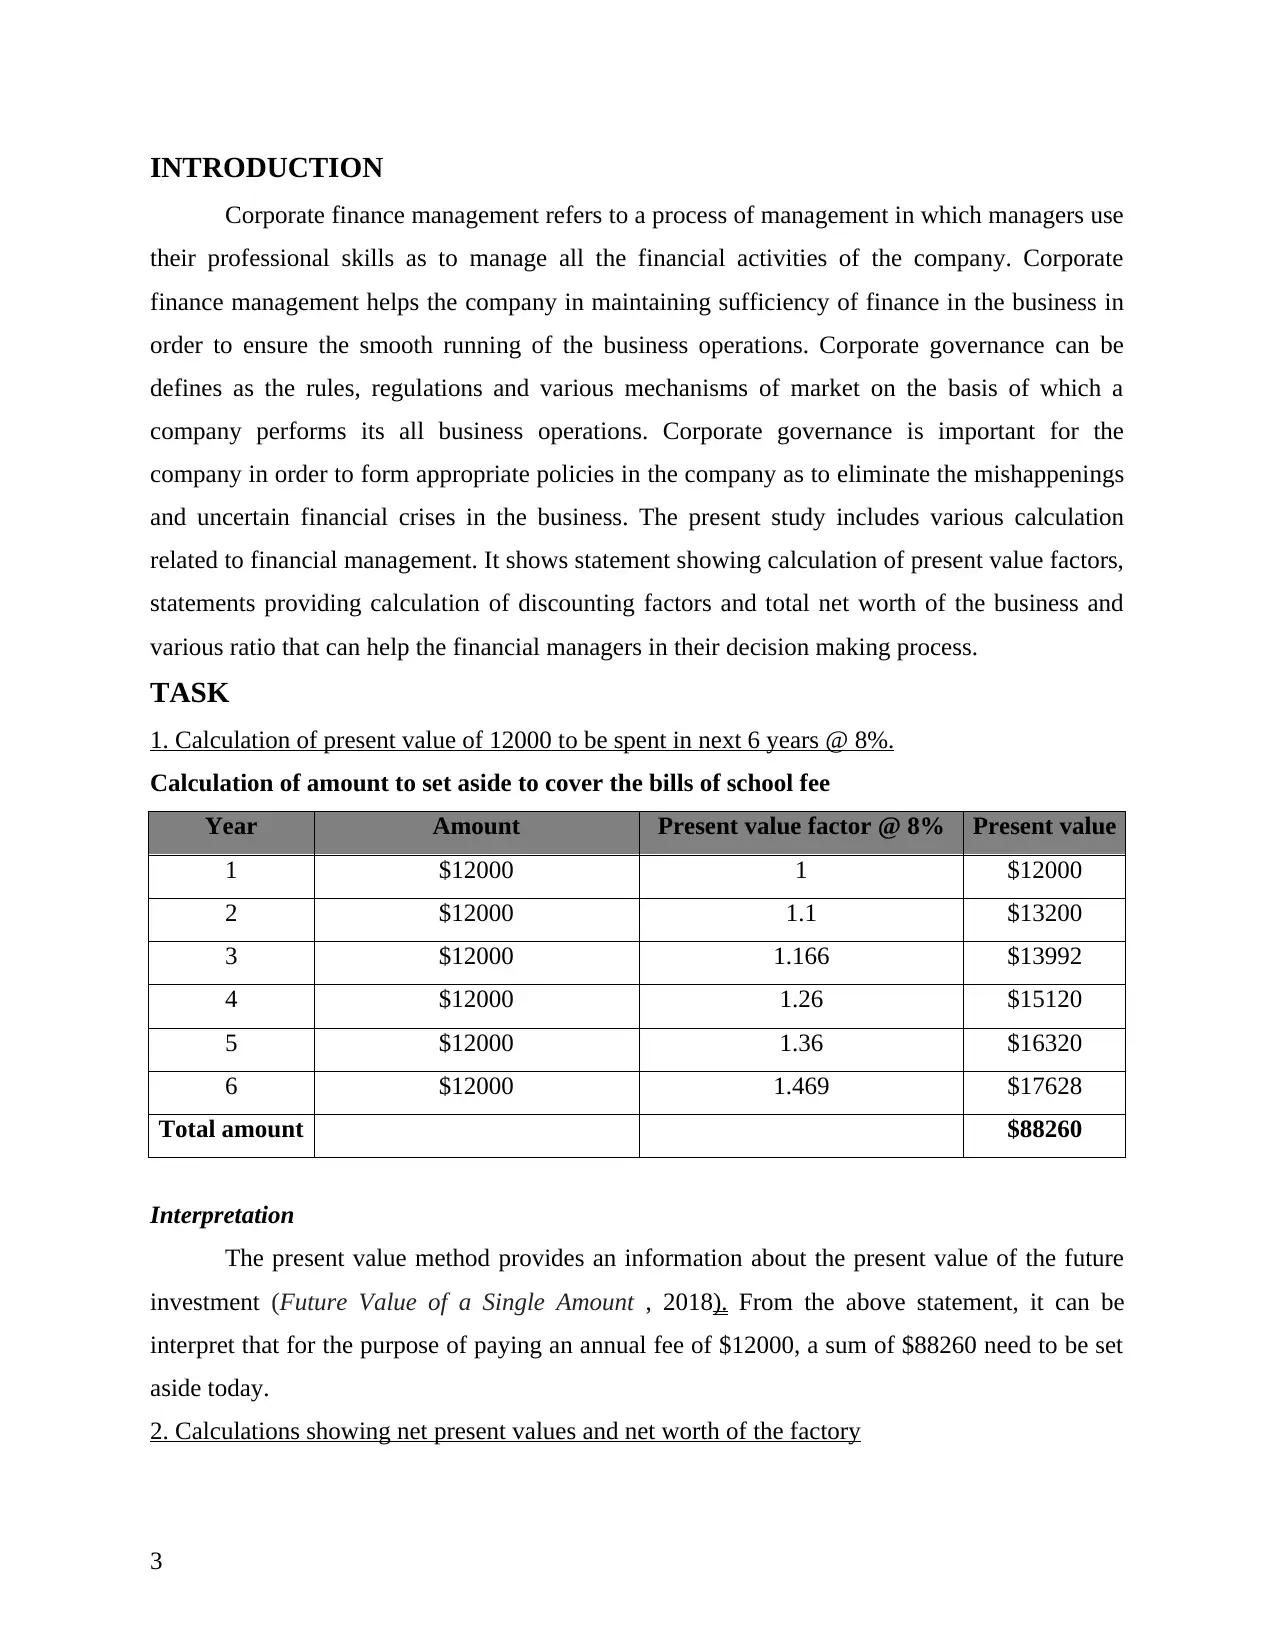
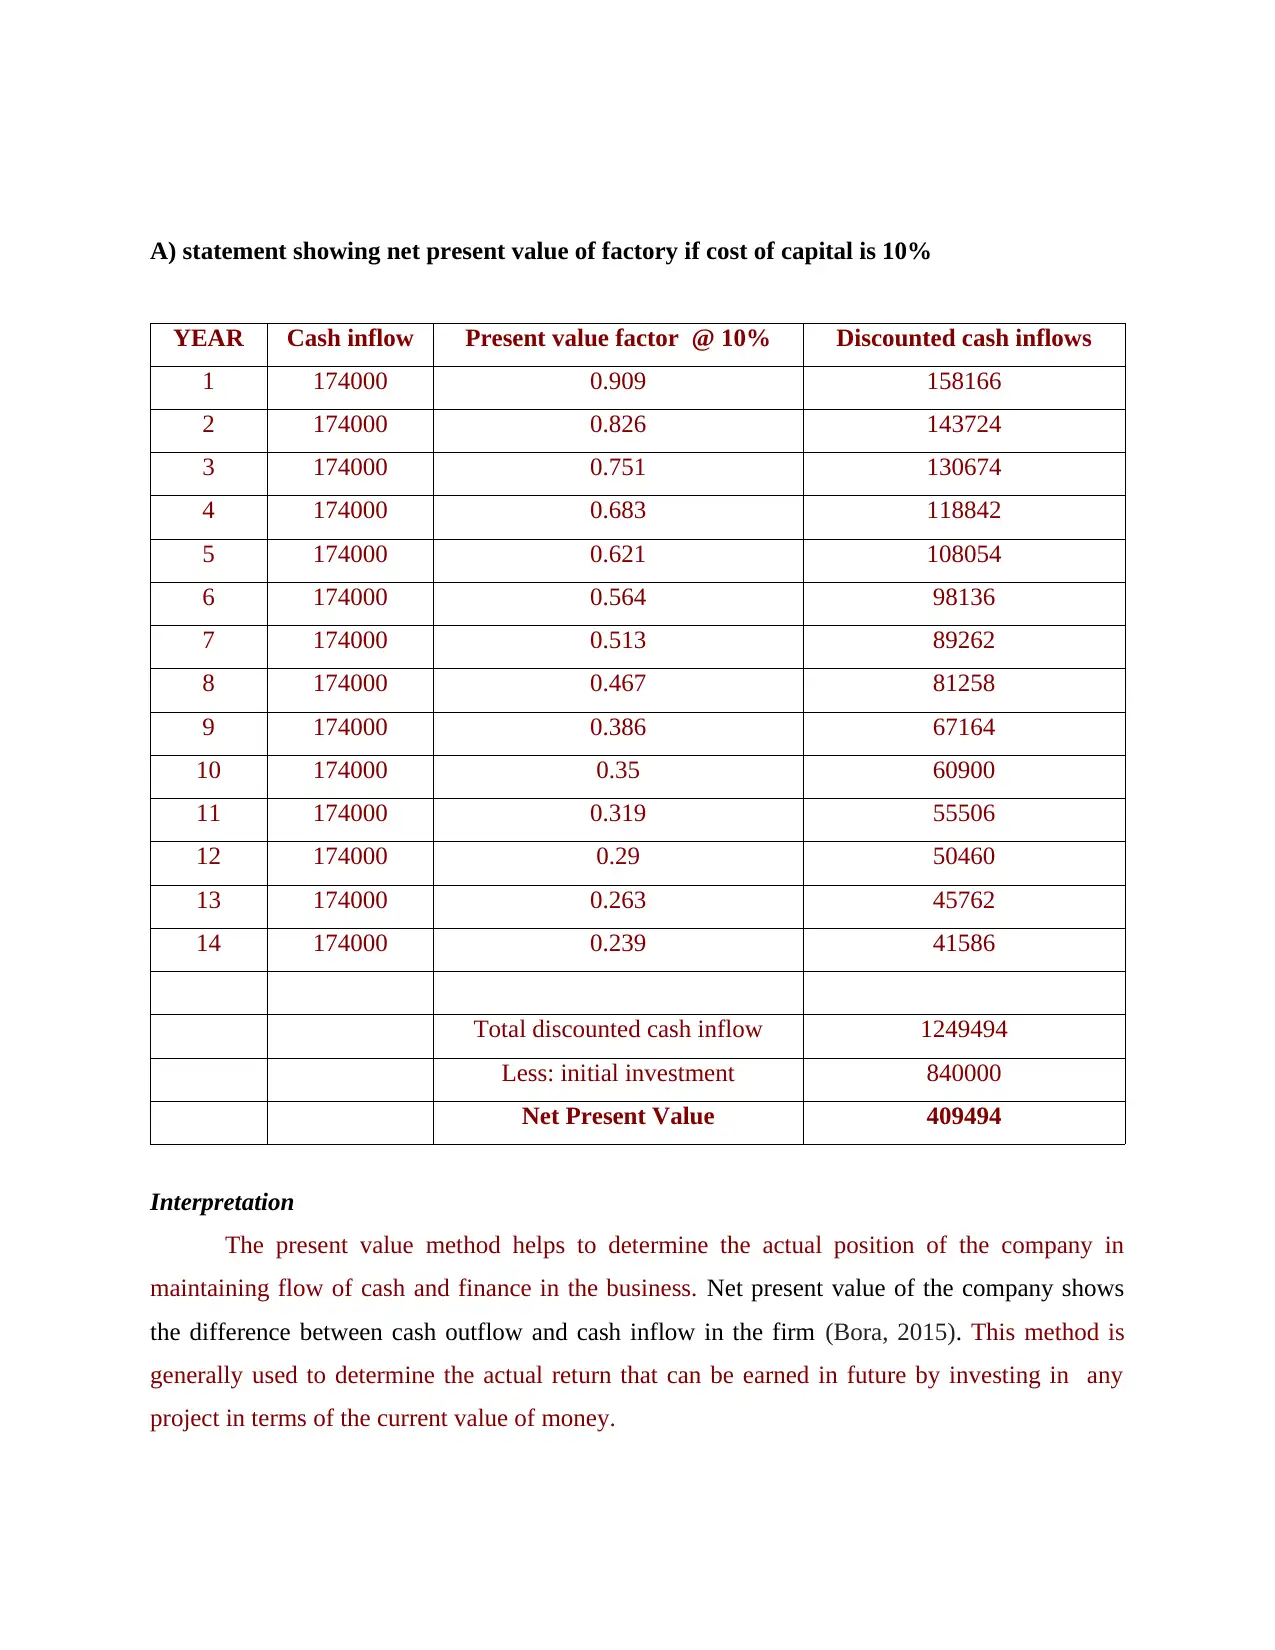
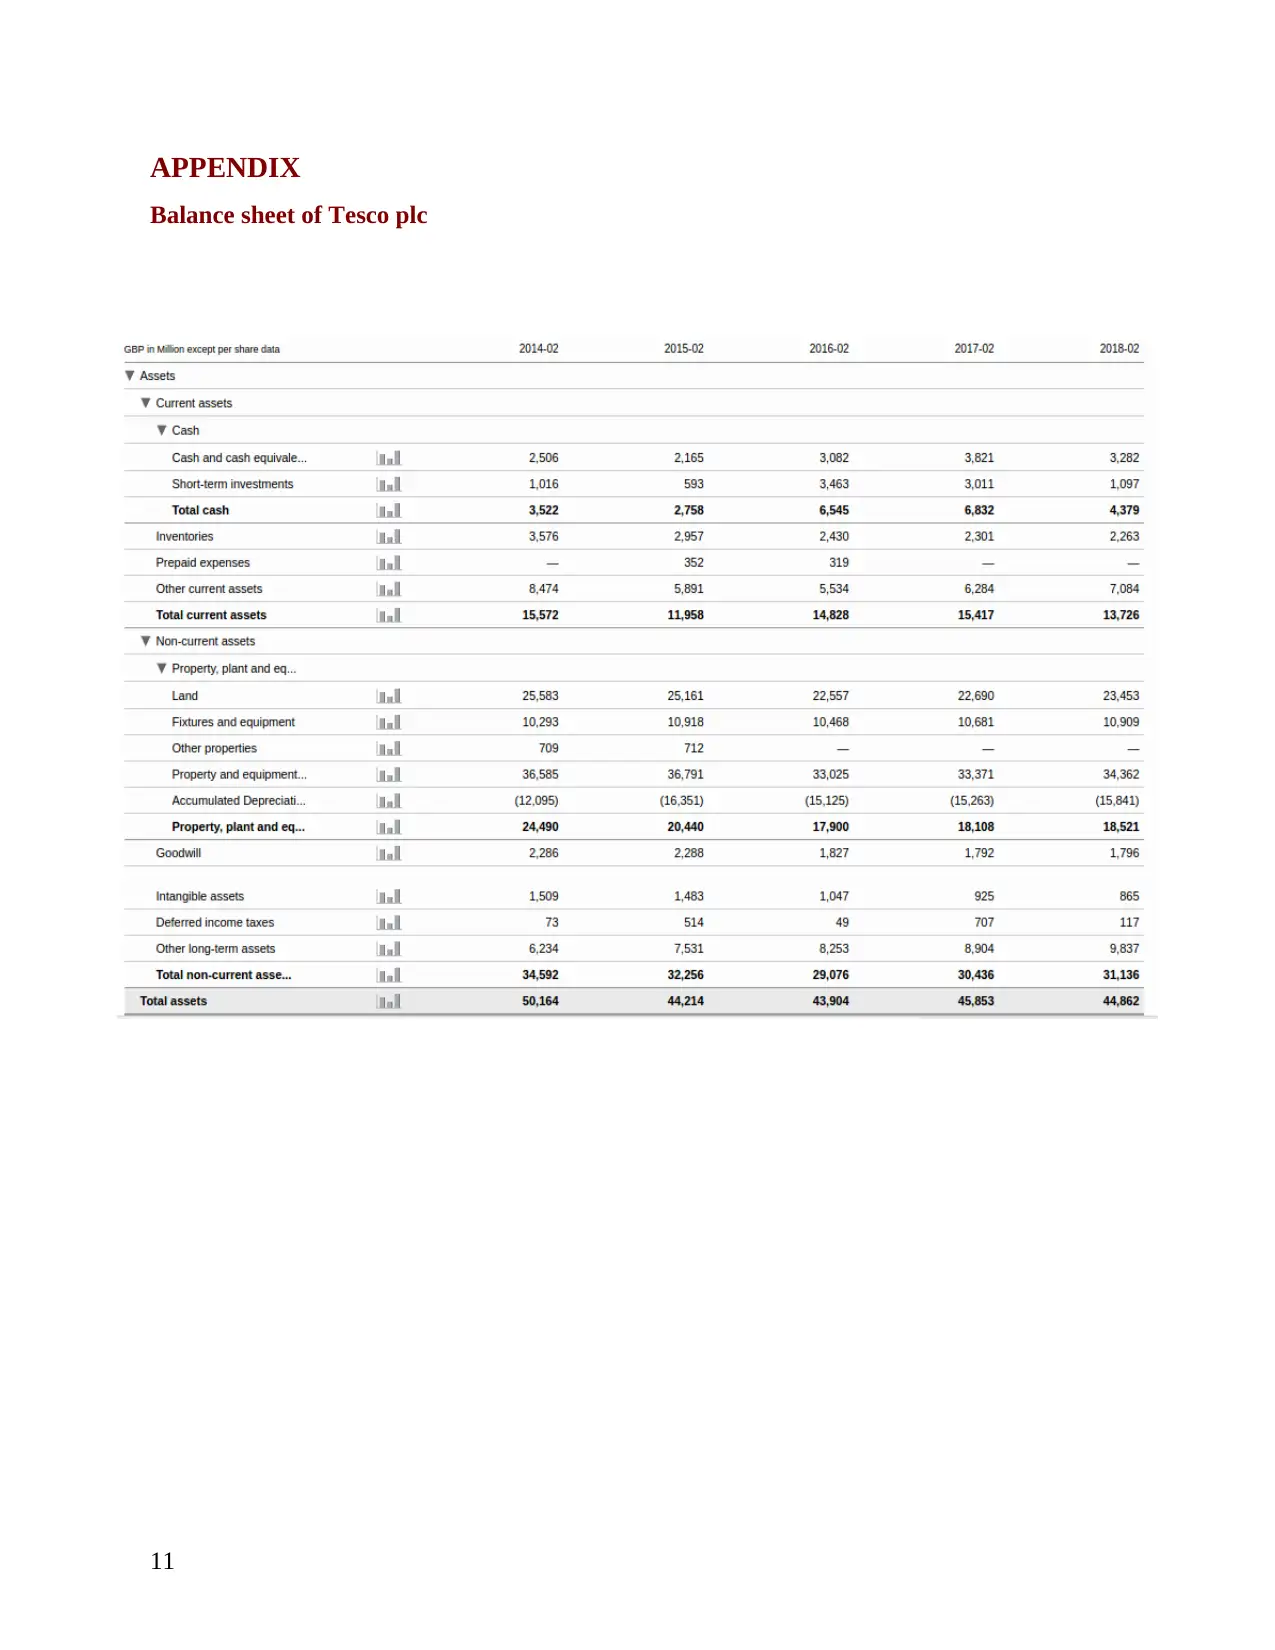
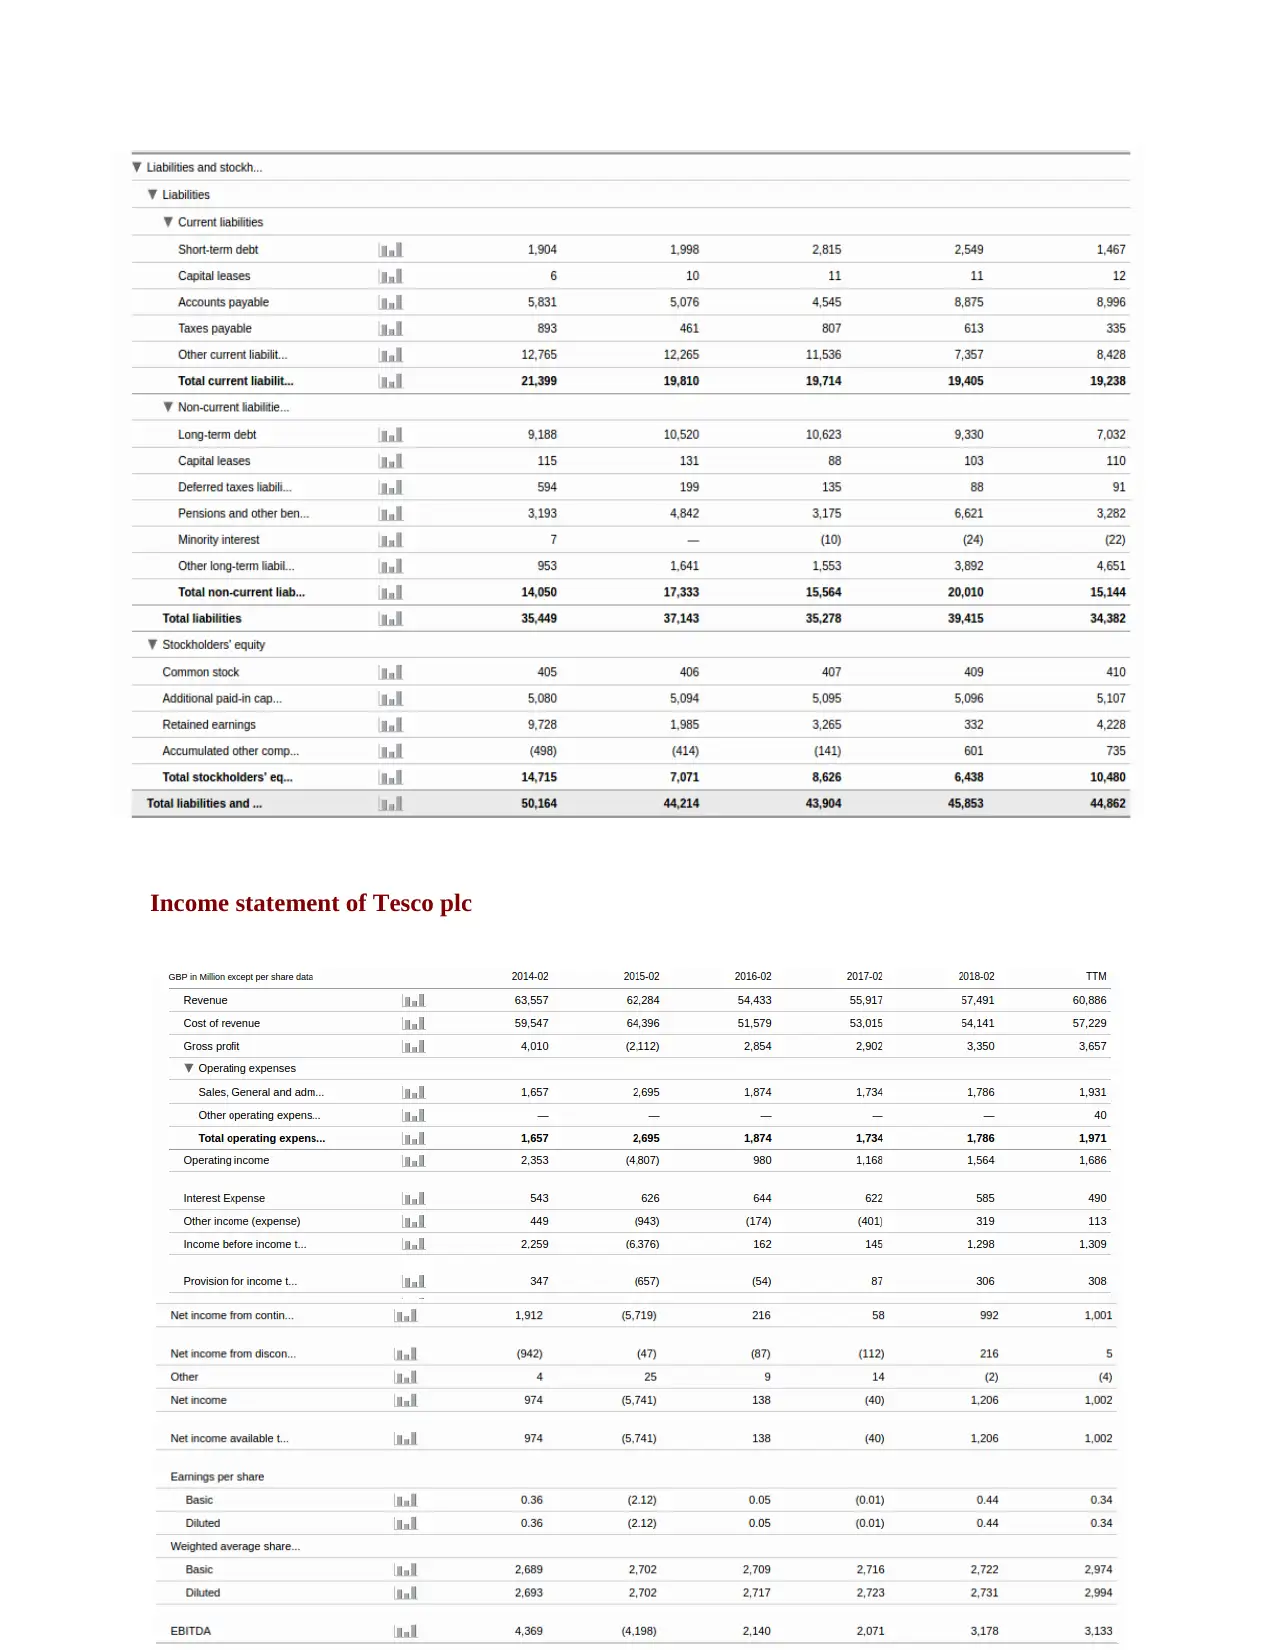
This report delves into corporate finance management and governance, presenting calculations and analyses relevant to financial decision-making. It begins with the calculation of present values, determining the amount needed to be set aside for future expenses. The report then proceeds to calculate the net present value and net worth of a factory investment, providing insights into the profitability and financial position of the business. Furthermore, the report includes a detailed analysis of financial ratios for Tesco plc, including the current ratio, return on equity, and price-earning ratio. These ratios are interpreted and compared to assess the company's financial health and aid in investment decision-making. The report concludes with an evaluation of Tesco's financial condition and offers recommendations for potential investors, considering the associated risks and opportunities.
Document Page
CORPORATE
FINANCE
MANAGEMENT AND
GOVERNANCE
tabler-icon-diamond-filled.svg

Paraphrase This Document

Need a fresh take? Get an instant paraphrase of this document with our AI Paraphraser
Document Page
TABLE OF CONTENTS
INTRODUCTION...........................................................................................................................3
TASK...............................................................................................................................................3
1. Calculation of present value of 12000 to be spent in next 6 years @ 8%...............................3
2. Calculations showing net present values and net worth of the factory...................................3
3. Calculation of ratios for Tesco plc..........................................................................................5
CONCLUSION................................................................................................................................8
REFERENCES................................................................................................................................9
Document Page
INTRODUCTION
Corporate finance management refers to a process of management in which managers use
their professional skills as to manage all the financial activities of the company. Corporate
finance management helps the company in maintaining sufficiency of finance in the business in
order to ensure the smooth running of the business operations. Corporate governance can be
defines as the rules, regulations and various mechanisms of market on the basis of which a
company performs its all business operations. Corporate governance is important for the
company in order to form appropriate policies in the company as to eliminate the mishappenings
and uncertain financial crises in the business. The present study includes various calculation
related to financial management. It shows statement showing calculation of present value factors,
statements providing calculation of discounting factors and total net worth of the business and
various ratio that can help the financial managers in their decision making process.
TASK
1. Calculation of present value of 12000 to be spent in next 6 years @ 8%.
Calculation of amount to set aside to cover the bills of school fee
Year Amount Present value factor @ 8% Present value
1 $12000 1 $12000
2 $12000 1.1 $13200
3 $12000 1.166 $13992
4 $12000 1.26 $15120
5 $12000 1.36 $16320
6 $12000 1.469 $17628
Total amount $88260
Interpretation
The present value method provides an information about the present value of the future
investment (Future Value of a Single Amount , 2018). From the above statement, it can be
interpret that for the purpose of paying an annual fee of $12000, a sum of $88260 need to be set
aside today.
2. Calculations showing net present values and net worth of the factory
3
Document Page
A) statement showing net present value of factory if cost of capital is 10%
YEAR Cash inflow Present value factor @ 10% Discounted cash inflows
1 174000 0.909 158166
2 174000 0.826 143724
3 174000 0.751 130674
4 174000 0.683 118842
5 174000 0.621 108054
6 174000 0.564 98136
7 174000 0.513 89262
8 174000 0.467 81258
9 174000 0.386 67164
10 174000 0.35 60900
11 174000 0.319 55506
12 174000 0.29 50460
13 174000 0.263 45762
14 174000 0.239 41586
Total discounted cash inflow 1249494
Less: initial investment 840000
Net Present Value 409494
Interpretation
The present value method helps to determine the actual position of the company in
maintaining flow of cash and finance in the business. Net present value of the company shows
the difference between cash outflow and cash inflow in the firm (Bora, 2015). This method is
generally used to determine the actual return that can be earned in future by investing in any
project in terms of the current value of money.
tabler-icon-diamond-filled.svg

Paraphrase This Document

Need a fresh take? Get an instant paraphrase of this document with our AI Paraphraser
Document Page
From the above statement it can be analysed that if the factory invests 174000 in the
factory, at cost of capital @ 10%, the new present value of company will be 409494 at the end of
14 years.
B) calculation of total net worth of the factory at the end of seven years.
Year
Cash
inflow
Present value factor @
10%
Discounted cash
inflows
Cumulative discounted
cash flow
1 174000 0.909 158166 158166
2 174000 0.826 143724 301890
3 174000 0.751 130674 432564
4 174000 0.683 118842 551406
5 174000 0.621 108054 659460
6 174000 0.564 98136 757596
7 174000 0.513 89262 846858
Total discounted cash
inflow 846858
Less: initial investment 840000 840000
Net Present Value 6858 6858
Interpretation
Net worth of the firm can be defined as the value of the shareholders of the company
(Craig, 2016). The net worth of the firm can be determined by calculating difference between
total assets and total liability of the business.
From the above calculations, it can be interpret that the net worth of the firm after 7 years
will be amounted to 6858. The net worth if the firm has been determined after adjusting the
amount of initial investment from the total cash flows of the firm after 7 years.
3. Calculation of ratios for Tesco plc
3.1 identification and collection of data:
As per the Bloomberg, the following data has been collected about Tesco plc:
5
Document Page
Particulars 2014 2015 2016 2017 2018
Current assets 15572 11958 14828 15417 13726
Current
liabilities
21399 19810 19714 19405 19238
Net income 974 -5741 138 -40 1206
Shareholders
equity
14715 7071 8626 6438 10480
3.2 calculation of various ratios
Current ratio
Particulars Formula 2014 2015 2016 2017 2018
Current
assets 15,572 11,958 14,828 15,417 13,726
Current
liabilities 21399 19810 19714 19405 19238
Current
ratio
Current assets /
current
liabilities 0.73 0.60 0.75 0.79 0.71
The current ratio of the company shows the amount of liquidity of the firm during a
specific time period (Bessis, 2015). The ideal current ratio is 2:1 in context with the maintenance
of liquidity in the firm. The above calculation shows that current ratio of the Tesco is increasing
over the year. It shows the enhancement of liquidity in the firm.
Return on equity
Particulars Formula 2014 2015 2016 2017 2018
Net income 974 -5741 138 -40 1206
Shareholder
s equity 14715 7071 8626 6438 10480
Document Page
Return On
Equity
Net income
/
shareholder
s equity 6.62% -81.19% 1.60% -0.62% 11.51%
The return on equity can be shows the earning capacity of the shareholders from the
company. Higher the return on equity shows higher amount of return to the shareholder
(Shushing, Bader and Klauk, 2017). From the above calculation, it can be analysed that the
return on equity is fluctuating in Tesco year by year. It shows the higher amount of risk of
shareholder in making investment in the business.
Price earning ratio
Particulars Formula 2014 2015 2016 2017 2018
Price
earning
ratio MPS / EPS 18.6 19.0 20.3 22.9 17.2
Price earning ratio can be defined as the income earned by the company per share. It can
also be termed as the current market price of the shares of the company (Grace, 2015) . From the
above calculation, it can be interpret that the market value per share of the company is being
increasing over the year. Although, it has been decreased in the year 2018 as compare to the
previous year i.e. 2017.
3.3 Interpretation and comparison of ratios as to take decision about making investment in
the Tesco.
From the analysis of above ratios and making comparison it with other ratios, it cam be
interpret that. Financial condition of the Tesco is growing over the year (Birchler, 2017). The
liquidity of the business i.e. current ratio of the Tesco is being increasing over the year and
growing towards 2:1, through which it can be analysed the company is becoming more efficient
in terms of maintaining liquidity in the business.
Further, it can also be interpret that the earning capacity of the shareholders of the Tesco
i.e. return on equity of the business is being fluctuated over the year. From this interpretation it
7
tabler-icon-diamond-filled.svg

Paraphrase This Document

Need a fresh take? Get an instant paraphrase of this document with our AI Paraphraser
Document Page
can be analysed that, the risk of shareholders of Tesco is at its highest. Therefore, shareholders of
the company need to be careful before investing their amount in the business.
By interpreting price earning ratio of the Tesco it can be analysed that the market price
per share of the firm is increasing over the year. Although there is a huge decline in the market
price of the share in the year 2018. It can be occurred due to rapid enhancement of risk of the
shareholders in the company.
Investment Decision making
From the above analysis it can be evaluated that the Tesco that they should take the
decision of investing in the company carefully. Although, the risk of getting return on the
investment in the company is high (Hayati, 2016). But, The liquidity of the firm is rapidly
increasing which may lead in reduction of the risk of return on equity.
Therefore, it can be interpret that the decision of investing in Tesco is can not be termed
as a bad decision. Although, investing a large amount may be seems risky for the individual.
Hence, investment in the company can be made, but the investment need to be in small amount.
So that risk of suffering huge loss can be eliminated.
CONCLUSION
From the above study it can be concluded that the financial management methods
provides range of information about the company, with help of which investors can make
decision about their investments. The study has provided various methods to determine various
information that could in the investment decisions. The study has showed the calculation of net
present value of the school fee to be paid on yearly basis. It has helped in determining the
amount that needed to be set aside at present. The study has also showed a calculation of
discounted cash flow with the help of which the net worth of the firm can be determined. At the
end of study, it has also shown the actual financial position of the Tesco by determining some
Document Page
financial ratios. On the basis of these ratios, by comparing them and making their complete
analysis, the study has also provided investment decision in the Tesco plc.
9
Document Page
REFERENCES
Books and Journals
Bessis, J., 2015. Risk management in banking. John Wiley & Sons.
Birchler, U., 2017. The Return on Equity. In Economic Ideas You Should Forget (pp. 23-25).
Springer, Cham.
Bora, B., 2015. Comparison between net present value and internal rate of return. International
Journal of Research in Finance and Marketing. 5(12). pp.61-71.
Craig, S.G. and et.al., 2016. How do politicians save? Buffer-stock management of
unemployment insurance finance. Journal of Urban Economics. 93. pp.18-29.
Grace, M.F. and et.al., 2015. The value of investing in enterprise risk management. Journal of
Risk and Insurance. 82(2). pp.289-316.
Hayati, N., 2016. Faktor-faktor yang mempengaruhi Price Earning Ratio (PER) Sebago salah
satu criteria deputising investors sham Persian real estate Dan property di bursa effect
Indonesia. Journal Management Dan Acutance. 11(1).
Zschieschang, U., Bader, V.P. and Klauk, H., 2017. Below-one-volt organic thin-film transistors
with large on/off current ratios. Organic Electronics. 49. pp.179-186.
Online
Future Value of a Single Amount .2018. [Online] Available Through:
<https://www.accountingcoach.com/future-value-of-a-single-amount/explanation/3>
tabler-icon-diamond-filled.svg

Paraphrase This Document

Need a fresh take? Get an instant paraphrase of this document with our AI Paraphraser
Document Page
APPENDIX
Balance sheet of Tesco plc
11
Document Page
Income statement of Tesco plc
chevron_up_icon
1 out of 13
circle_padding
hide_on_mobile
zoom_out_icon
[object Object]