Financial Analysis: Coca-Cola HBC AG and NMC Health Plc Report

Verified

Added on  2022/12/19

|4
|1113
|1
Report
AI Summary
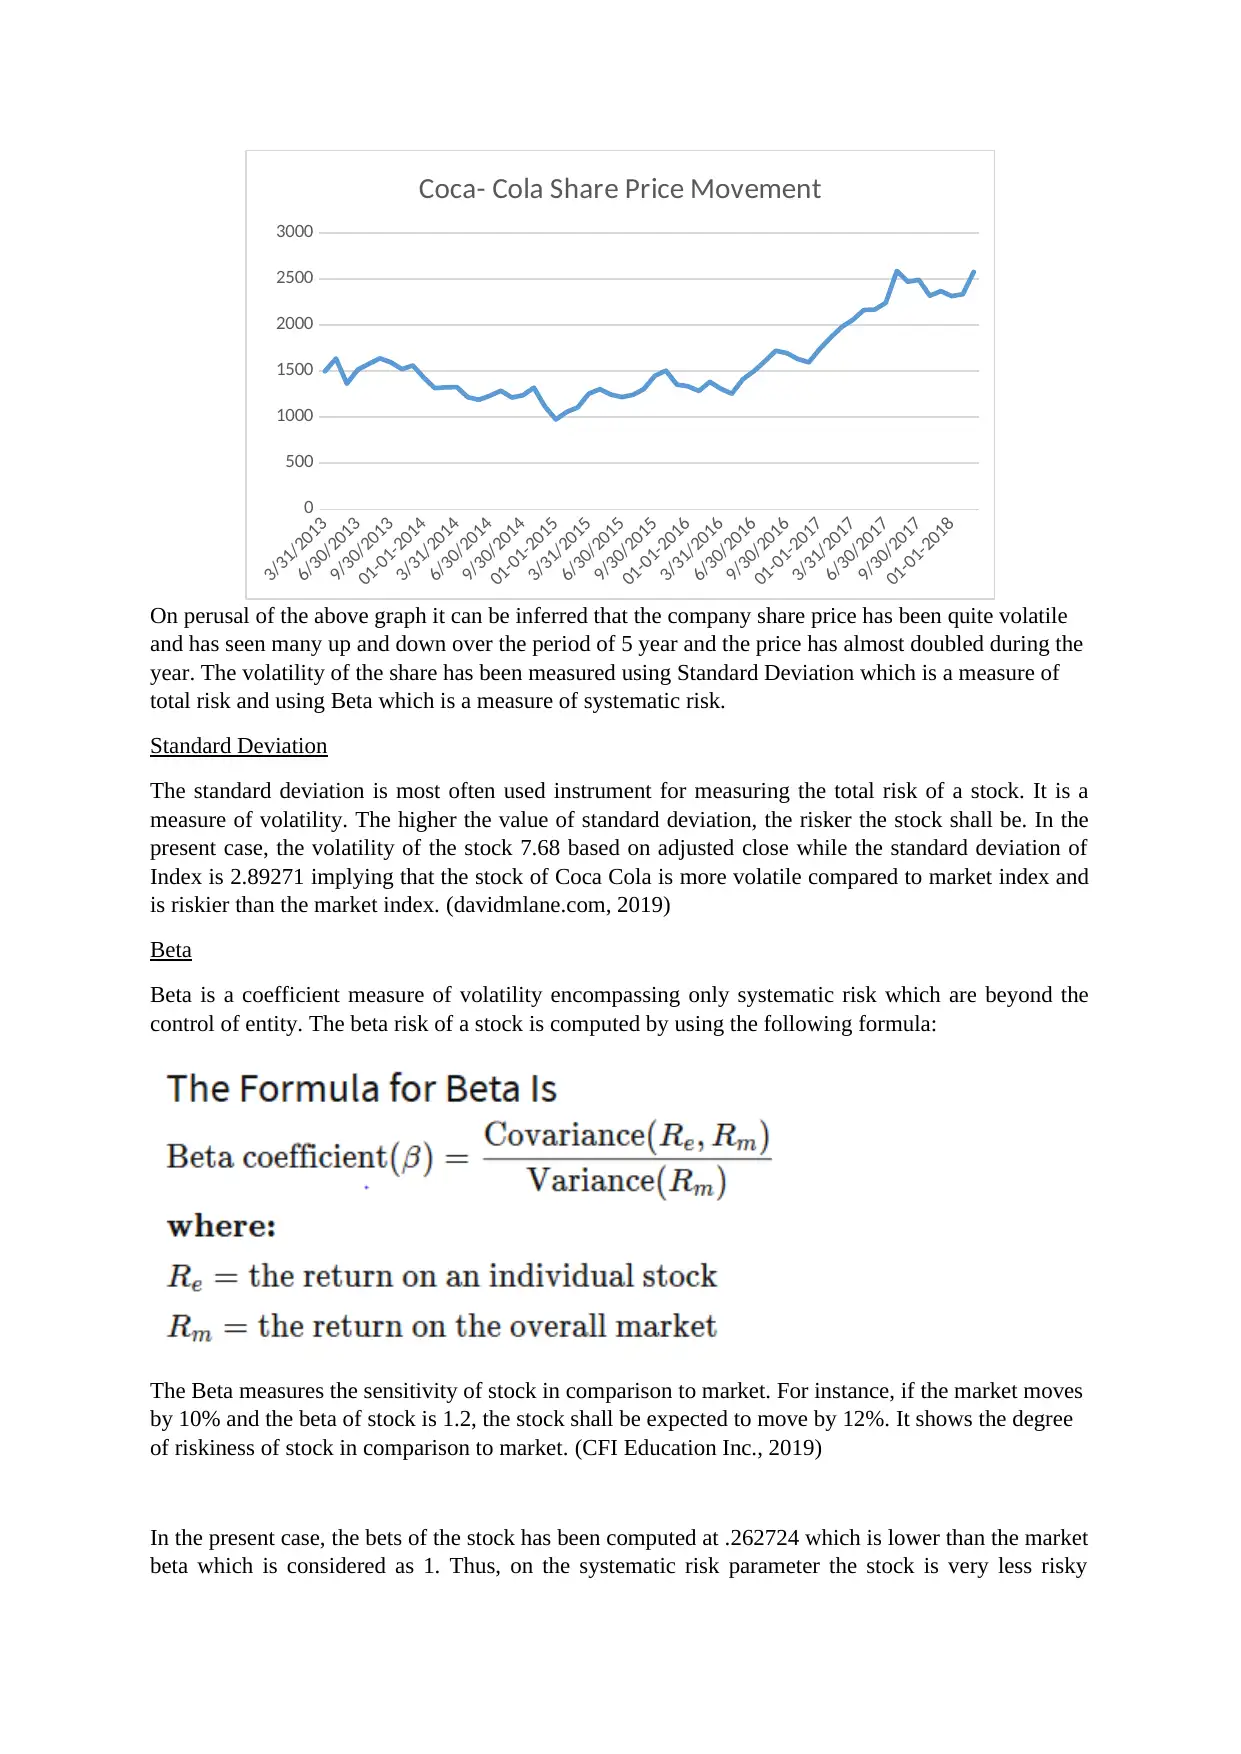
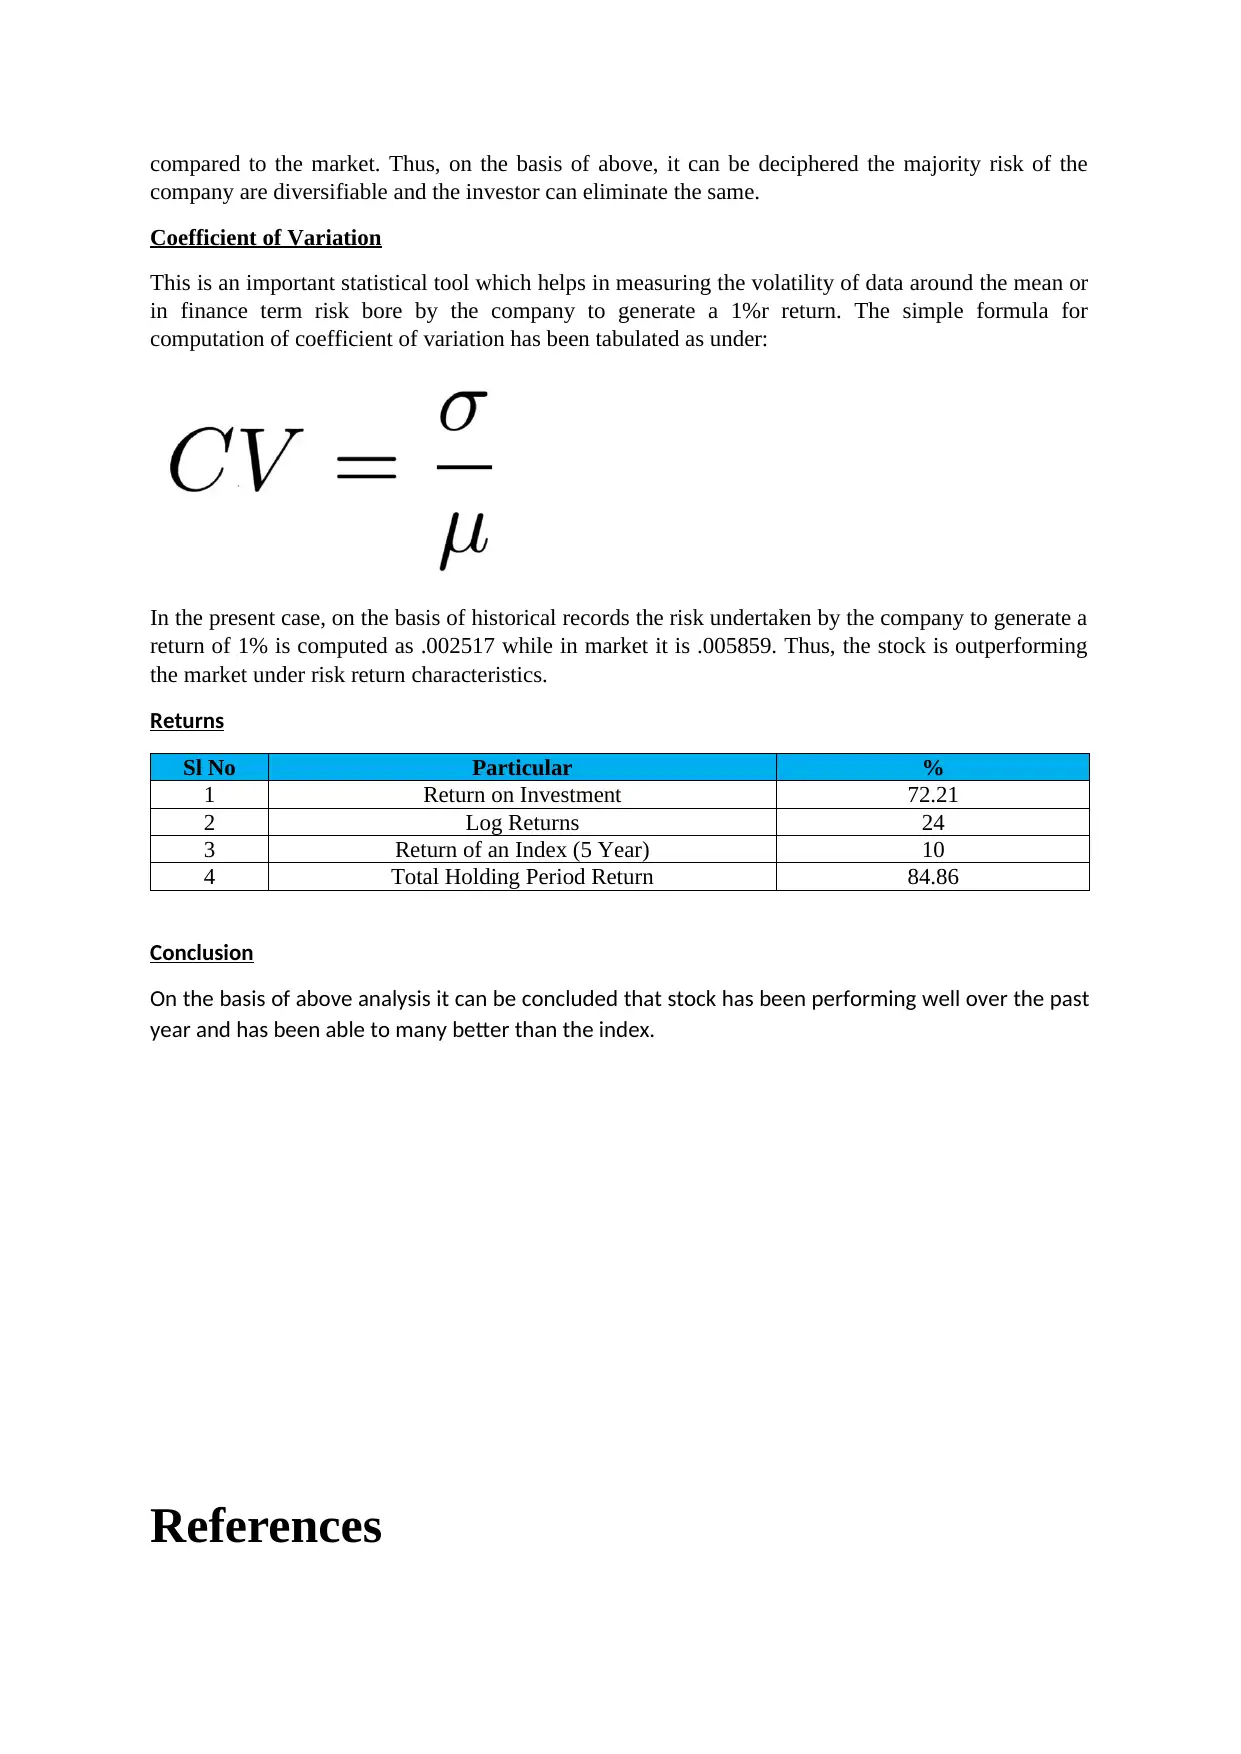
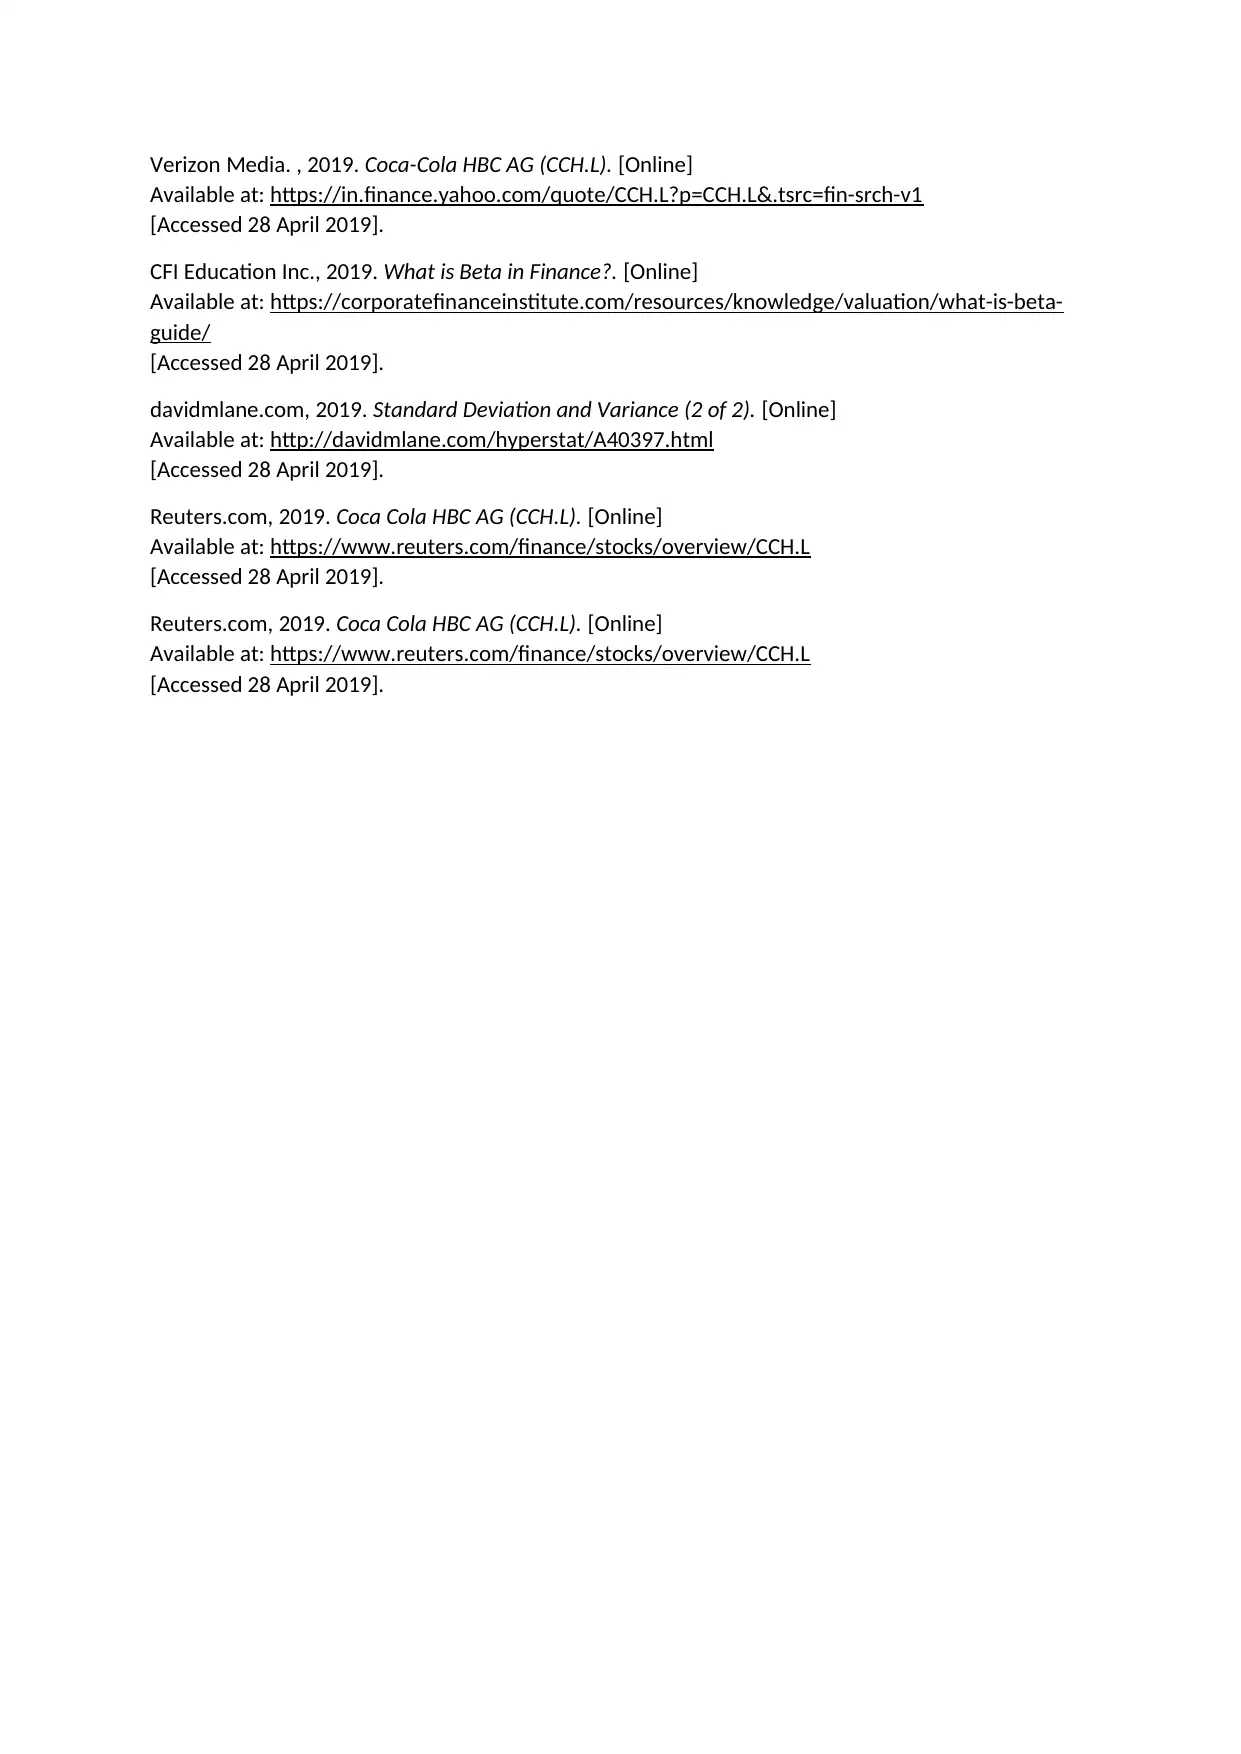
This report presents a corporate financial analysis of Coca-Cola HBC AG, a Switzerland-based bottler listed on the London Stock Exchange. The analysis includes an overview of the company's business, market capitalization, and key financial ratios like P/E ratio, EPS, ROI, and ROE, comparing them to industry and sectoral averages. The report examines the company's stock price movement over a five-year period, highlighting its volatility and growth. It calculates and interprets standard deviation, beta, and coefficient of variation to assess the company's risk profile. Furthermore, the report evaluates the return performance of the stock and concludes that the stock has been performing well compared to the index. The analysis also addresses the limitations of using the FTSE 100 Index as a proxy for the market portfolio. The report utilizes financial data and statistical tools to provide a comprehensive assessment of the company's financial health and performance.
Document Page
Corporate Financial Analysis
Introduction
The report deals with analysis of two listed entities on London Stock Exchange and included in FTSE.
The characteristics of the companies analysed includes risk, return etc. Further, the companies chosen
for analysis includes Coca Cola HBC AG and NMC Health Plc. The last traded price of Coca Cola
HBC AG on the recognised stock exchange is 2756 GBP with a change of negative 2. ( Verizon
Media. , 2019)
Facts about the company
Coca Cola HBC AG, is a Switzerland based bottler company listed on London Stock Exchange. The
company marks its presence across globe encompassing both developed and developing market. The
company has various big brand under its domain encompassing Coca-Cola. Fanta, Sprite as well as
water, juice and energy drinks. The company has a market capitalisation of GBP 10,0002.79 Million
with 326.92 Million share outstanding.
Currently, the company has P/E Ratio of 26.42 with average industry P/E of 30.21 and sectoral P/E of
32.47. Further, the company has been generating return higher than the competitors and industry
peers. A brief snapshot of the industrial and sectoral market has been presented as below:
Sl. No Ratio CCH.L Industry Sector
1 P/E(TTM) 26.42 30.21 32.47
2 EPS(TTM) 1.04
3 ROI 9.38 7.08 49.69
4 ROE 14.62 11.92 60.06
(Reuters.com, 2019)
Analysis of the company
The Coca Cola HBC AG prices have doubled over the period of 60 months mostly on account of
strong fundamentals and growth witnessed by the company in the past years. Further, the company
has also engaged in inorganic through acquisition and diversification. The recent acquisition of Bambi
clearly states the same. (Reuters.com, 2019)
The price movement of the company over the past 5 years have been plotted here-in-below:
tabler-icon-diamond-filled.svg

Paraphrase This Document

Need a fresh take? Get an instant paraphrase of this document with our AI Paraphraser
Document Page
On perusal of the above graph it can be inferred that the company share price has been quite volatile
and has seen many up and down over the period of 5 year and the price has almost doubled during the
year. The volatility of the share has been measured using Standard Deviation which is a measure of
total risk and using Beta which is a measure of systematic risk.
Standard Deviation
The standard deviation is most often used instrument for measuring the total risk of a stock. It is a
measure of volatility. The higher the value of standard deviation, the risker the stock shall be. In the
present case, the volatility of the stock 7.68 based on adjusted close while the standard deviation of
Index is 2.89271 implying that the stock of Coca Cola is more volatile compared to market index and
is riskier than the market index. (davidmlane.com, 2019)
Beta
Beta is a coefficient measure of volatility encompassing only systematic risk which are beyond the
control of entity. The beta risk of a stock is computed by using the following formula:
The Beta measures the sensitivity of stock in comparison to market. For instance, if the market moves
by 10% and the beta of stock is 1.2, the stock shall be expected to move by 12%. It shows the degree
of riskiness of stock in comparison to market. (CFI Education Inc., 2019)
In the present case, the bets of the stock has been computed at .262724 which is lower than the market
beta which is considered as 1. Thus, on the systematic risk parameter the stock is very less risky
3/31/2013
6/30/2013
9/30/2013
01-01-2014
3/31/2014
6/30/2014
9/30/2014
01-01-2015
3/31/2015
6/30/2015
9/30/2015
01-01-2016
3/31/2016
6/30/2016
9/30/2016
01-01-2017
3/31/2017
6/30/2017
9/30/2017
01-01-2018
0
500
1000
1500
2000
2500
3000
Coca- Cola Share Price Movement
Document Page
compared to the market. Thus, on the basis of above, it can be deciphered the majority risk of the
company are diversifiable and the investor can eliminate the same.
Coefficient of Variation
This is an important statistical tool which helps in measuring the volatility of data around the mean or
in finance term risk bore by the company to generate a 1%r return. The simple formula for
computation of coefficient of variation has been tabulated as under:
In the present case, on the basis of historical records the risk undertaken by the company to generate a
return of 1% is computed as .002517 while in market it is .005859. Thus, the stock is outperforming
the market under risk return characteristics.
Returns
Sl No Particular %
1 Return on Investment 72.21
2 Log Returns 24
3 Return of an Index (5 Year) 10
4 Total Holding Period Return 84.86
Conclusion
On the basis of above analysis it can be concluded that stock has been performing well over the past
year and has been able to many better than the index.
References
Document Page
Verizon Media. , 2019. Coca-Cola HBC AG (CCH.L). [Online]
Available at: https://in.finance.yahoo.com/quote/CCH.L?p=CCH.L&.tsrc=fin-srch-v1
[Accessed 28 April 2019].
CFI Education Inc., 2019. What is Beta in Finance?. [Online]
Available at: https://corporatefinanceinstitute.com/resources/knowledge/valuation/what-is-beta-
guide/
[Accessed 28 April 2019].
davidmlane.com, 2019. Standard Deviation and Variance (2 of 2). [Online]
Available at: http://davidmlane.com/hyperstat/A40397.html
[Accessed 28 April 2019].
Reuters.com, 2019. Coca Cola HBC AG (CCH.L). [Online]
Available at: https://www.reuters.com/finance/stocks/overview/CCH.L
[Accessed 28 April 2019].
Reuters.com, 2019. Coca Cola HBC AG (CCH.L). [Online]
Available at: https://www.reuters.com/finance/stocks/overview/CCH.L
[Accessed 28 April 2019].
chevron_up_icon
1 out of 4
circle_padding
hide_on_mobile
zoom_out_icon
[object Object]