Corporate Accounting Report: Retail Company Financial Analysis
VerifiedAdded on 2020/11/23
|36
|5302
|375
Report
AI Summary
This report presents a comprehensive analysis of corporate accounting practices, focusing on three Australian retail companies: Thorn Group, PAS Group, and The Reject Shop Ltd. It examines the items of equity and liabilities, detailing changes over three years and providing comparative analyses. The report delves into cash flow statements, highlighting major items and comparative insights, followed by an examination of the other comprehensive income statements, including item identification and reasons for their exclusion from the income statement. Additionally, the report investigates accounting for corporate income tax, covering tax expenses, effective tax rates, deferred tax assets and liabilities, and cash tax calculations. The analysis includes detailed tables and comparative ratios, offering a robust overview of the financial performance and accounting practices of the selected companies.
Corporate Accounting
Paraphrase This Document
Need a fresh take? Get an instant paraphrase of this document with our AI Paraphraser
Table of Contents
EXECUTIVE SUMMARY.............................................................................................................4
INTRODUCTION...........................................................................................................................1
EQUITY AND LIABILITIES.........................................................................................................1
(i) Item of equity and associated information about the companies:...........................................1
(ii) Item of Liabilities and associated information about the companies:...................................2
(iii) Comparative analysis............................................................................................................5
CASH FLOW STATEMENT..........................................................................................................6
(iv) Major items of cash flow statements....................................................................................6
(v) Comparative analysis:............................................................................................................7
(vi) Comparative analysis of selected companies along with proper insight..............................9
OTHER COMPREHENSIVE INCOME STATEMENT................................................................9
(vii) Items in comprehensive profit and loss statements of both company.................................9
(viii) Reason why such items not been reported in Income Statement......................................10
(ix) Comparative analysis:.........................................................................................................10
(x) Comprehensive income to be included in evaluating the performance of manager............11
ACCOUNTING FOR CORPORATE INCOME TAX.................................................................11
(xi) Tax expenses shown in financial statements of selected companies:.................................11
(xii) Effective tax rate................................................................................................................11
(xiii) Deferred tax assets / liabilities and evaluation of changes:..............................................12
(xiv) increase or decrease in the deferred tax assets or in the deferred tax liability reported by
each of your selected companies:..............................................................................................12
(xv) & (xvi) Calculation of cash tax amount:............................................................................13
(xvii) Difference between cash tax rate and book rate:.............................................................13
CONCLUSION..............................................................................................................................14
REFERENCES..............................................................................................................................15
APPENDIX....................................................................................................................................16
Tax expenses shown in financial statements of Thorn Ltd.:.....................................................28
Tax expenses shown in financial statements of PAS Group.:...................................................28
Tax expenses shown in financial statements of Reject Shop.:..................................................29

Deferred tax assets / liabilities :.................................................................................................29
⊘ This is a preview!⊘
Do you want full access?
Subscribe today to unlock all pages.
Trusted by 1+ million students worldwide
EXECUTIVE SUMMARY
This report summarises different aspects of the corporate accounting along with various
rules and regulation that can assists in analysing performance of selected public limited
companies in retail sector i.e. Thorn Group, PAS Group and The Reject Shop Ltd. In order to
analyse, this report exhibits each item of equity and liabilities, items of cash flow statements,
comprehensive income statement and tax calculation. This report also describes Cash Tax and
Book tax and reasons of variation between them. A deep analysis is done in this report to get
specific outcomes so the effective decisions can be made in near future.
Paraphrase This Document
Need a fresh take? Get an instant paraphrase of this document with our AI Paraphraser
INTRODUCTION
Corporate accounting is a major division of accounting which mainly concerned with the
accounting aspects of a particular company. Process of corporate accounting includes finalisation
of annual accounts, cash flow statements and change in equity (DeBusk, 2012). Corporate
accounting is about maintaining information related to finance in order to give direction for
compliance of regulations and policies. In this report three public limited companies i.e. Thorn
group ltd, Pas group ltd and reject shop ltd of Australia in retail sector is critically analysed by
using their three-year balance sheet, income statement, statement of changes in owner’s equity
and cash flow statement, in the context of corporate accounting. Apart from this, accounting for
corporate income tax is also effectively discussed in this report.
EQUITY AND LIABILITIES
(i) Item of equity and associated information about the companies:
Equity: In accounting terms Equity is difference between total assets and external
liabilities. In a limited company equity means shareholder's fund which includes share capital,
share premium and Retained earning which includes profits after distribution of dividends.
Following are the major items of Equity along with reasons of changes in equity during three
previous years as stated in financial statement of selected companies, are as follows:
Common stock: Common stock refers to ownerships within in a company. Common
stock includes securities, shares, bonds and debentures issued by company. Change in
common stock is found due to market conditions, economic conditions or dividend
distribution policy of company. In case of Thorn Group there is increase in common
stock due to issue of securities in market and in case of PAS Group and Reject Shop Ltd
common stock has no changes. Holders of common stock or equity have right to appoint
directors by exercising their voting powers (Zadek, Evans and Pruzan, 2013).
Retain earnings: Retained earnings is part of equity that contain amount remain after
providing dividends to shareholders. This is net amount of profit available after dividend
distribution for company to pay their all-time debts. Due to increased net profit in 2017
and 2018 Retained earnings of Thorn Group and Reject Ltd has increased respectively
where as in case of PAS Group there is negative retained earnings due to payment of
dividends.
1

Reserve: Reserves are part of company's equity that includes amount of share premium,
general reserves, capital reserves, debenture redemption reserves and other reserves
created by company as per requirements. Major change in reserves occurs due to sale of
any fixed assets, amalgamation, reconstruction etc (Edgerton, 2012). Reserves of Thorn
Group has increased from 2016 to 2018 due to share premium whereas reserves of Reject
Shop Ltd have increased due to creation of general reserve and in case of PAS group
there is decreasing negative reserve due to appropriation from Foreign currency
translation reserve and Corporate reorganisation reserve.
Following tables shows amount and comparative change in item of equity of Reject Shop
Ltd, PAS Group Limited and Thorn Group Ltd for three years:
(Amount in millions)
Items Year Thorn Group PAS Group The Reject Shop Ltd
Common stock 2018 117 154 46
2017 115 154 46
2016 110 154 46
Retained earning 2018 83 -29 96
2017 92 -22 86
2016 84 -23 86
Reserve 2018 3.03 -3 9
2017 2.98 -5 3
2016 2.1 -6 2
(ii) Item of Liabilities and associated information about the companies:
Liabilities: Liabilities shown in financial statement are divided in two major parts:
Current Liabilities and Non-Current Liabilities. Liabilities refers to monetary or non-monetary
debts or obligation payable by company during the course of business. Current liabilities include
debts payable within one year, while long-term liabilities include debts payable for more than
year. Current liabilities include Short-term debt, Accounts payable, deferred income taxes and
other current liabilities and non-current liabilities includes Long-term debt, Long term provisions
and other long term liabilities (Edwards, 2013). Such current and non-current liabilities are stated
in financial statement prepared by the company, some of them are discussed underneath:
2
⊘ This is a preview!⊘
Do you want full access?
Subscribe today to unlock all pages.
Trusted by 1+ million students worldwide
Accounts payable: Account payable or trade creditors refers to amount payable by
company to its suppliers. Generally, term of accounts payable is less than one year.
Following are the changes in accounts payable and reason of changes with respect to all
three companies:
I. Thorn Group: There is decrease in accounts payable from 2016 to 2018 due to
timely payment of credit purchases.
II. PAS Group: There is increase in accounts payable in 2018 due to late payment of
account payable and increase in credit sales.
III. Reject Shop Ltd: There is increase in accounts payable from 2016 to 2018 due to
increase in credit payment cycle period of company.
Deferred tax liabilities: Deferred tax liability is amount of tax estimated or due for the
current period but has not yet been paid. Deferred tax liability includes amount that
company will, in the future, pay more income tax because of a transaction that took place
during the current period. Changes in this in deferred tax liability arise due to amount of
tax payable it may be short term or long term. Following are the changes in Deferred tax
liabilities and reason of changes with respect to all three companies:
I. Thorn Group: There is decrease in deferred tax liabilities in 2018 and increase in 2017
due to increase in and decrease in financial lease receivables.
II. PAS Group: There is increase in deferred tax liabilities from 2016 to 2018 due to
temporary differences arising on investments except where PAS is able to control the
reversal of the temporary differences and it is probable that the temporary differences
will not reverse in the foreseeable future.
III. Reject Shop Ltd: There is no deferred tax liability in Reject Ltd.
Provisions: Provisions includes amount that is provided by company to pay future
contingencies. Provisions are created by companies as per their internal policies and due
to contingent obligation (Hoskin, Fizzell and Cherry, 2014). Due to happening of such
contingent event or obligation provisions is decreased or eliminated. Following are the
changes in amount of provisions and reason of changes with respect to all three
companies:
3
Paraphrase This Document
Need a fresh take? Get an instant paraphrase of this document with our AI Paraphraser
I. Thorn Group: There is decrease in amount of provisions in 2018 and increase in 2017 due
to Provisions used or reversed during the year and Provisions made during the year
respectively.
II. PAS Group: There is no change in amount of provision made for probable employee
benefits payments.
III. Reject Shop Ltd: There is increase in amount of provision in 2018 due to creation of
provision for shrinking expenses, onerous lease contract.
Overdraft: Overdraft means withdrawal of amount from bank' current account even if
bank account shows zero or negative balance. Following are the changes in amount of
overdraft and reason of changes with respect to all three companies:
I. Thorn Group: There is increase in amount of overdraft in 2018 to meet the working
capital requirements.
II. PAS Group: there is overdraft facility availed by company from bank only in 2018 to pay
its day to day expenses.
III. Reject Shop Ltd: There is no overdraft in Reject Shop Ltd.
Long term borrowings or long term debt: It refers to amount borrowed for a period
exceeding 12 months from bank or other financial institution. Long term borrowings
include bank loan, mortgage bonds, debenture, or other obligations not due for one year.
Companies are required to disclose its long-term debt in its financial statements along
with interest rate and date of maturity. Increase in long term borrowings shows
dependences of company on debts instead of equity or inability to pay debts. Following
are the changes in amount of Long term borrowings and reason of changes with respect
to all three companies:
Thorn Group: There is increase in amount of overdraft in 2018 to meet the working
capital requirements.
PAS Group: There is increase in amount of long term borrowings in 2018 to borrowing
taken for payment of lease incentives remain due.
Reject Shop Ltd: There is increase in amount of long term borrowings from 2016 to 2018
due to increase in borrowing taken for payment of rent escalation.
Following tables assists in interpreting data of Reject Shop Ltd, PAS Group Limited and
Thorn Group Ltd for three years:
4
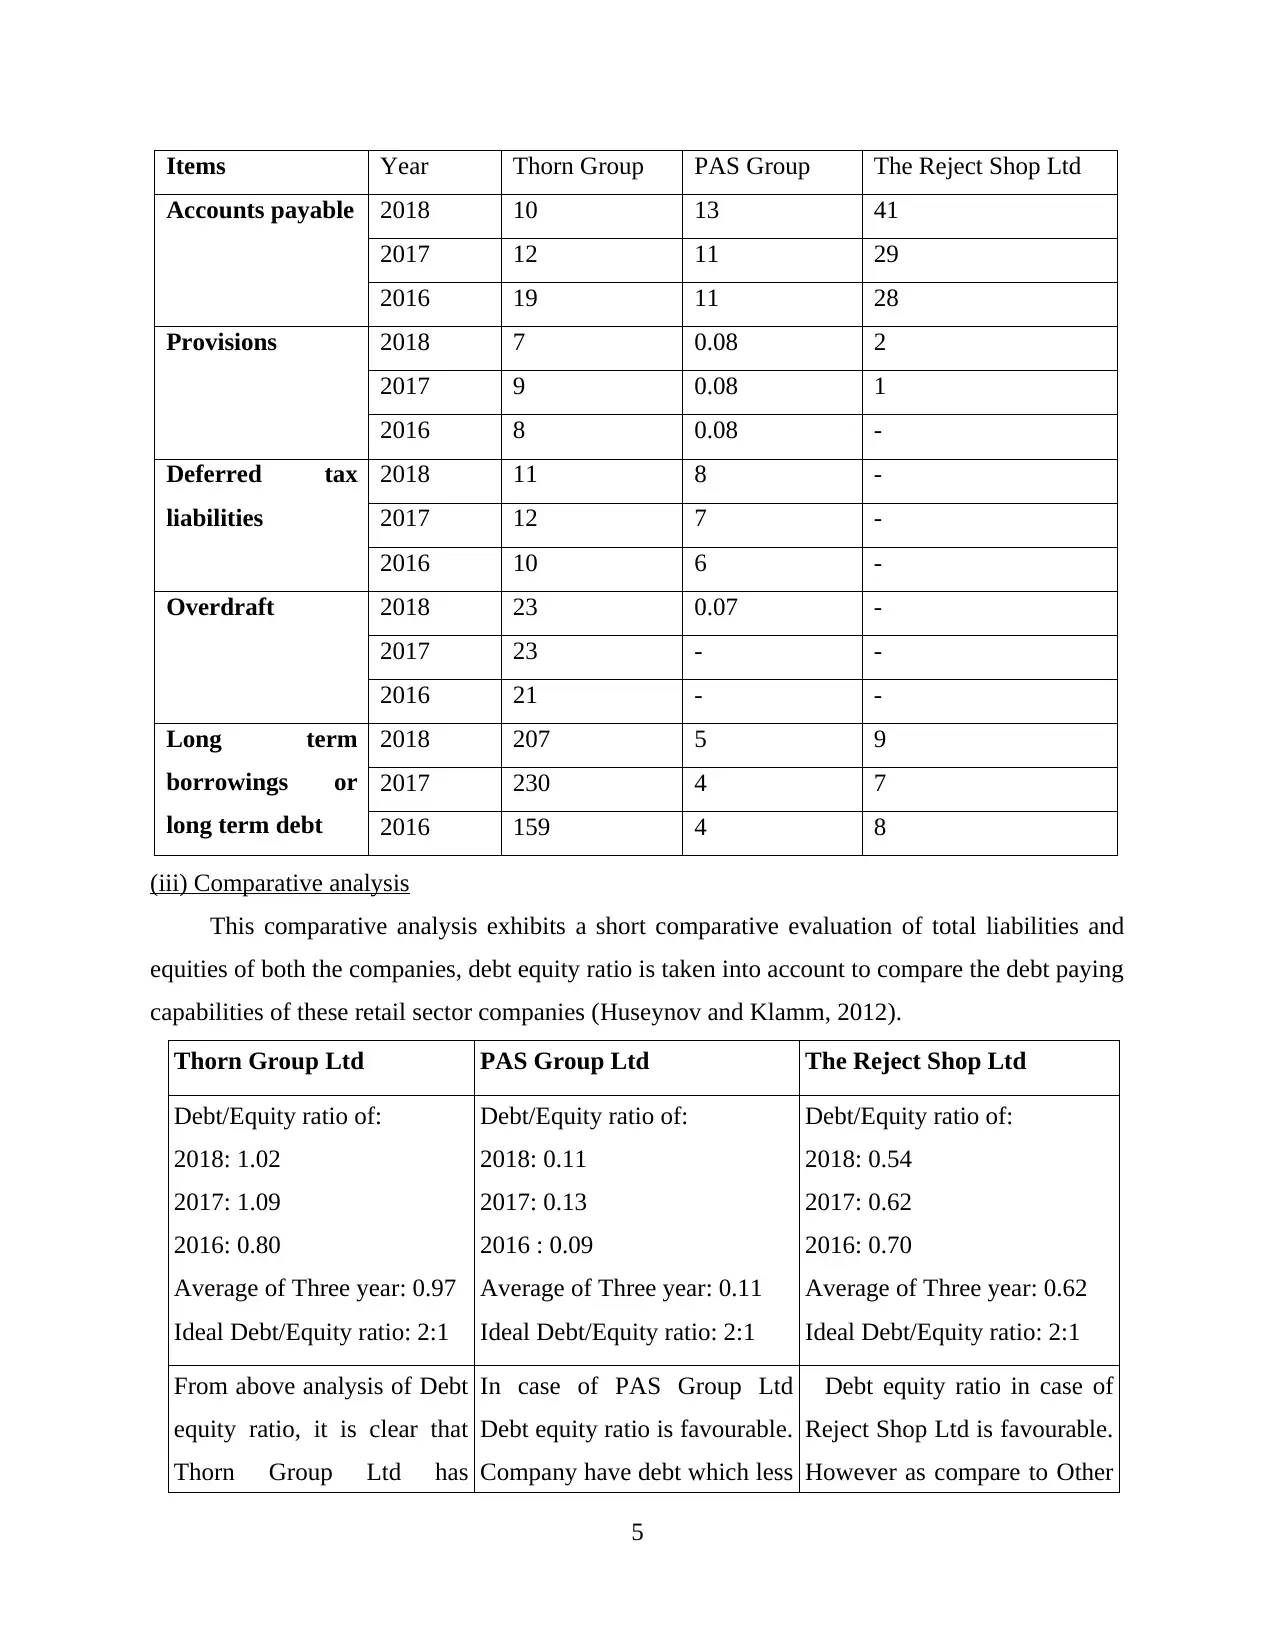
Items Year Thorn Group PAS Group The Reject Shop Ltd
Accounts payable 2018 10 13 41
2017 12 11 29
2016 19 11 28
Provisions 2018 7 0.08 2
2017 9 0.08 1
2016 8 0.08 -
Deferred tax
liabilities
2018 11 8 -
2017 12 7 -
2016 10 6 -
Overdraft 2018 23 0.07 -
2017 23 - -
2016 21 - -
Long term
borrowings or
long term debt
2018 207 5 9
2017 230 4 7
2016 159 4 8
(iii) Comparative analysis
This comparative analysis exhibits a short comparative evaluation of total liabilities and
equities of both the companies, debt equity ratio is taken into account to compare the debt paying
capabilities of these retail sector companies (Huseynov and Klamm, 2012).
Thorn Group Ltd PAS Group Ltd The Reject Shop Ltd
Debt/Equity ratio of:
2018: 1.02
2017: 1.09
2016: 0.80
Average of Three year: 0.97
Ideal Debt/Equity ratio: 2:1
Debt/Equity ratio of:
2018: 0.11
2017: 0.13
2016 : 0.09
Average of Three year: 0.11
Ideal Debt/Equity ratio: 2:1
Debt/Equity ratio of:
2018: 0.54
2017: 0.62
2016: 0.70
Average of Three year: 0.62
Ideal Debt/Equity ratio: 2:1
From above analysis of Debt
equity ratio, it is clear that
Thorn Group Ltd has
In case of PAS Group Ltd
Debt equity ratio is favourable.
Company have debt which less
Debt equity ratio in case of
Reject Shop Ltd is favourable.
However as compare to Other
5
⊘ This is a preview!⊘
Do you want full access?
Subscribe today to unlock all pages.
Trusted by 1+ million students worldwide
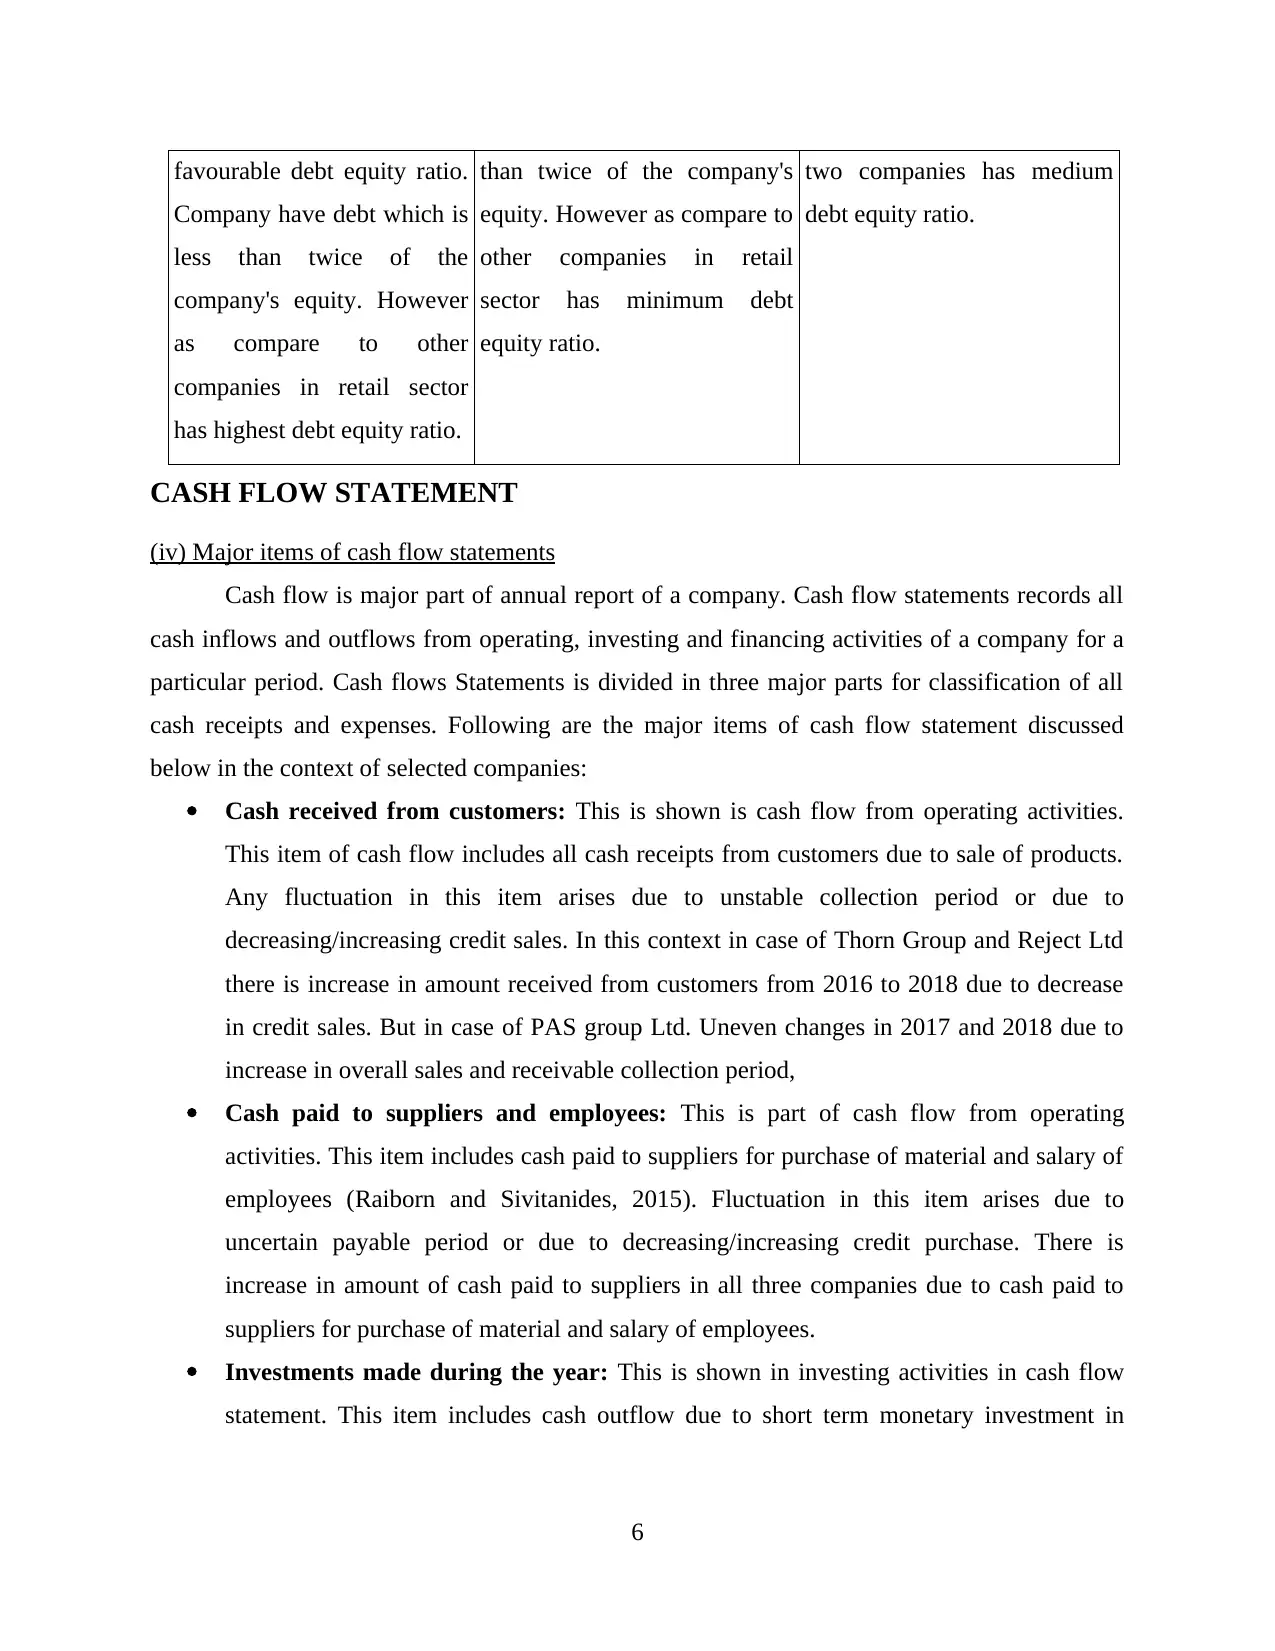
favourable debt equity ratio.
Company have debt which is
less than twice of the
company's equity. However
as compare to other
companies in retail sector
has highest debt equity ratio.
than twice of the company's
equity. However as compare to
other companies in retail
sector has minimum debt
equity ratio.
two companies has medium
debt equity ratio.
CASH FLOW STATEMENT
(iv) Major items of cash flow statements
Cash flow is major part of annual report of a company. Cash flow statements records all
cash inflows and outflows from operating, investing and financing activities of a company for a
particular period. Cash flows Statements is divided in three major parts for classification of all
cash receipts and expenses. Following are the major items of cash flow statement discussed
below in the context of selected companies:
Cash received from customers: This is shown is cash flow from operating activities.
This item of cash flow includes all cash receipts from customers due to sale of products.
Any fluctuation in this item arises due to unstable collection period or due to
decreasing/increasing credit sales. In this context in case of Thorn Group and Reject Ltd
there is increase in amount received from customers from 2016 to 2018 due to decrease
in credit sales. But in case of PAS group Ltd. Uneven changes in 2017 and 2018 due to
increase in overall sales and receivable collection period,
Cash paid to suppliers and employees: This is part of cash flow from operating
activities. This item includes cash paid to suppliers for purchase of material and salary of
employees (Raiborn and Sivitanides, 2015). Fluctuation in this item arises due to
uncertain payable period or due to decreasing/increasing credit purchase. There is
increase in amount of cash paid to suppliers in all three companies due to cash paid to
suppliers for purchase of material and salary of employees.
Investments made during the year: This is shown in investing activities in cash flow
statement. This item includes cash outflow due to short term monetary investment in
6
Paraphrase This Document
Need a fresh take? Get an instant paraphrase of this document with our AI Paraphraser
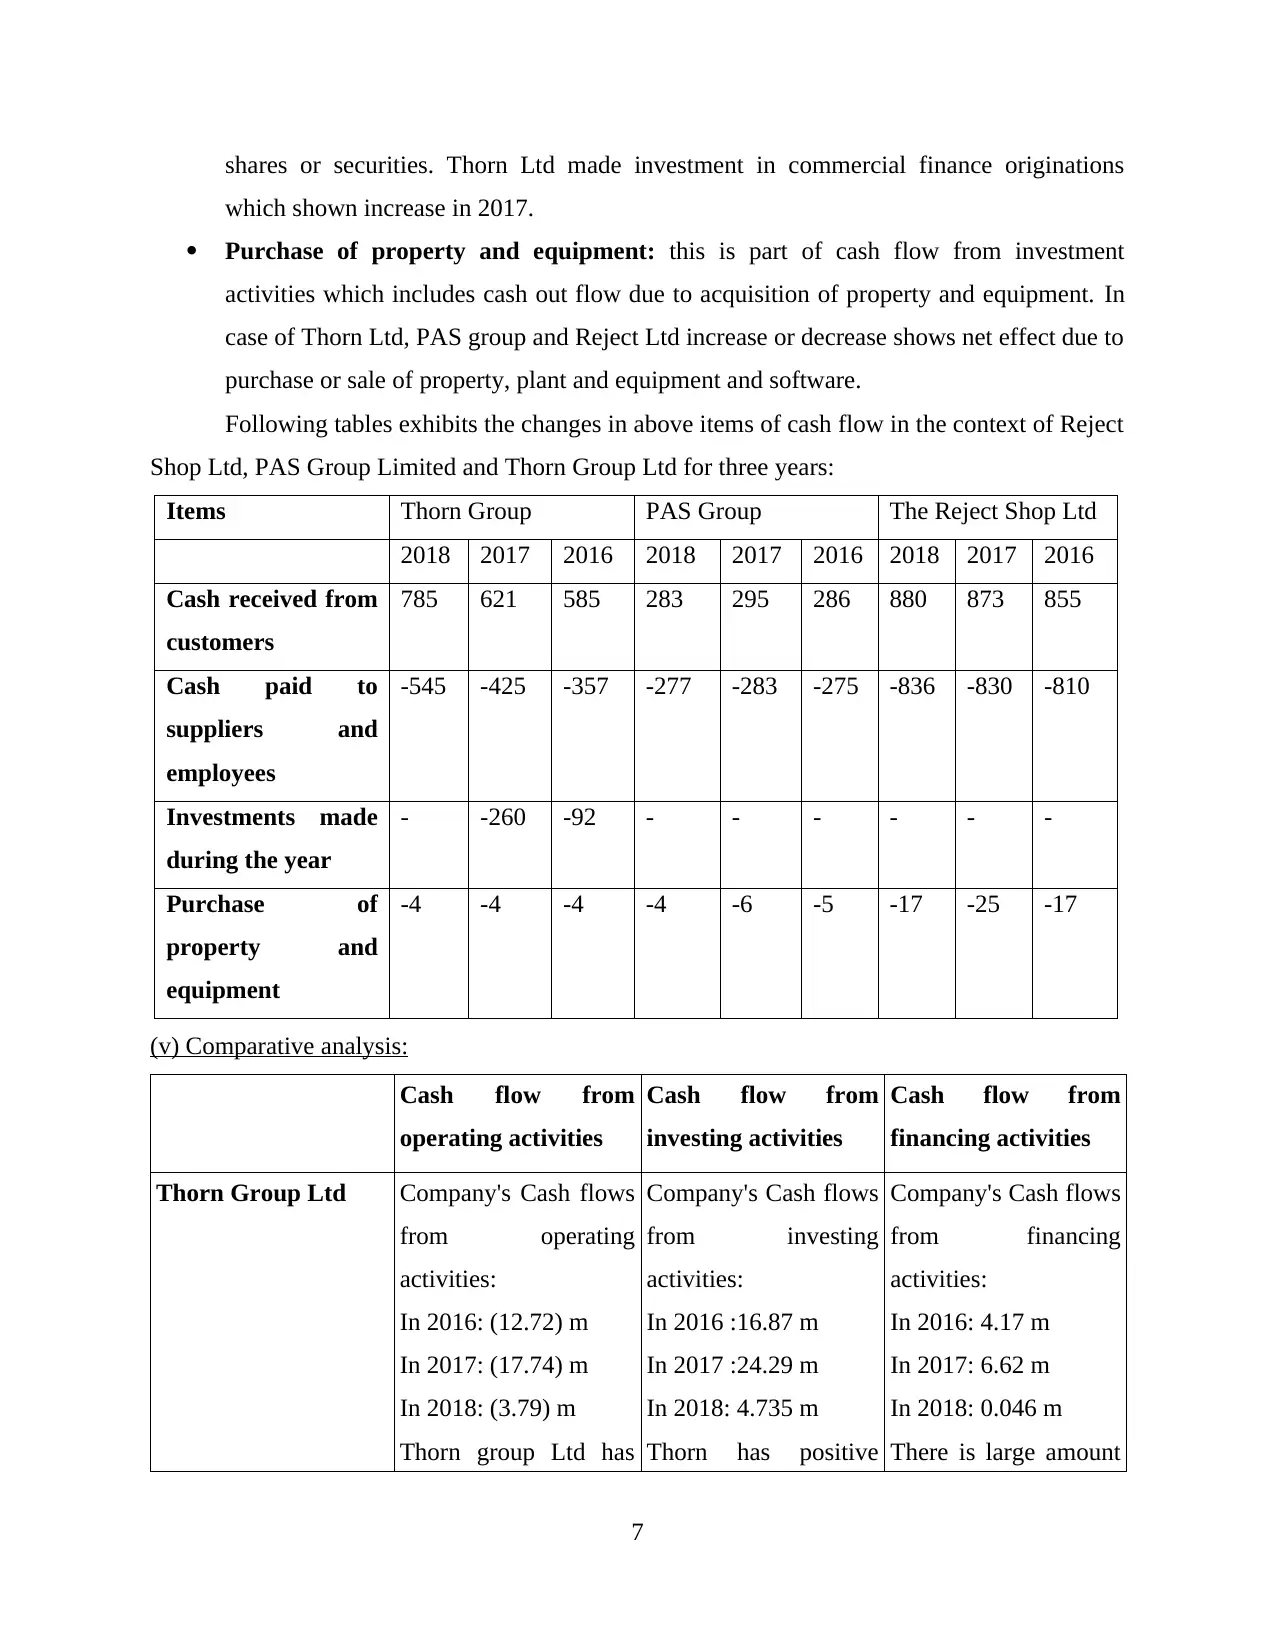
shares or securities. Thorn Ltd made investment in commercial finance originations
which shown increase in 2017.
Purchase of property and equipment: this is part of cash flow from investment
activities which includes cash out flow due to acquisition of property and equipment. In
case of Thorn Ltd, PAS group and Reject Ltd increase or decrease shows net effect due to
purchase or sale of property, plant and equipment and software.
Following tables exhibits the changes in above items of cash flow in the context of Reject
Shop Ltd, PAS Group Limited and Thorn Group Ltd for three years:
Items Thorn Group PAS Group The Reject Shop Ltd
2018 2017 2016 2018 2017 2016 2018 2017 2016
Cash received from
customers
785 621 585 283 295 286 880 873 855
Cash paid to
suppliers and
employees
-545 -425 -357 -277 -283 -275 -836 -830 -810
Investments made
during the year
- -260 -92 - - - - - -
Purchase of
property and
equipment
-4 -4 -4 -4 -6 -5 -17 -25 -17
(v) Comparative analysis:
Cash flow from
operating activities
Cash flow from
investing activities
Cash flow from
financing activities
Thorn Group Ltd Company's Cash flows
from operating
activities:
In 2016: (12.72) m
In 2017: (17.74) m
In 2018: (3.79) m
Thorn group Ltd has
Company's Cash flows
from investing
activities:
In 2016 :16.87 m
In 2017 :24.29 m
In 2018: 4.735 m
Thorn has positive
Company's Cash flows
from financing
activities:
In 2016: 4.17 m
In 2017: 6.62 m
In 2018: 0.046 m
There is large amount
7
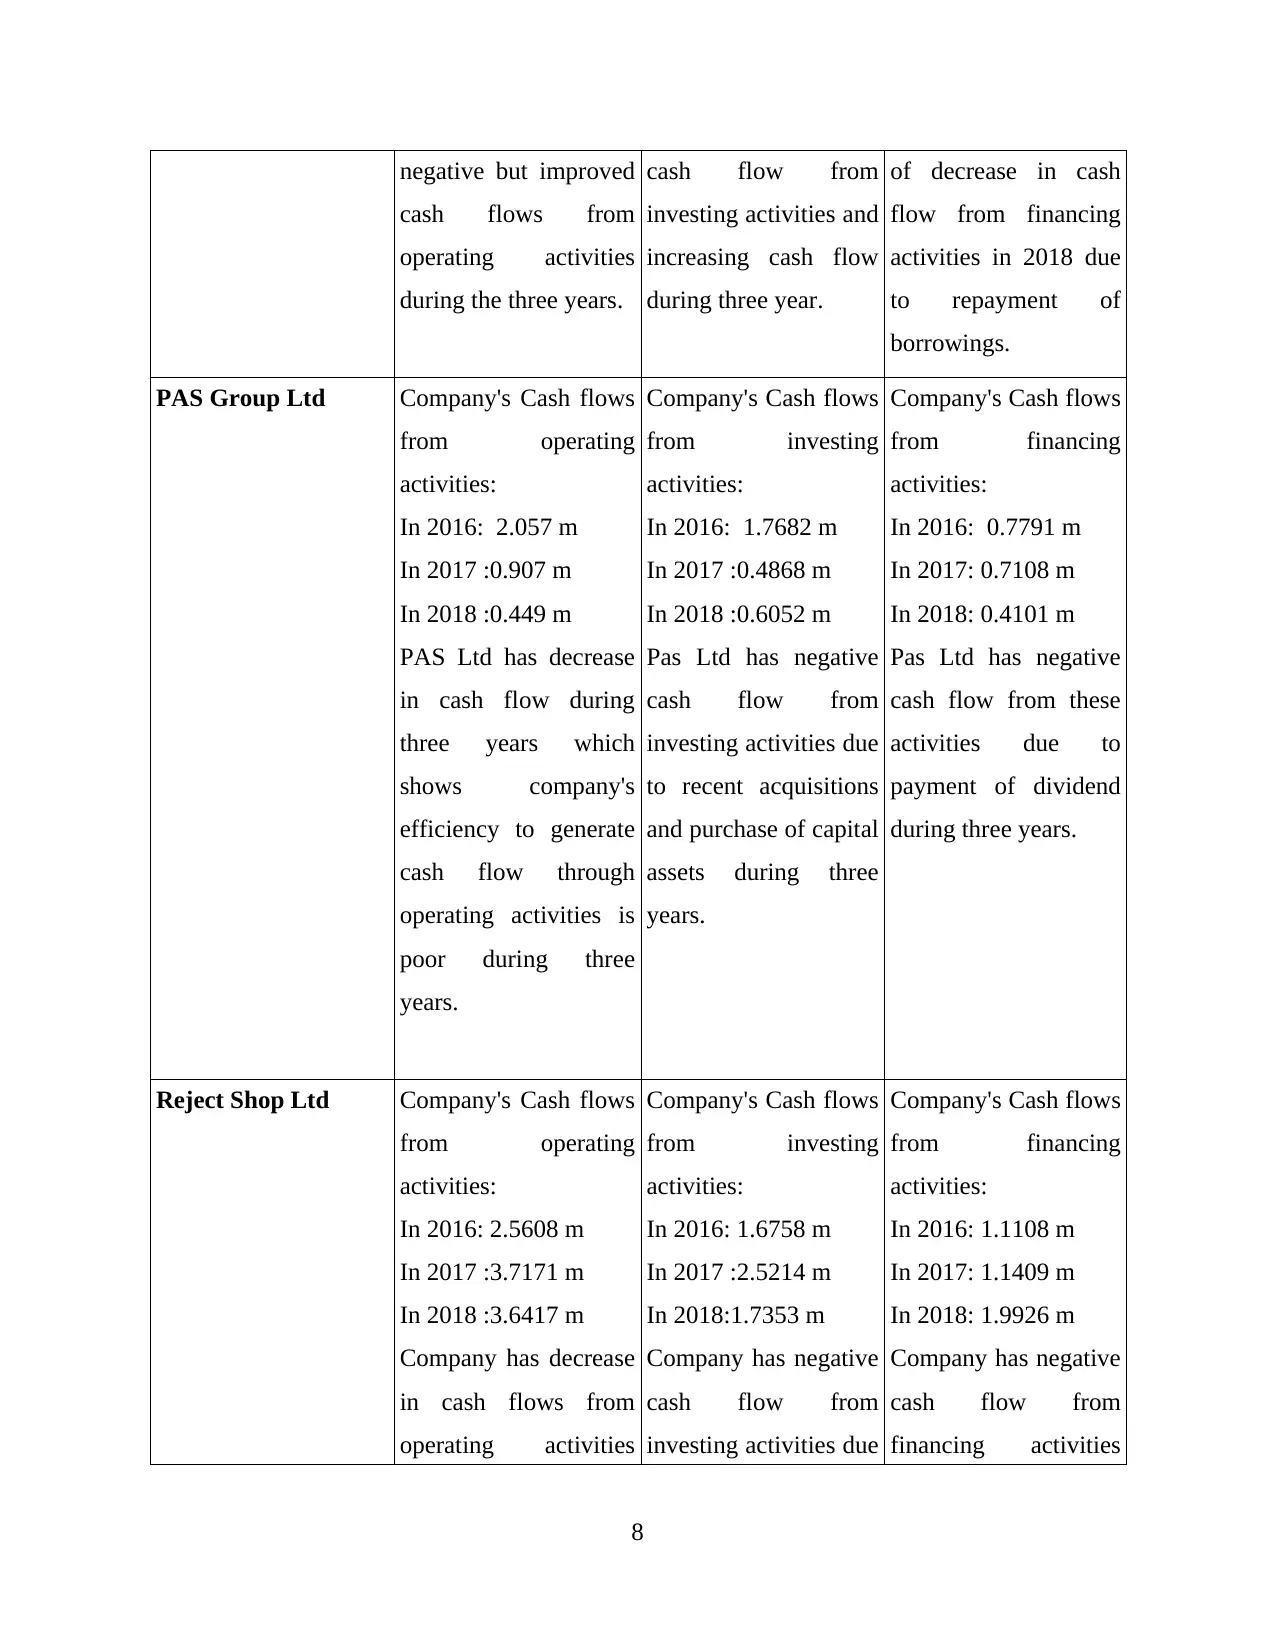
negative but improved
cash flows from
operating activities
during the three years.
cash flow from
investing activities and
increasing cash flow
during three year.
of decrease in cash
flow from financing
activities in 2018 due
to repayment of
borrowings.
PAS Group Ltd Company's Cash flows
from operating
activities:
In 2016: 2.057 m
In 2017 :0.907 m
In 2018 :0.449 m
PAS Ltd has decrease
in cash flow during
three years which
shows company's
efficiency to generate
cash flow through
operating activities is
poor during three
years.
Company's Cash flows
from investing
activities:
In 2016: 1.7682 m
In 2017 :0.4868 m
In 2018 :0.6052 m
Pas Ltd has negative
cash flow from
investing activities due
to recent acquisitions
and purchase of capital
assets during three
years.
Company's Cash flows
from financing
activities:
In 2016: 0.7791 m
In 2017: 0.7108 m
In 2018: 0.4101 m
Pas Ltd has negative
cash flow from these
activities due to
payment of dividend
during three years.
Reject Shop Ltd Company's Cash flows
from operating
activities:
In 2016: 2.5608 m
In 2017 :3.7171 m
In 2018 :3.6417 m
Company has decrease
in cash flows from
operating activities
Company's Cash flows
from investing
activities:
In 2016: 1.6758 m
In 2017 :2.5214 m
In 2018:1.7353 m
Company has negative
cash flow from
investing activities due
Company's Cash flows
from financing
activities:
In 2016: 1.1108 m
In 2017: 1.1409 m
In 2018: 1.9926 m
Company has negative
cash flow from
financing activities
8
⊘ This is a preview!⊘
Do you want full access?
Subscribe today to unlock all pages.
Trusted by 1+ million students worldwide
1 out of 36
Related Documents


Your All-in-One AI-Powered Toolkit for Academic Success.
+13062052269
info@desklib.com
Available 24*7 on WhatsApp / Email
![[object Object]](/_next/static/media/star-bottom.7253800d.svg)
Unlock your academic potential
Copyright © 2020–2026 A2Z Services. All Rights Reserved. Developed and managed by ZUCOL.