Corporate Financial Management Report: PGBM142, Semester 1
VerifiedAdded on 2023/01/06
|20
|4529
|63
Report
AI Summary
This report on financial management delves into key concepts such as diversification as a risk management strategy, exploring how portfolios can be structured to mitigate risk and optimize returns. It then examines various methods for company valuation, including the Price/Earnings (P/E) ratio, dividend valuation models, and the discounted cash flow (DCF) method, detailing their key drivers and applications. The report also assesses investment appraisal techniques, such as the payback period, accounting rate of return (ARR), net present value (NPV), and internal rate of return (IRR), evaluating their effectiveness in determining the feasibility of investment projects. The report provides calculations and interpretations for each technique, offering a comprehensive overview of financial management principles and their practical application in corporate decision-making. The report is divided into sections, with Task 1 focusing on diversification, Task 2 on company valuation, and Task 3 on investment appraisal techniques. The report utilizes models and formulas to analyze financial data and make informed recommendations.

Financial Management
Paraphrase This Document
Need a fresh take? Get an instant paraphrase of this document with our AI Paraphraser

Contents
Introduction.................................................................................................................................................3
Part B...........................................................................................................................................................3
Task 1......................................................................................................................................................3
Diversification.....................................................................................................................................3
Task 2......................................................................................................................................................5
Valuation of a company.......................................................................................................................5
Key drivers of valuation models........................................................................................................10
Task 3....................................................................................................................................................12
Investment appraisal techniques........................................................................................................12
Evaluation of investment appraisal techniques..................................................................................15
Conclusion.................................................................................................................................................19
REFERENCES..........................................................................................................................................20
Introduction
Each investor wishes to optimize benefit and minimize risk. Both investments include a return-
compensated risk factor. More chance is the return, as the expression goes. Therefore, an
investor has to take more chances in order to get more income (Shapiro and Hanouna, 2019). The
diversification of the portfolio with various instruments with various costs and returns is yet
another way to minimize risk. In the first section, an investor explores how both risk and income
should be managed. In the second part of the appraisal of a organization, various approaches are
used. The investment valuation strategies for deeper comprehension are seen in the final section
of the report.
Part B
Task 1
Diversification
Diversity is a risk control strategy. An investment is converted into a broad number of financial
tools in a system in order to minimize risk for any particular vessel of investing. Another
concept behind this strategy is that a multiple-asset portfolio will produce larger long-term
rewards whereas reducing the risk associated with single assets, i.e. the gains from good
investing will compensate for the loss incurred by other investments' bad results. Bonds and
stocks, for example, are normally mutually incompatible (Apte and Kapshe, 2020). If the
economy weakens, it is possible that asset prices will crash. Central banks cut interest rates in
order to save economies in this situation to lower borrowing costs and to raise market expenses.
This adds to a rise in bond yields. If an investor owns portfolio securities and stocks, the increase
in bond value could compensate for a decrease in stock valuation. And the burden was at least
decreased even though revenues were not raised.
Investors of any capital asset not only make gains, but also risk, the most critical aspect of the
decision-making process as they chose to expand. Risks are the risk of a real investment return
being different from the theoretical return. Each investment entails a risk and each investor has a
particular risk tolerance. Two examples of payment risk are structural hazards and unspecific
⊘ This is a preview!⊘
Do you want full access?
Subscribe today to unlock all pages.
Trusted by 1+ million students worldwide
hazards. Systematic value is also referred as market risk as it macro-effects certain threats.
Popular categories of structural risks include interest rate risks, inflation, market liquidity, etc.
Unsystematically, the threats in these groups often impact particular sectors or businesses.
Changes in ownership, retrieval of goods, new major business players, etc. Both are common and
challenging to diversify systemic threats. The challenge of investors controlling by expanding
their investments is unbundling. Each expenditure entails a risk and each shareholder has a
particular risk tolerance. Two examples of payment risk are structural hazards and unspecific
hazards. Systematic value is also referred as market risk as it macro-effects certain threats.
Popular category of structural risks includes interest rate risks, inflation, market liquidity, etc.
Unsystematically, the threats in these groups often impact particular sectors or businesses.
Changes in ownership, retrieval of goods, new major business players etc. Both are common and
challenging to diversify systemic threats. The challenge of investors controlling by expanding
their investments is unbundling. The equity investors pre-estimate these returns without spending
elsewhere in their capital. In these equations, certain profitability statements help (Mitchell and
Calabrese, 2019). It helps to define the relationship between profits per share and the market
price per share, for instance, of earnings return. The P / E ratio remains the same. It's a nice
return on the metric of investment. Shareholder preparation is performed in many ways to
maintain a diversified portfolio to reduce the risk to compensate risks for future gains. Any of
them are stated below:
• First of all, in contrast to projected returns, investors will define their risk appetite. Their
Portfolio can then be expanded to various investment resources including currency, stocks,
shares, reciprocal fund funds, ETFs, Gold, etc.
• Diversification must also be followed across of form of capital channel. For instance, securities
vary according to sector, market cap, area, revenue, valuation, growth, etc.
• Aim to define and include risk-factor-vitiating securities that pose threats to each other. Only
other thing to note is that diversifying is not a single process. Investors must periodically track
their investment results and modify their shares in compliance with their priorities and
objectives.
Paraphrase This Document
Need a fresh take? Get an instant paraphrase of this document with our AI Paraphraser
Task 2
Valuation of a company
It is a method to measure the economic worth of an entire organization or unit of operation.
Many elements, such as layout and profits – current and future expectations, trading price, etc.,
are evaluated before valuation is allocation to the company (Al Breiki and Nobanee, 2019).
Many evaluation estimation techniques exist. For starters, the analytical discounted cash flow
(DCF), the Capital Asset Pricing Model (CAPM), the DDM, etc.
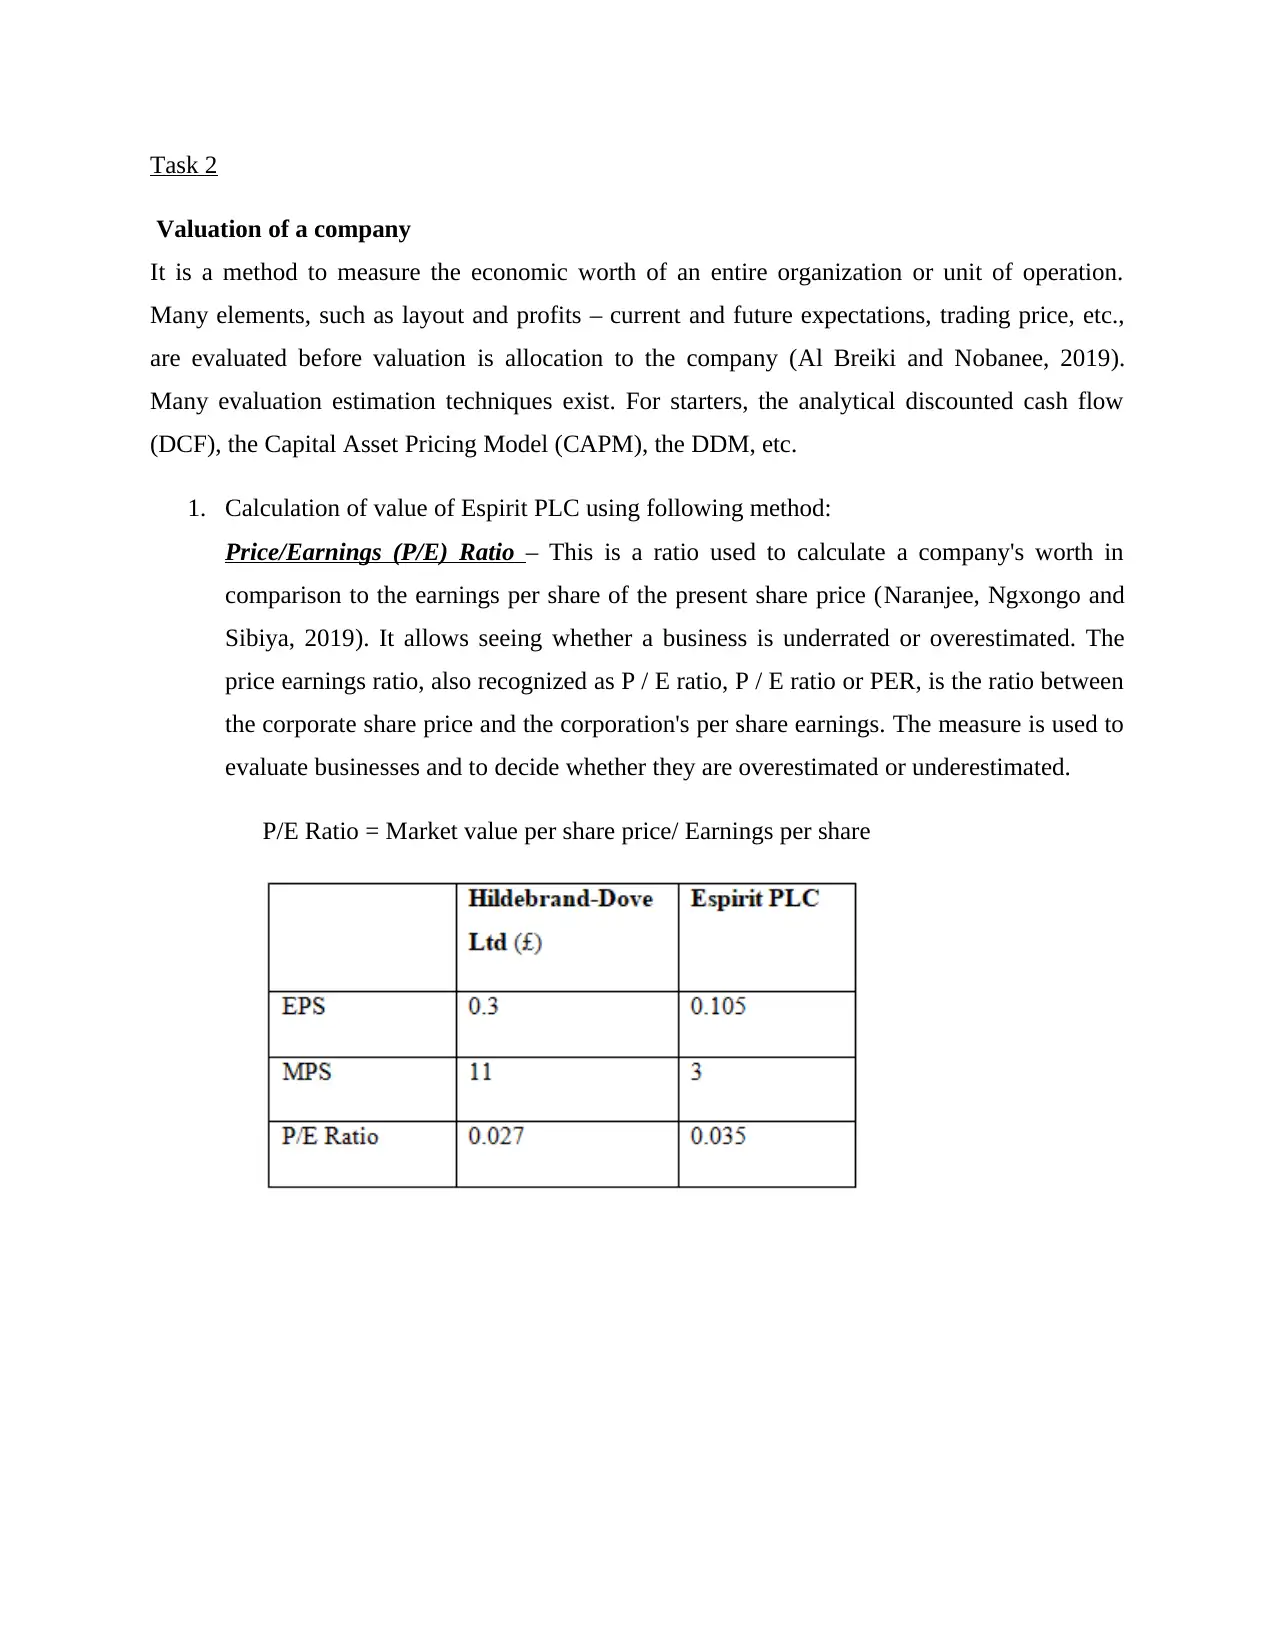
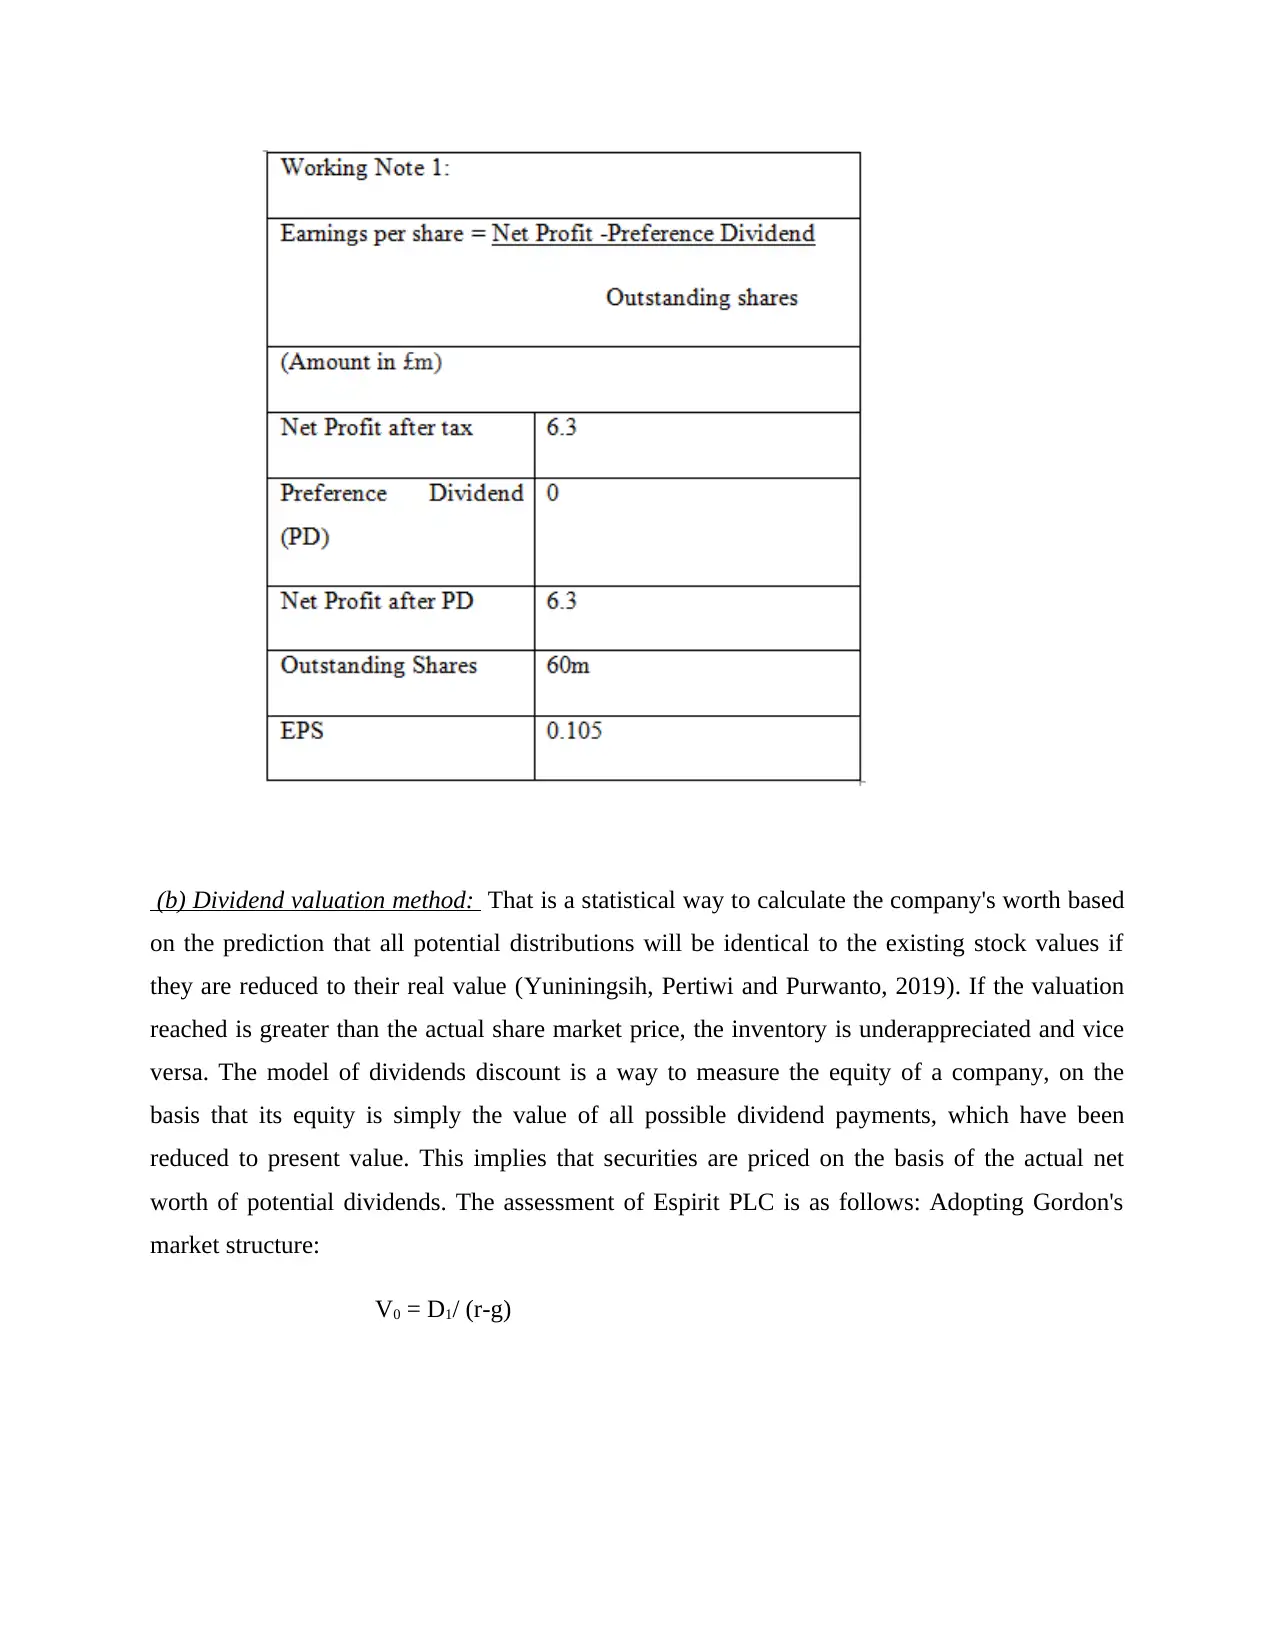
1. Calculation of value of Espirit PLC using following method:
Price/Earnings (P/E) Ratio – This is a ratio used to calculate a company's worth in
comparison to the earnings per share of the present share price (Naranjee, Ngxongo and
Sibiya, 2019). It allows seeing whether a business is underrated or overestimated. The
price earnings ratio, also recognized as P / E ratio, P / E ratio or PER, is the ratio between
the corporate share price and the corporation's per share earnings. The measure is used to
evaluate businesses and to decide whether they are overestimated or underestimated.
P/E Ratio = Market value per share price/ Earnings per share
Valuation of a company
It is a method to measure the economic worth of an entire organization or unit of operation.
Many elements, such as layout and profits – current and future expectations, trading price, etc.,
are evaluated before valuation is allocation to the company (Al Breiki and Nobanee, 2019).
Many evaluation estimation techniques exist. For starters, the analytical discounted cash flow
(DCF), the Capital Asset Pricing Model (CAPM), the DDM, etc.
1. Calculation of value of Espirit PLC using following method:
Price/Earnings (P/E) Ratio – This is a ratio used to calculate a company's worth in
comparison to the earnings per share of the present share price (Naranjee, Ngxongo and
Sibiya, 2019). It allows seeing whether a business is underrated or overestimated. The
price earnings ratio, also recognized as P / E ratio, P / E ratio or PER, is the ratio between
the corporate share price and the corporation's per share earnings. The measure is used to
evaluate businesses and to decide whether they are overestimated or underestimated.
P/E Ratio = Market value per share price/ Earnings per share
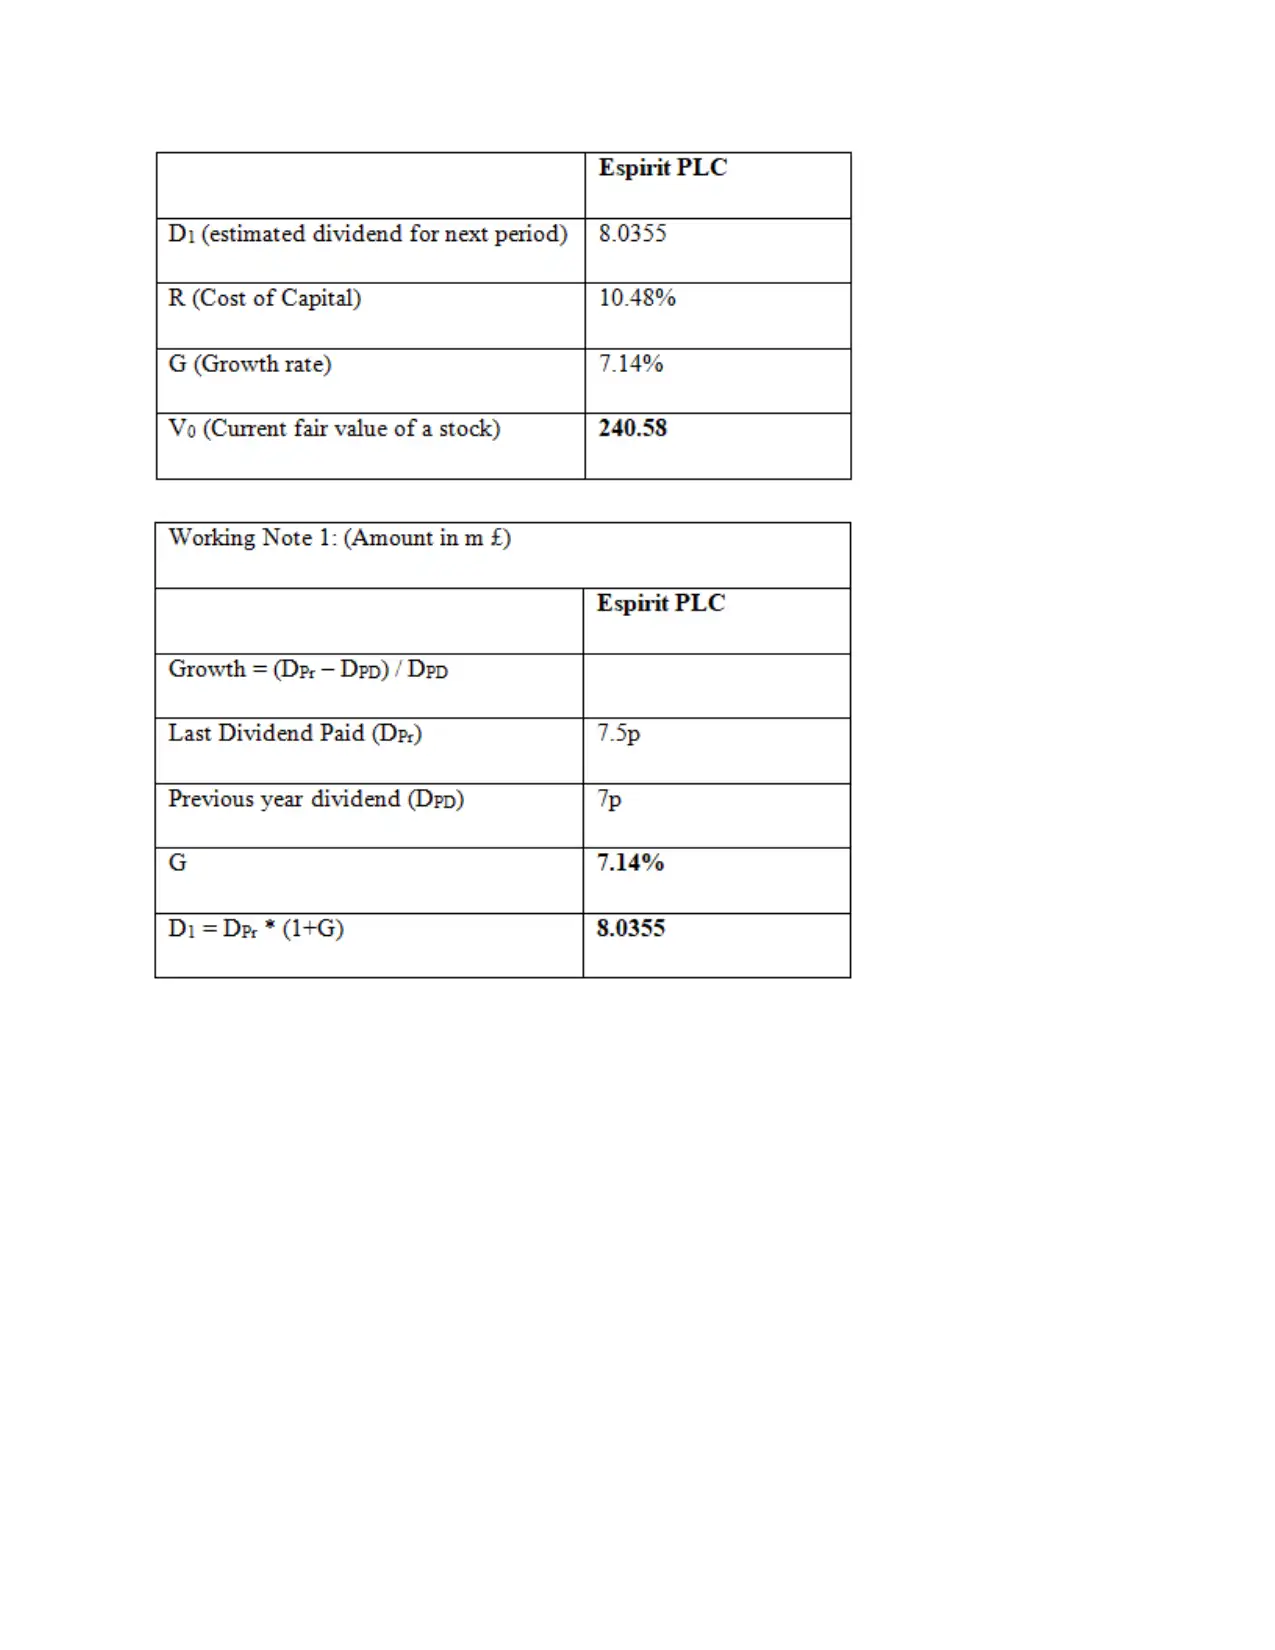
(b) Dividend valuation method: That is a statistical way to calculate the company's worth based
on the prediction that all potential distributions will be identical to the existing stock values if
they are reduced to their real value (Yuniningsih, Pertiwi and Purwanto, 2019). If the valuation
reached is greater than the actual share market price, the inventory is underappreciated and vice
versa. The model of dividends discount is a way to measure the equity of a company, on the
basis that its equity is simply the value of all possible dividend payments, which have been
reduced to present value. This implies that securities are priced on the basis of the actual net
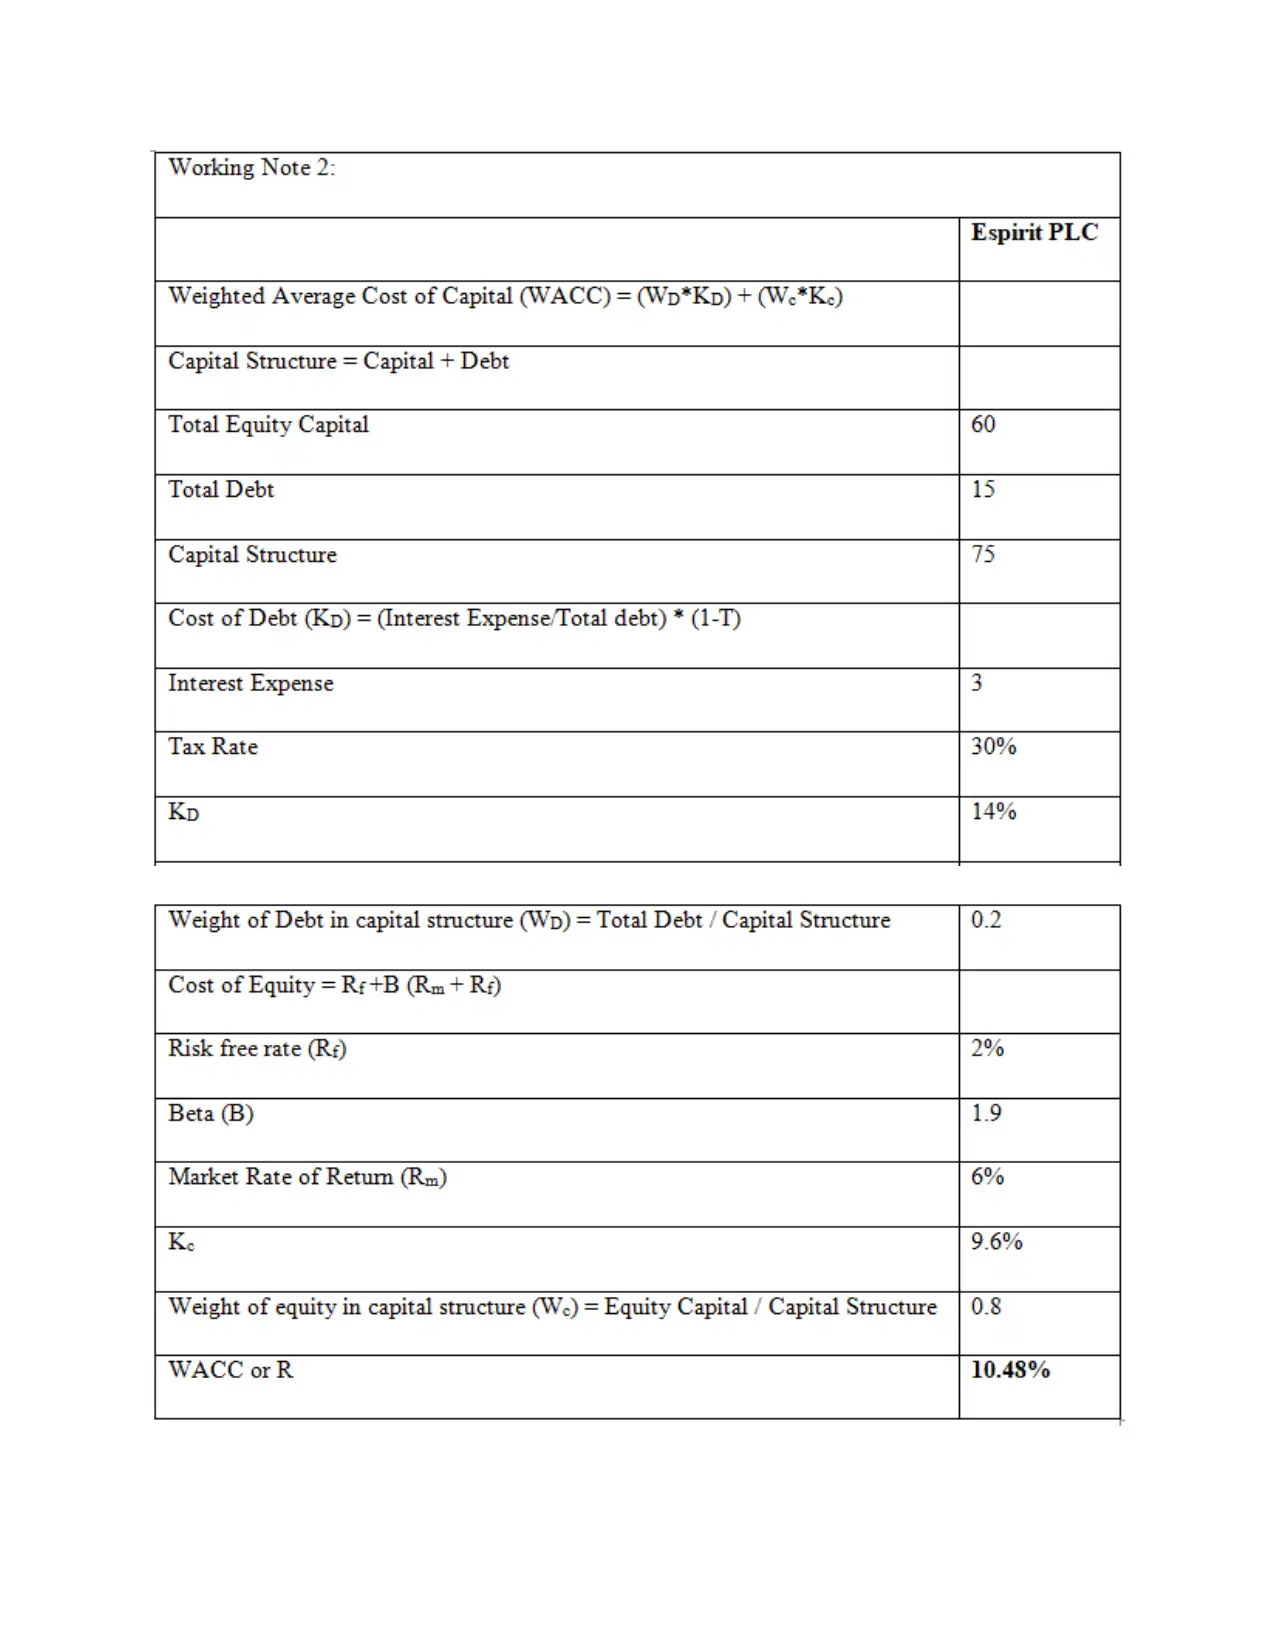
worth of potential dividends. The assessment of Espirit PLC is as follows: Adopting Gordon's
market structure:
V0 = D1/ (r-g)
on the prediction that all potential distributions will be identical to the existing stock values if
they are reduced to their real value (Yuniningsih, Pertiwi and Purwanto, 2019). If the valuation
reached is greater than the actual share market price, the inventory is underappreciated and vice
versa. The model of dividends discount is a way to measure the equity of a company, on the
basis that its equity is simply the value of all possible dividend payments, which have been
reduced to present value. This implies that securities are priced on the basis of the actual net
worth of potential dividends. The assessment of Espirit PLC is as follows: Adopting Gordon's
market structure:
V0 = D1/ (r-g)
⊘ This is a preview!⊘
Do you want full access?
Subscribe today to unlock all pages.
Trusted by 1+ million students worldwide
Paraphrase This Document
Need a fresh take? Get an instant paraphrase of this document with our AI Paraphraser

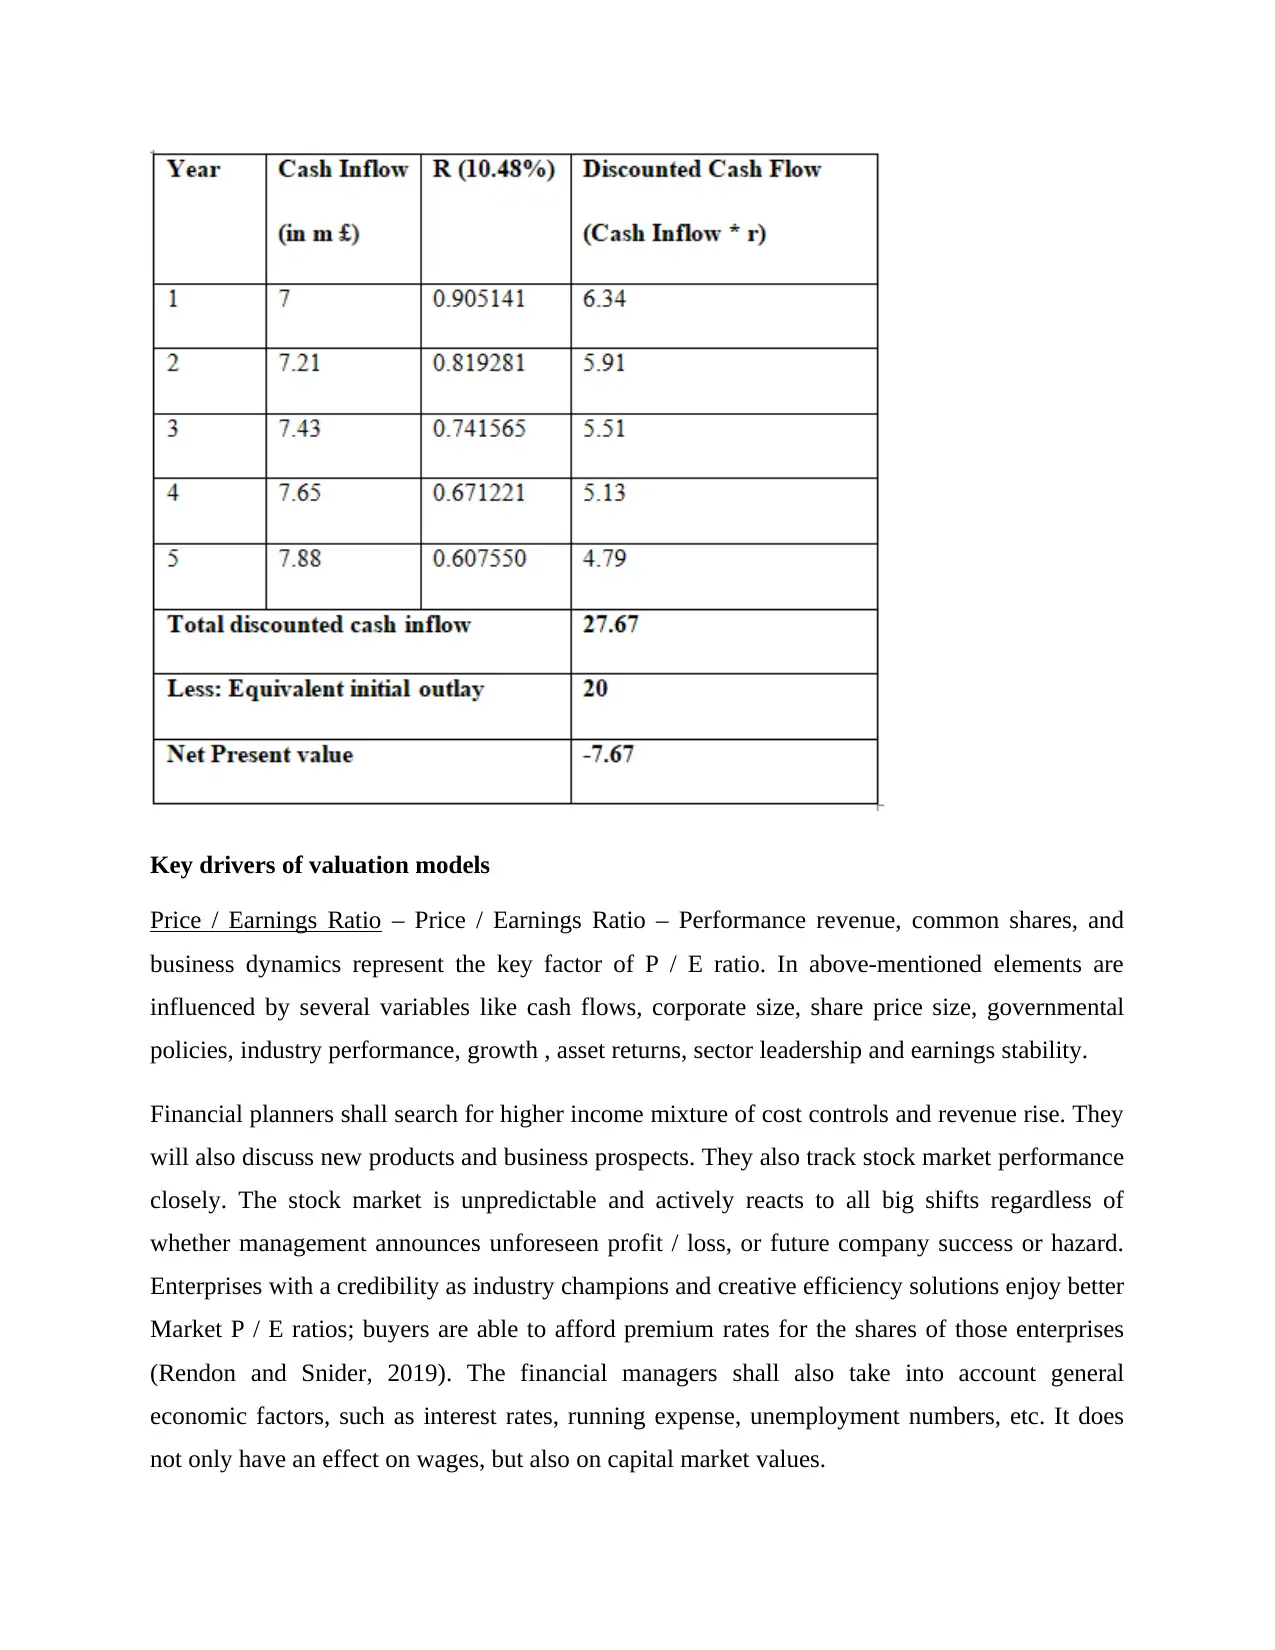
(c) Discounted Cash flow (DCF) method: It is an evaluation approach utilizing discounting
strategies. The estimation of its potential cash flows aims to forecast worth. It aims to assess
today the worth of an asset or expenditure on the basis of potential money predictions. Since it is
dependent on possible predictions and assumptions, it may be misleading (Davidova and
Latruffe, 2020). In financing, a discounted cash flow analysis is a way to determine the time
value of a security, operation, firm or asset. DCF method is normally used in raising capital,
production of real estate, business finance and patent appraisal. A discounted cash flow
assessment can be measured as follows:
⊘ This is a preview!⊘
Do you want full access?
Subscribe today to unlock all pages.
Trusted by 1+ million students worldwide
Key drivers of valuation models
Price / Earnings Ratio – Price / Earnings Ratio – Performance revenue, common shares, and
business dynamics represent the key factor of P / E ratio. In above-mentioned elements are
influenced by several variables like cash flows, corporate size, share price size, governmental
policies, industry performance, growth , asset returns, sector leadership and earnings stability.
Financial planners shall search for higher income mixture of cost controls and revenue rise. They
will also discuss new products and business prospects. They also track stock market performance
closely. The stock market is unpredictable and actively reacts to all big shifts regardless of
whether management announces unforeseen profit / loss, or future company success or hazard.
Enterprises with a credibility as industry champions and creative efficiency solutions enjoy better
Market P / E ratios; buyers are able to afford premium rates for the shares of those enterprises
(Rendon and Snider, 2019). The financial managers shall also take into account general
economic factors, such as interest rates, running expense, unemployment numbers, etc. It does
not only have an effect on wages, but also on capital market values.
Paraphrase This Document
Need a fresh take? Get an instant paraphrase of this document with our AI Paraphraser

Dividend Valuation method: Dividend, earnings growth rates and the corporation's cost of
capital are the major elements of this formula. Variables like cash flows on a daily basis,
retention plans and share price, the dividend payout strategy, cash flow period, equity and debt
rate, potential risk and so on are guided by these elements. The model of dividends discount is a
way to measure the equity of a company, on the basis that its equity is worth the amount of all
possible dividend payments, which have been reduced to present value. This implies that
securities are priced on the basis of the actual net worth of potential dividends.
The financial managers should bear in mind, when assessing an assessment of a business or
investment, that in this model, there are three main factors: dividend yield (DPS), DPS growth
and the target rate of interest. Cash flows should be tracked to ensure continuity among
managers. Capital funding arrangement is the internal management choice such that management
can explore all potential investment choices before selecting one in order to ensure that the
businesses have the lowest expense. Investors can expect a continuous growth rate in business
dividend distributions which are consistent with the payout and retention policies of the
company. The duty of managers is to balance between two. Based on past records and projected
predictions the worth of capital is taken for granted, but in future it is unknown. Thus, allowance
is made on a risk-based basis.
Discounted cash flow method: This methodology is focused solely on potential predictions. It is
also only as precise as the theories. Any prediction is based on main valuation drivers such as
free cash flow forecasting, total costs as underestimating factor, expected cash growth rate,
forecast length, etc.
Cash flows play a significant role and can be stated for this approach to be definitive. The
priority of financial managers is therefore of course on ensuring consistent cash flows. In order
to achieve a better value for the company, they will often perform acts aimed at increasing
revenue, reducing prices, payment mechanisms and debtor requirements, etc. Capital costs are
used as a factor to mitigate costs and thus attempts are often taken to reduce cash position and
debt and equity costs in the financial department schedule (Cangiano and Goodwin-Groen,
2019). At end of the review period, the growth rate in the marginal price represents cash flow
growth. There are therefore attempts to refine it. Another critical aspect that influences duration
of the prediction period, rather than working capital and the dividend yield. Lengthening or

shortening time may have a direct influence on the organization’s valuation and performance. It
should then be assumed to use the time according to the company's necessity.
Task 3
Investment appraisal techniques
a. The Pay Back period:
should then be assumed to use the time according to the company's necessity.
Task 3
Investment appraisal techniques
a. The Pay Back period:
⊘ This is a preview!⊘
Do you want full access?
Subscribe today to unlock all pages.
Trusted by 1+ million students worldwide
1 out of 20
Related Documents


Your All-in-One AI-Powered Toolkit for Academic Success.
+13062052269
info@desklib.com
Available 24*7 on WhatsApp / Email
![[object Object]](/_next/static/media/star-bottom.7253800d.svg)
Unlock your academic potential
Copyright © 2020–2026 A2Z Services. All Rights Reserved. Developed and managed by ZUCOL.